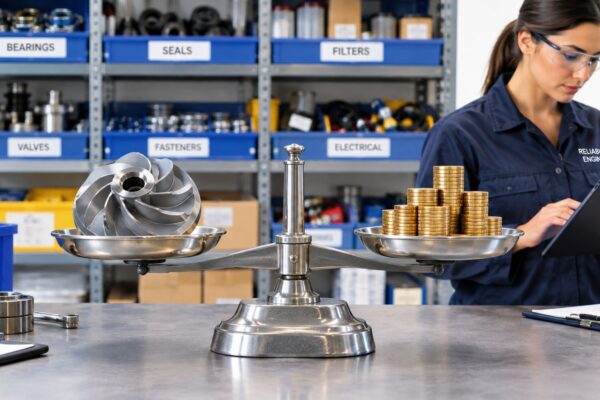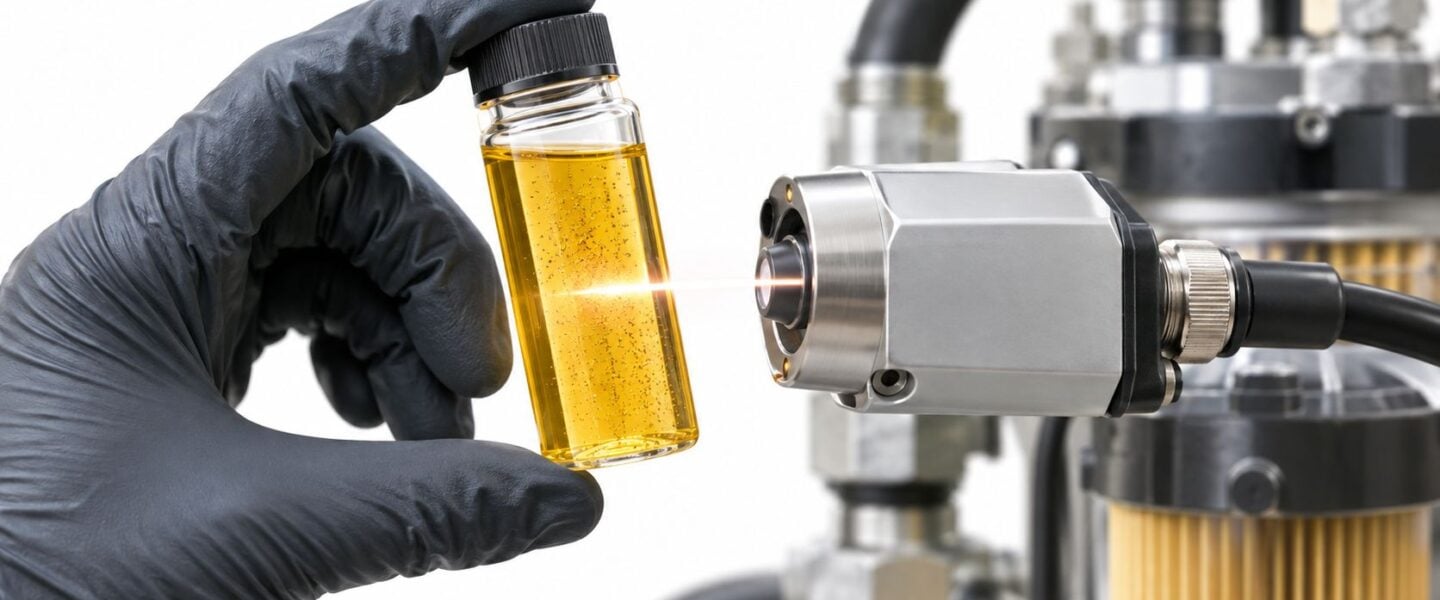
A hydraulic press is producing parts, the reservoir looks clean, and the routine oil report shows no alarming elemental wear trend. Then a proportional valve begins hunting intermittently. The first bottle sample may look acceptable, while a return-line sample reveals that contamination has been rising since the last hydraulic repair. That's the practical value of particle count oil analysis: it shows the solid contamination burden in the fluid now, but only if the sample represents the machine.
Particle count data becomes useful when it drives a decision about filtration, ingress, sampling, or failure risk. A three-number code by itself isn't a diagnosis. It's a decision input that must be interpreted alongside equipment criticality, operating conditions, sample quality, and other oil-analysis results.
Table of Contents
- Why Particle Count Oil Analysis Matters on the Plant Floor
- What Particle Count Oil Analysis Actually Measures
- Comparing Optical Counters, Membrane Patch, and Laser In-Line Methods
- Decoding ISO 4406 and NAS 1638 Cleanliness Codes
- Sampling Practices, Lab Testing, and On-Line Monitoring
- Cleanliness Targets and Failure Modes by Equipment Type
- Decision Thresholds, Filtration, and Remediation Actions
- Building a Particle Count Monitoring Program That Drives Action
Why Particle Count Oil Analysis Matters on the Plant Floor
A stamping plant's hydraulic press line had run three shifts for months when a proportional valve began hunting intermittently. Wear-debris analysis showed no abnormal elemental trend, and spectrographic results appeared clean. The breakthrough came from particle count trending on the reservoir return line. The ISO 4406 code had climbed from 18/16/13 to 22/20/17 over six weeks, with a sharp inflection after a hydraulic repair.
That result changed the maintenance response. The team removed the valve, flushed the loop, and replaced the kidney-loop filter element. The particle count didn't identify the valve manufacturer, the contaminant source, or the exact wear mechanism. It showed that the fluid's contamination state had moved in the wrong direction, and the timing connected the change to a recent intervention.

Why elemental analysis missed the operational risk
Particle count answers a question that spectroscopy and ferrography answer differently. It quantifies the concentration and size distribution of suspended solid particles, while elemental spectroscopy focuses on dissolved or very small elemental material. Analytical ferrography examines ferromagnetic debris, including its size, shape, and wear characteristics.
A hydraulic system can therefore have a clean elemental report and still contain enough larger particulate to affect valve clearance, restrict orifices, damage pump surfaces, or accelerate bearing wear. That's why particle count belongs within a broader condition-based maintenance program, not as a replacement for other diagnostic methods.
Practical rule: Treat a rising particle count as an early contamination-control signal. Treat particle morphology and elemental trends as evidence about origin and failure mechanism.
The most useful interpretation combines four observations:
- Code movement: Is contamination stable, improving, or rising?
- Size distribution: Are smaller particles increasing, or are larger particles appearing?
- Location: Does the sample come from the reservoir, return line, pressure line, or offline loop?
- Event history: Did the change follow a repair, filter replacement, seal failure, or oil transfer?
Particle count oil analysis becomes a reliability tool when those observations lead to action before a servo valve sticks or a pump loses efficiency.
What Particle Count Oil Analysis Actually Measures
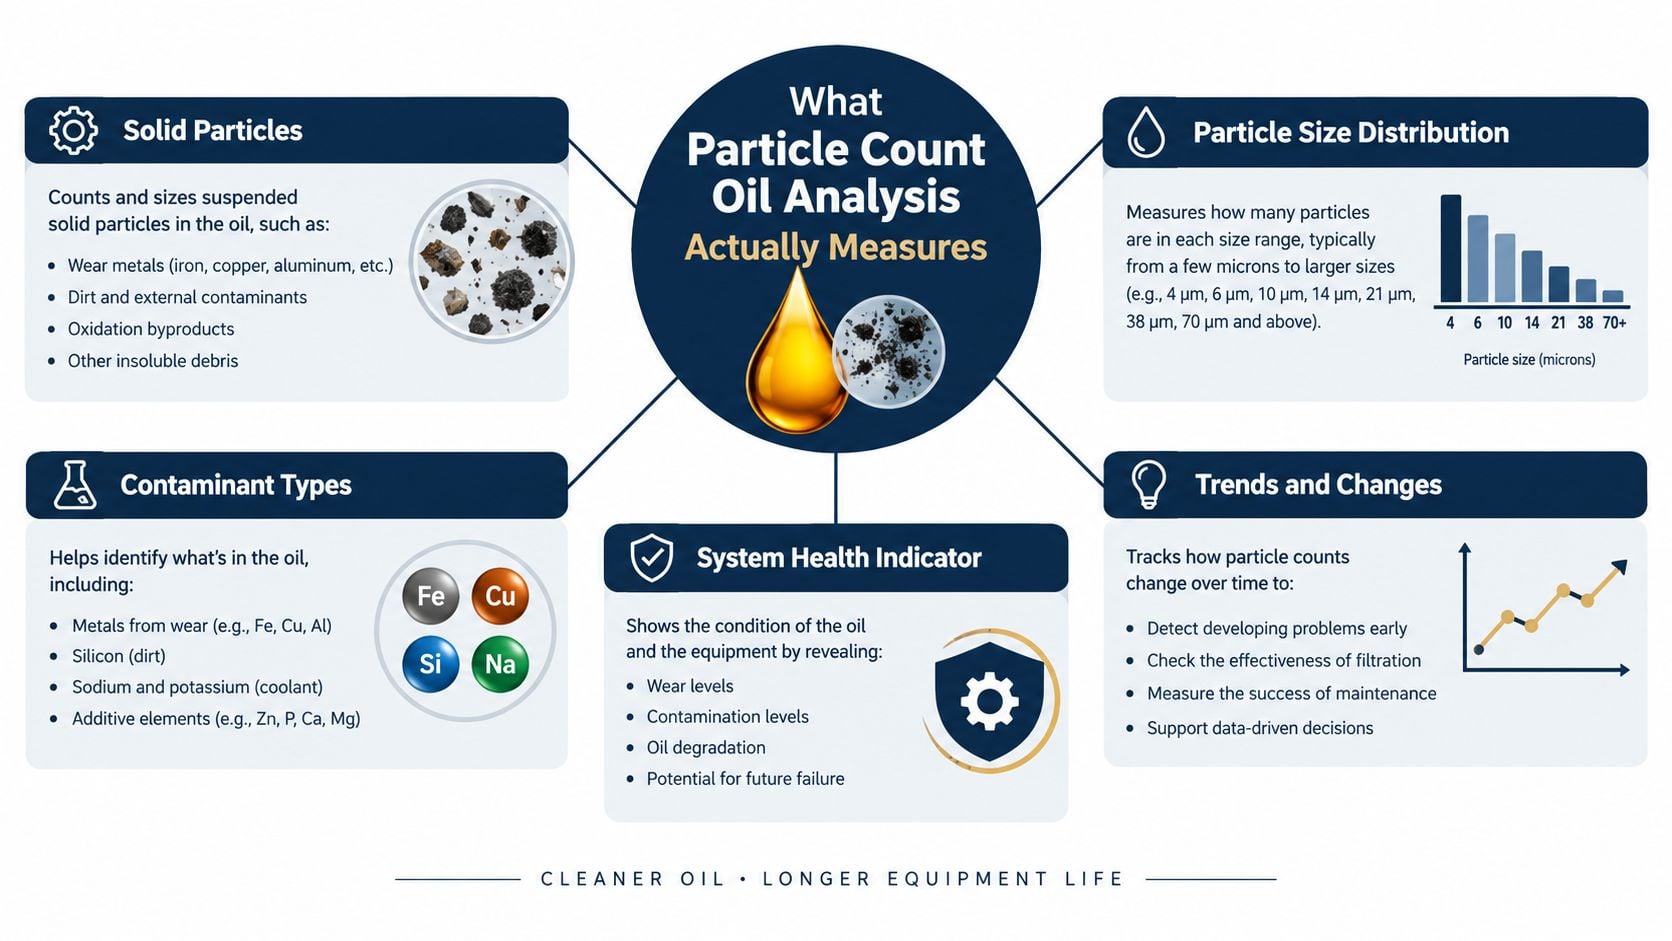
Particle count oil analysis measures the number of solid particles suspended in a fluid sample, organized by particle size. The output is commonly expressed as particles per millilitre in defined size channels. Depending on the instrument and reporting method, channels may include 4, 6, 14, 21, 38, and 70 microns, but the reported channels must be understood in the context of the applicable standard.
The test doesn't identify the material. It can't tell whether a particle came through a failed breather, entered during top-up, detached from a deteriorating seal, or formed as wear debris inside a pump. It also doesn't establish whether every counted object is hard, abrasive, magnetic, or damaging. Optical methods can respond to bubbles, soft contaminants, varnish-related material, or additives if the sample preparation and instrument method don't control those interferences.
Match the test to the maintenance question
A reliability team should select the test based on the decision it needs to make:
- Filter performance: Particle count shows whether contamination is being removed from the circulating fluid.
- Ingress detection: A rising smaller-particle population can support an investigation into breathers, seals, hatches, and oil-transfer practices.
- Cleanliness verification: The result can be compared with the cleanliness target for a hydraulic valve, bearing system, gearbox, or turbine.
- Wear attribution: Spectroscopy, ferrography, or a particle-shape review is needed to investigate whether the particles originate from component distress.
For example, a servo hydraulic system may need a cleanliness decision before its next production campaign. Particle count is the appropriate first measurement because the question is whether the fluid contains too much particulate for the control hardware. If the count rises and the system also shows iron or fatigue debris, the investigation must expand beyond contamination control.
The sample also needs preparation that suits the fluid. Air bubbles, sludge, settling, and high contamination can distort an optical result. A properly collected sample sent through a documented oil sampling and analysis process provides a stronger basis for action than an isolated bottle collected from a convenient drain point.
Comparing Optical Counters, Membrane Patch, and Laser In-Line Methods
No particle-count method is universally superior. Each method answers the contamination question with a different balance of speed, detail, repeatability, and field practicality.
Method comparison
| Method | Standard | Strengths | Limitations |
|---|---|---|---|
| Optical particle counter | ISO 11171 | Rapid multi-channel counts, portable field use, direct ISO coding | Sensitive to bubbles, sampling quality, and optical interference |
| Membrane patch gravimetry | ISO 4405 and older MIL-STD-791 | Useful for confirming the presence and mass of captured solids, strong visual evidence | Slow, provides mass rather than particle-size distribution, requires filtration and inspection |
| Laser in-line counter | Installed monitoring method aligned with applicable cleanliness practices | Continuous measurement, live trending, catches transient contamination events | Installation cleanliness matters, sensor location can bias results, upper-size resolution may be limited |
An optical counter is usually the practical choice for route surveys and laboratory bottle analysis. It can provide counts across several size channels quickly, but the operator must control sampling conditions. A bottle containing entrained air can produce a misleading result, particularly in a hydraulic oil sample drawn too soon after agitation or through a poorly configured port.
Membrane patch gravimetry works differently. A known volume passes through a membrane, and the captured material is assessed by mass and visual examination. It can confirm that a sample contains substantial solids when an optical result is questionable, but it doesn't provide the same size-distribution detail required for interpreting the three-number ISO code.
A laser in-line counter is valuable when contamination changes rapidly. A steel mill may use portable optical counters for monthly surveys on gearbox loops, while installing an in-line unit on a critical hydraulic servo loop. The permanent sensor can identify a transient filter-bypass event and trigger kidney-loop filtration that a monthly bottle sample would likely miss.
The correct method is the one connected to the decision. Use bottle analysis for confirmation and forensic review, and continuous sensing when short-lived events can damage critical equipment.
Method selection should also account for maintenance access, fluid condition, pressure, sensor cleanliness, and the team's ability to validate readings. A structured oil-analysis service can help align the test method with the asset's failure modes rather than treating every sample the same way.
Decoding ISO 4406 and NAS 1638 Cleanliness Codes
A clean-looking sample can still hide a problem if the code is read as a fixed pass-fail rating. ISO 4406 and NAS 1638 are reporting languages, not universal equipment scores. ISO 4406 reports cumulative particle counts above 4 µm(c), 6 µm(c), and 14 µm(c). The result appears as a three-number code, such as 18/16/13, and each higher class represents roughly twice the particle concentration in that size band. ISO 4406 testing guidance explains how the code relates to particle loading, while our oil analysis industrial equipment guide shows how that reading should be used in practice.
NAS 1638 uses size ranges and assigns a cleanliness class from 00 to 12, with lower values indicating cleaner fluid. It came from earlier cleanliness methods used in aerospace and hydraulics. The older method counted particles in one millilitre across 5-15 µm, 15-25 µm, 25-50 µm, 50-100 µm, and greater than 100 µm ranges with optical microscopy. ISO later standardized cumulative reporting, and ISO 4406:1999 replaced the earlier ISO 4406:1987 approach.
Translating the code into loading
A published mapping for ISO 4406 18/16/13 looks like this:
| ISO Code | Particles >4 μm (per mL) | Particles >6 μm (per mL) | Particles >14 μm (per mL) |
|---|---|---|---|
| 18/16/13 | 1,300-2,500 | 320-640 | 40-80 |
The three values are cumulative, not separate bins. The ≥6 µm(c) result includes particles at 6 microns and larger, including those already counted in the ≥14 µm(c) population. A rise in the smallest band can point to new fine ingress. A rise in the largest band usually deserves faster attention because it often reflects active wear debris or a contamination event. Cumulative particle-count guidance gives the logic behind that interpretation.
Historical comparisons need discipline. ISO 4406:2021 remains the dominant cleanliness code, while newer contamination-monitoring approaches extend measurement beyond simple light-obscuration counting. Engineers comparing old NAS reports, ISO 4406:1999 data, and newer reports must confirm the standard, size thresholds, calibration basis, and sample method before treating the numbers as a trend.
A code is a snapshot, not a verdict. The maintenance decision depends on whether the code is credible, how it compares with the asset target, and whether the change matches a real failure opportunity.
Sampling Practices, Lab Testing, and On-Line Monitoring
Sampling technique often determines whether particle count oil analysis describes the machine or the bottle. A sample from a dead leg, a dirty valve, or a recently disturbed reservoir can misdirect a maintenance team even when the laboratory instrument performs correctly.
Build a representative sample
The preferred sample point is a turbulent flow zone that carries circulating oil, not a stagnant drain or quiet reservoir corner. The sampling procedure should control the conditions that influence particle suspension:
- Operate the system under normal conditions before sampling so settled contamination has a reasonable opportunity to re-enter circulation.
- Flush the sample port before collecting the bottle.
- Use clean, appropriate sample containers and protect the cap and fittings from shop contamination.
- Record operating context, including recent maintenance, filter changes, abnormal noise, temperature, and system status.
- Repeat questionable results from the same validated location before authorizing a major intervention.
Particles don't remain uniformly suspended indefinitely. Sludge and heavier debris can settle, while air bubbles can pass through an optical sensor and appear as particles. Poor sample hygiene can therefore produce either an exaggerated result or a falsely clean result.
Explain disagreement between bottle and in-line results
Bottle samples provide an archived specimen and can support laboratory confirmation, but handling and transport create opportunities for contamination or settling. An online laser counter sees the live stream and can capture filter bypass, ingress, and short contamination spikes, but its reading depends heavily on sensor placement, installation cleanliness, flow conditions, and calibration.
When the two methods disagree, the discrepancy is diagnostic rather than automatically a reason to reject one result. The team should check whether the bottle was drawn during circulation, whether the online sensor sits upstream or downstream of filtration, whether the sample line contains air, and whether the two methods use comparable preparation and reporting conventions.
A practical validation exercise compares a properly collected bottle with the online reading during a controlled operating period. If the readings continue to diverge, the next step is to investigate location and sample integrity, not to average the numbers into a convenient conclusion.
Cleanliness Targets and Failure Modes by Equipment Type
Cleanliness targets must reflect component sensitivity and the consequence of failure. A general industrial hydraulic circuit doesn't have the same tolerance as a precision servo loop, and a turbine bearing-lube system doesn't have the same contamination signature as a gear mesh.
The following targets are practical reference points from industrial guidance, not universal pass/fail limits. Actual limits should be confirmed against equipment documentation, component manufacturer requirements, fluid viscosity, filter configuration, and operating severity.
| Equipment Type | Target ISO Code | Particle Size Band to Watch | Typical Failure Mode at Elevated Count |
|---|---|---|---|
| Servo and proportional hydraulics | 18/16/13 or cleaner | ≥6 and ≥14 µm(c) | Valve stiction, servo drift, accelerated pump wear |
| Rolling-element bearings | 19/17/14 | ≥14 µm(c) | Lubricant-film disruption and fatigue damage risk |
| Industrial gears | 20/18/15 | ≥6 µm(c) | Inadequate filtration, abrasive wear, micropitting risk |
| Turbine servo systems | 16/14/11 | ≥6 and ≥14 µm(c) | Control-valve sticking and hydraulic response problems |
| Turbine bearing lubrication | 20/18/15 | ≥14 µm(c) | Surface distress and accelerated bearing degradation |
Read the bands in context
For servo and proportional hydraulics, contamination above the target can create sticking, drift, and loss of repeatable motion. A sudden change after maintenance points toward ingress or poor cleanliness during the repair. A gradual rise suggests that filtration, breathing, seals, or ongoing wear may not be controlling the load.
Bearing systems require a more cautious interpretation. A rising ≥14 µm(c) population can indicate a meaningful increase in larger contamination, but particle count alone doesn't reliably attribute bearing distress. Spectrographic trends, ferrography, vibration, temperature, and lubricant condition should support the decision.
Gearboxes often reveal the consequence of inadequate filtration through increasing medium-sized particles. If a case-hardened gear mesh shows a sustained count rise, the team should inspect filtration suitability, breather condition, oil-transfer practices, and evidence of micropitting or scuffing during planned inspection.
Turbine systems require separation of servo-fluid and bearing-lube requirements. Sudden step changes matter more than a smooth gradual trend when moisture, maintenance debris, or another ingress event enters the system. A published cleanliness reference also emphasizes that targets vary sharply by application and that root-cause checks must accompany the count.
Decision Thresholds, Filtration, and Remediation Actions
A single alarm threshold is a weak maintenance strategy. Hydraulic and lubrication systems may tolerate a brief contamination spike, but a sustained upward trend can indicate that the system is continuously generating or admitting particles. The response should therefore escalate according to trend, magnitude, credibility, and particle character.
| Trend Observation | Likely Cause | Immediate Action | Follow-up |
|---|---|---|---|
| Stable code at target | Effective contamination control | Continue scheduled sampling | Verify filter condition and sample consistency |
| One-class rise | New ingress, sampling variation, or filter loading | Resample and inspect the filter and sample point | Review recent maintenance, breathers, seals, and transfer practices |
| Two-class rise | Significant contamination event or filtration failure | Start offline kidney-loop filtration and confirm with a new sample | Identify ingress source and assess sensitive components |
| Sustained rise | Ongoing ingress, ineffective filtration, or active wear | Plan flushing and root-cause investigation | Verify cleanliness after corrective work and restore the trend baseline |
| Large-particle increase or cutting and fatigue debris | Active component damage or severe event | Protect the asset, inspect critical components, and isolate the source | Combine particle analysis with wear-debris and vibration diagnostics |
A one-class movement shouldn't automatically trigger an oil change. The first response should be a controlled resample and inspection of the filter, breather, seals, and sample point. Replacing oil without removing the ingress source only resets the fluid temporarily.
Offline kidney-loop filtration is appropriate when the system needs contaminant removal while the machine remains available and the contamination source is controlled. A full-system flush is more disruptive but may be necessary after a repair introduces debris, after component damage, or when contamination has reached dead legs and sensitive control hardware.
Replacement elements should be selected using documented efficiency and beta-ratio requirements, not a finer nominal micron label. Maintenance teams also need to distinguish fluid cleanliness from sterile-process concerns. For teams handling regulated filtration environments, sterile filtration compliance tips can provide useful context for documenting integrity and verification practices, although hydraulic and lube-system filtration decisions still require application-specific engineering.
A dirty sample is a prompt to verify the system. It isn't permission to skip root-cause analysis.
Forge Reliability can be included in a broader condition-monitoring response where particle count results need to connect with oil analysis, vibration, thermography, or maintenance planning. The important requirement is a documented decision path, not more testing.
Building a Particle Count Monitoring Program That Drives Action
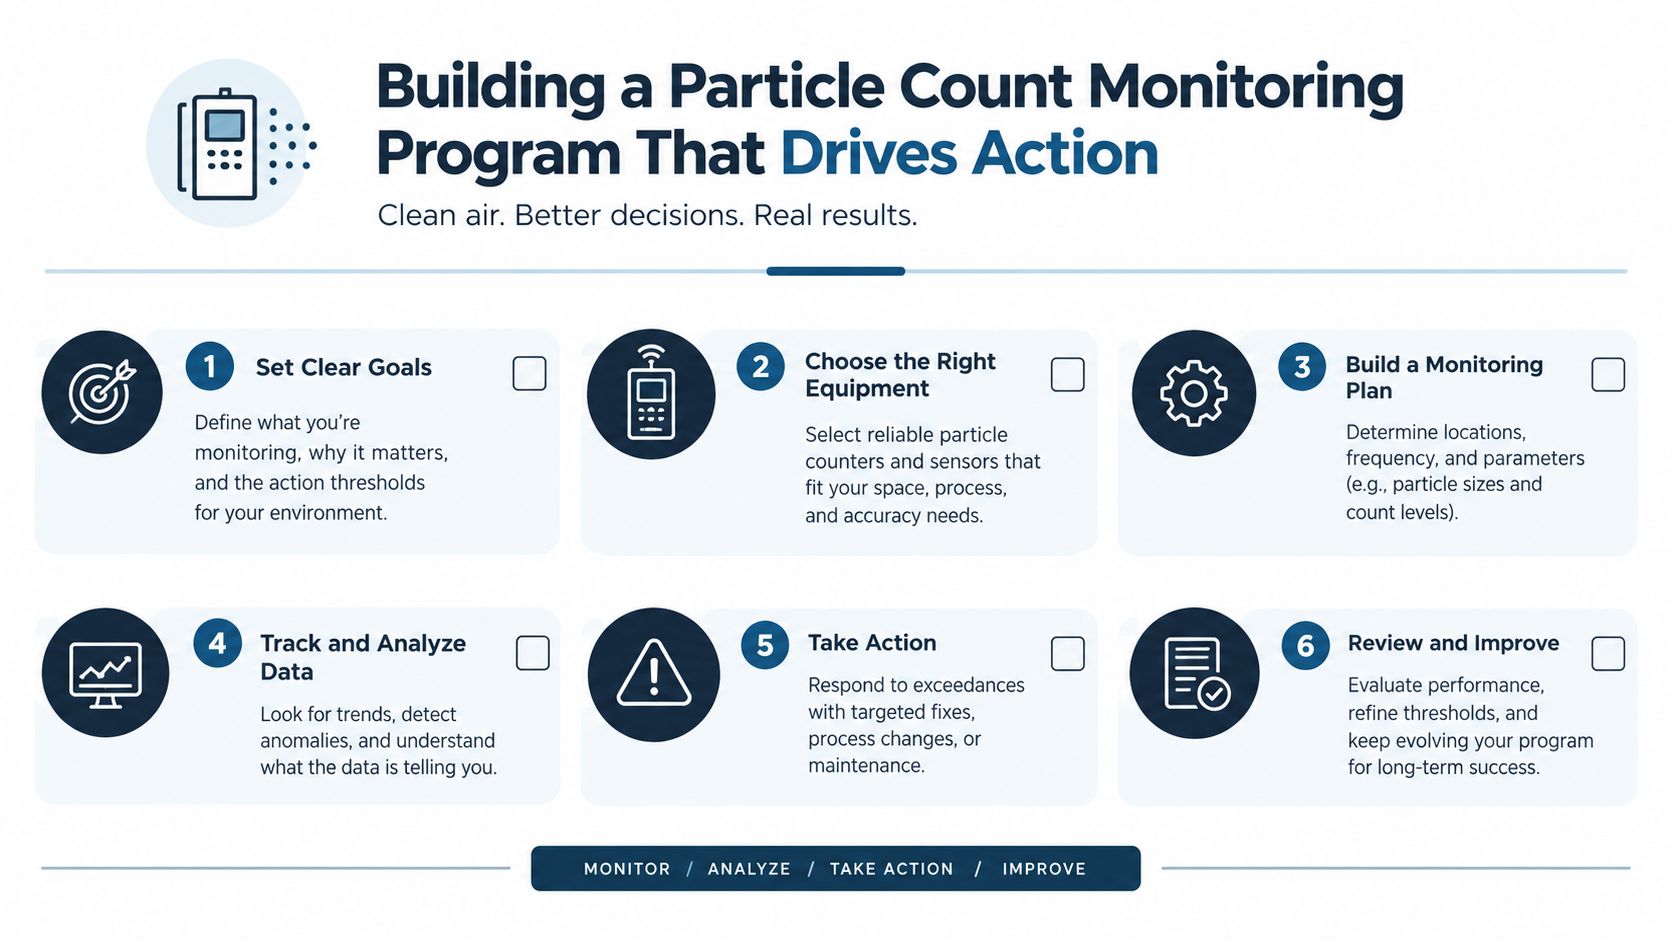
A useful particle count program isn't a quarterly laboratory event. It's a controlled monitoring process with fixed sample points, repeatable intervals, calibrated measurement, trend review, and assigned responses.
Each critical asset needs a baseline cleanliness target tied to its component sensitivity. A hydraulic servo loop may require a tighter target than a general gearbox, while a turbine program may separate servo-fluid and bearing-lube requirements. The target should live in the maintenance system with the sample location, operating condition, responsible technician, and action threshold.
Make the data decision-ready
A mature program includes:
- Defined sampling points: Select circulating locations and document the relationship to pumps, filters, reservoirs, and sensitive components.
- Fixed sampling intervals: Tie collection to operating hours, criticality, recent maintenance, and contamination risk rather than convenience.
- Validated measurement: Route bottles to an appropriately controlled laboratory or use a validated online counter with documented calibration and installation checks.
- Trend dashboards: Review cumulative size-band movement, not just whether the latest three-number code passes a limit.
- Diagnostic pairing: Combine particle count with moisture, viscosity, spectroscopy, ferrography, or a particle quantification index when wear attribution is required.
- Written response rules: Assign ownership for resampling, filtration, flushing, inspection, and closeout verification.
The four thresholds should be visible to every person who reviews the report:
- Target class: Continue monitoring when the code is stable and representative.
- Resample trigger: Investigate a one-class rise or a result that conflicts with operating evidence.
- Filtration trigger: Use offline filtration after a credible two-class rise or significant contamination event.
- Root-cause trigger: Escalate sustained rises, large-particle increases, or cutting and fatigue debris to a broader failure investigation.
A plant that wants to formalize sampling points, diagnostic routes, and maintenance responses can use a 12-month reliability program roadmap as a planning reference. The strongest programs make particle count part of asset strategy, not an isolated laboratory result.
Forge Reliability offers oil analysis and condition-monitoring support that can connect particle count trends with filtration review, sampling validation, and broader equipment diagnostics. Request a free reliability assessment through Forge Reliability to identify vulnerable assets, verify whether current particle-count data is representative, and define practical corrective actions for the plant's hydraulic and lubrication systems.