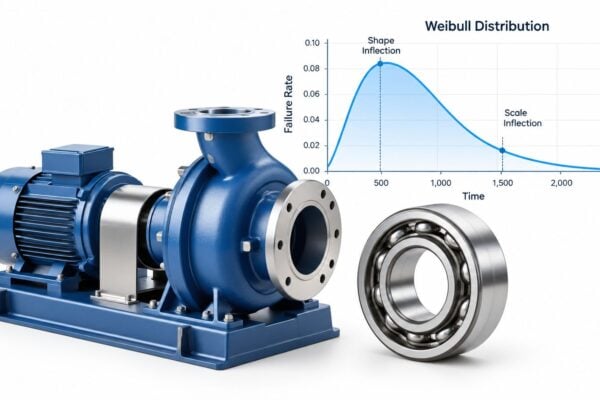
Forty critical pumps, a monthly vibration route, quarterly oil samples, and a stack of alarm printouts that nobody has signed off. That is the usual starting point for a plant asking what AI driven predictive maintenance would add. The measurement program already produces more data than the maintenance team can act on, and two of last quarter's failures arrived with no warning that anyone trusted.
Adoption of the formal discipline is still thin. In 2024, 8% of more than 600 senior decision-makers and maintenance professionals surveyed in the United States, United Kingdom, and Germany said their organizations were operating a predictive-maintenance strategy, according to Censuswide research commissioned by Fluke Reliability. The distance between that figure and the vendor noise is where substantive work sits. It comes down to two things, and neither is the algorithm: whether the data is fit for prediction, and who holds the right to act on an alert.
Table of Contents
- Where AI Fits Beside Condition Monitoring
- How Models Turn Sensor Data into Failure Risk
- Why Accuracy Misleads on Rare Failures
- Which Assets Justify the Investment First
- Readiness Checks and Decision Rights Before Go-Live
- A Boiler Feed Pump Bearing Caught 300 Hours Early
- Start a Free Reliability Assessment of Your Critical Assets
Where AI Fits Beside Condition Monitoring
Think of a plant clinician. Condition monitoring is one gauge reading taken at one moment. AI driven predictive maintenance is the model that reads the whole chart, compares today's trace against the same asset's history at the same load, and estimates both how likely a failure is and how much time is left to plan around it.
The vocabulary matters before any comparison. A failure mode is the specific physical way a machine stops doing its job, such as outer-race bearing spalling, shaft misalignment, or a fouled heat exchanger. A baseline is the signature an asset produces when healthy, measured at defined loads and speeds. Lead time is the gap between the moment a fault becomes detectable and the moment it becomes a functional failure, and it is the only part of that gap a planner can spend.
The difference shows up on the plant floor, where a route technician's readings and the model's risk estimate sit side by side.

| Strategy | Action triggered by | Data used | Warning before failure |
|---|---|---|---|
| Reactive | Failure has already occurred | None | None, repair follows the breakdown |
| Time-based preventive | Calendar or run hours | Maintenance history | None; the interval may be too early or too late |
| Condition-based | Measured threshold crossed | Vibration, oil and temperature readings | Partial, catches degradation already in progress |
| Conventional predictive | Trend away from baseline | Vibration, oil, thermography, ultrasound | Weeks to months, depending on failure mode |
| AI-driven predictive | Model-estimated failure risk | Multi-source sensor, process and history data | Depends on failure mode, sensor coverage and data history |
Read the rows as a progression in what triggers work, not in sophistication for its own sake. A calendar interval protects the asset on average and over-serviced the healthy unit last month. A threshold catches damage once it is measurable against a fixed line that was set wide enough to avoid nuisance alarms.
Fixed thresholds answer one question, which is whether a reading crossed a line. They never answer the question a planner asks, which is how many weeks are left.
A centrifugal cooling-loop pump shows the gap. Set overall velocity to alarm at 4.5 mm/s and a developing outer-race defect may sit undetected for weeks, because the fault raises energy at the ball-pass frequency and its harmonics while the broadband number barely moves. A model trained on that pump's own history flags the spectral shift at 2 mm/s, because the pattern no longer matches what the pump does at that flow and speed.
The economics are documented. The U.S. Department of Energy's Operations & Maintenance Best Practices Guide reports that a properly functioning predictive-maintenance program typically delivers 8%–12% savings compared with preventive maintenance alone, and summarizes industrial survey results showing a 35%–45% reduction in downtime and a 25%–30% reduction in maintenance costs after implementation, as reviewed in NIST MEP's assessment of AI in U.S. manufacturing. The guide also notes savings can exceed 30%–40% where a facility still leans heavily on reactive repair, which is the honest way to read all of it. Those ranges describe programs, not purchases.
Where sensor coverage is being designed rather than inherited, Faberwork's analysis of simulation and IoT for mitigating risk as systems grow is a useful reference for choosing measurement points before hardware is ordered. Plants with structured routes already have the harder half in place, since a condition monitoring system supplies the baselines any model needs to learn from.
The takeaway holds across asset types. AI extends condition monitoring rather than replacing it, and it earns its place on assets where fixed thresholds keep missing developing faults.
How Models Turn Sensor Data into Failure Risk
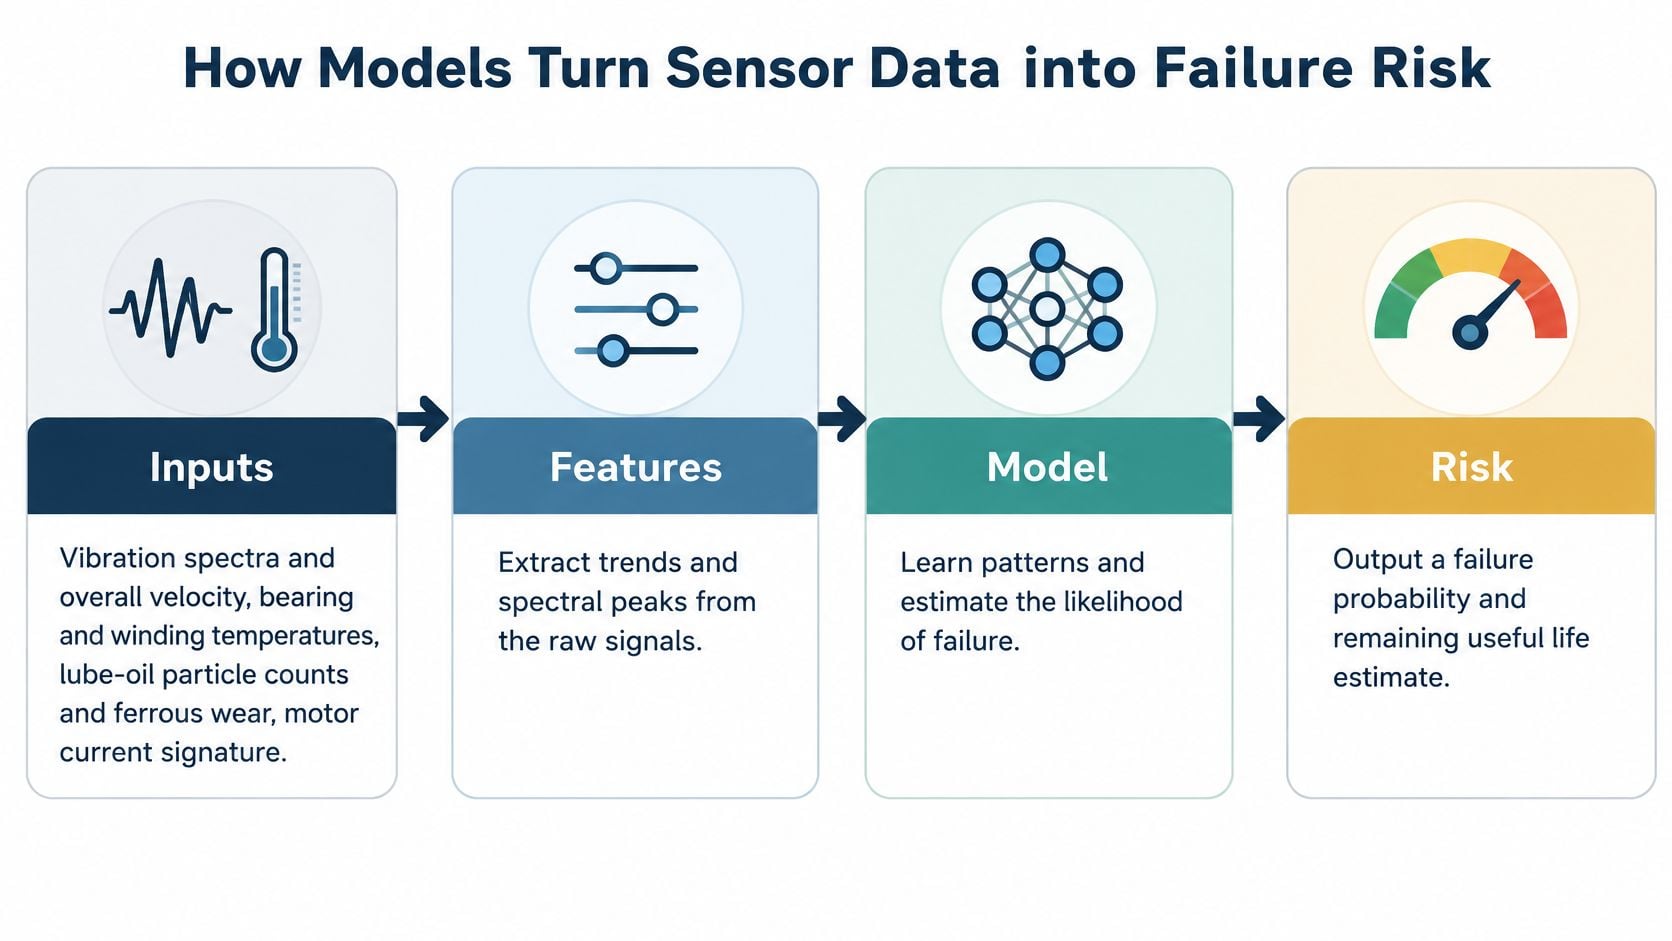
A model never sees a pump. It sees numbers, and the quality of those numbers sets the ceiling on everything downstream. The pipeline from a sensor bolted to a bearing housing to a work order a planner can schedule runs in four stages.
From Raw Signals to Features
Stage one is inputs, and predictive maintenance draws them from vibration, oil analysis, thermography, and ultrasound in both route-based and continuous programs. A credible model wants the full spread:
- Vibration, meaning overall velocity plus the spectrum, with envelope demodulation for bearing and gearmesh defects that hide in the high-frequency bands.
- Temperature at bearing housings and motor windings, read as a trend against load rather than a single absolute number.
- Oil, including particle counts, ISO cleanliness codes, and ferrous wear in parts per million from rotating bomb or ICP analysis.
- Electrical data from motor current signature analysis, where sidebands around line frequency expose rotor bar and eccentricity faults.
- Process values such as discharge pressure, flow, and differential pressure across filters and heat exchangers.
- History from work orders that name the failure mode and the repair, not the generic code "mechanical failure".
Stage two is baselining, and it is where most programs succeed or fail. The model learns each asset's normal signature under its own operating regimes. A 6 mm/s reading at full load may be routine for one pump and alarming at idle for the same pump a minute after a cold start. Without load, speed, and product grade attached to each reading, the model can't tell a regime change from a fault.
Stage three extracts features: RMS trends, crest factor, spectral peak amplitudes, envelope band energies, and rate of change. Stage four estimates risk, and the classification method matters less than the match between method and data shape.
Choosing the Model That Matches the Failure Mode
A 2026 systematic mapping study of machine-learning classification in predictive maintenance, covering 166 peer-reviewed articles published from 2000 through 2024, counted Random Forest in 64 studies and Support Vector Machine in 55, with Convolutional Neural Networks in 28 and LSTM networks in 17. Fault diagnosis was the most frequently investigated application, which tracks with what plants buy: detection of bearing defects, motor faults, gearbox damage, and pump degradation before functional failure.
The split is practical. Tree-based models work well on engineered features pulled from vibration or process data, and they tolerate modest datasets. CNNs and LSTMs suit raw waveforms, spectrograms, and sequential sensor streams where the shape of the signal carries the information. Estimating how much running time remains, the remaining useful life calculation, is where classification turns into scheduling.
What the Alert Must Carry
A risk score alone is not an alert. A usable one carries four components: the predicted failure mode, a confidence statement, an estimated time-to-failure window, and an attribution showing which signals moved. Attribution is what turns a number into a diagnosis, for example rising vibration at the bearing defect frequency combined with higher motor load.
Practical rule: an alert that names a failure mode, a confidence level and a lead-time window can be planned. An alert that says "anomaly detected" cannot.
That distinction decides whether a planner books labor and parts this week or forwards the message to somebody else.
Why Accuracy Misleads on Rare Failures
Accuracy is the metric most model comparisons report and the least useful one on a plant floor, because failures are rare by design. A model can look excellent on paper while missing every event that stops production.
The AI4I 2020 benchmark makes the point with plain arithmetic. It holds 10,000 labeled industrial-machine records split across five failure modes, and the classes are severely uneven.
| Failure mode | Cases in 10,000 records | What to track |
|---|---|---|
| Tool-wear failure | 46 | Per-mode recall and lead time |
| Heat-dissipation failure | 115 | Per-mode recall and false alarms per hour |
| Power failure | 95 | Per-mode precision and lead time |
| Overstrain failure | 98 | Per-mode recall and precision |
| Random failure | 19 | Recall, since rare cases are easy to miss |
Add those classes and the argument makes itself. 373 failures in 10,000 records means a model that predicts "no failure" on every single record scores about 96% accuracy and catches nothing, as the AI4I 2020 benchmark analysis sets out. Any vendor quoting a single accuracy figure without the failure-mode breakdown is describing a model that may be doing exactly that.
The metrics a maintenance team needs are different ones. Recall is the share of real failures the model catches. Precision is the share of alerts that turn out to be real. F1 balances the two. False alarms per operating hour measures inspection burden, and lead time measures how much planning room each alert buys. None of them can be pooled across failure modes without hiding the one that matters most.
Cost is asymmetric, and the evaluation should be too. A missed motor bearing fault can cause production loss and secondary shaft damage, while a false alarm mostly consumes an inspection visit and a technician's morning. That asymmetry means the tolerable false-alarm rate depends on the asset, not on the model.
Say a model holds 80% recall on heat-dissipation failures with ten false alerts a week. That trade is worth taking on a critical compressor with no spare, and it's a waste of labor on a spare cooling fan in a redundant pair. Same model, different decision.
Two validation habits keep the numbers honest. Time-ordered splits stop future data leaking into training, so the model is scored only on readings older than the failure it predicts. Explainability methods such as SHAP tie an alert back to a mechanism, rising vibration with increasing motor load, rather than issuing an opaque label. Per-mode scores then feed the same logic used to set risk priority numbers in an FMEA, and commissioning should include a shadow period where predictions are checked against CMMS-confirmed failure events before anyone acts on them.
Which Assets Justify the Investment First
Rank your critical assets and instrument the top twenty first. Adoption is already spreading: in 2025, 44% of organizations had implemented or were piloting AI-powered maintenance solutions, based on the MaintainX survey of 1,320 maintenance professionals in the United States and Canada. Adoption alone buys nothing. The payoff comes from where the instrumentation budget lands.
Score candidates on four factors: consequence of failure, redundancy, failure frequency, and replacement cost. Consequence covers lost output, safety, environmental release, and secondary damage to coupled equipment. Redundancy asks whether a standby unit carries the load. Frequency and cost come straight out of the work-order history, which is why a CMMS with named failure modes is worth more than a faster model.
| Tier | Consequence profile | Recommended approach |
|---|---|---|
| Tier 1 | Critical rotating equipment with no spare or high secondary-damage risk | AI-driven predictive monitoring with condition-based intervals |
| Tier 2 | Important assets with partial redundancy | Condition monitoring routes, with AI added if repeat failures occur |
| Tier 3 | Simpler equipment with well-characterised wear curves | Preventive intervals, such as motor brushes and packing seals |
| Tier 4 | Low-consequence spares with fast, cheap repair | Run to failure with planned spares |
The practical outcome is a mixed program. Put predictive work on critical rotating equipment and keep preventive intervals on simpler assets. Preventive maintenance still earns its place on items with well-characterised wear curves, such as motor brushes and packing seals, and on equipment where condition monitoring is not practical. Cheap, predictable repairs do not need a model.
The decision rule that follows is short.
- Score at least 20 critical assets on consequence and on failure history from the last three years.
- Put AI-driven monitoring on Tier 1 assets that already generate repeat emergency work, since that is where the savings arrive first.
- Hold Tier 3 on preventive intervals and revisit only if the failure record changes.
- Let Tier 4 run to failure with spares stocked, because monitoring costs more than the repair.
Payback logic follows the emergency work. Say a Tier 1 boiler feed pump suffers six emergency repairs a year, each costing two days of lost output plus a secondary mechanical seal replacement. That annual figure is the number the program has to beat. Predictive maintenance programs typically return 3 to 5 times the investment, and the pump's own emergency record usually dwarfs the sensor and analytics spend. Published benchmarks are only a starting reference; replace them with the plant's own repair, downtime and labor costs before approving spend. Tying that ranking to the maintenance budget is the same exercise as resource allocation optimization across the wider reliability plan.
Readiness Checks and Decision Rights Before Go-Live
Deployments rarely fail because the wrong algorithm was chosen. They fail on sensor fidelity, incomplete asset coverage, missing signals, imbalanced failure records, changing operating regimes, and weak integration with the CMMS or historian. A 2025 literature review of predictive-maintenance barriers lists poor data quality, data scarcity, limited real-time processing and class imbalance as persistent obstacles, and notes that many models stay specific to one machine or one industry rather than generalizing across sites.
That reframes the purchase question. Before buying or building anything, a plant needs to prove its data is fit for prediction, asset by asset.
| Check | Ready when | Red flag |
|---|---|---|
| Failure-mode coverage | Each critical failure mode has labelled history | Failures logged as general breakdown |
| Sensor placement and sampling | Sensors at bearing housings, sampling matched to defect frequencies | One sensor serving several assets |
| Time synchronisation | Sensor, historian and CMMS clocks agree | Timestamps differ by minutes or hours |
| Alarm labelling | Every alert closed out with an inspection result | Alerts never reviewed or closed |
| Operating-context tags | Load, speed and product grade logged with each reading | Model cannot separate load changes from faults |
| Decision rights | Named owner for deferral and for shutdown approval | Technicians ignore alerts with no review path |
Who Owns the Alert
The governance question is the one most projects skip. Name the person who may defer an alert, and the person who approves moving from inspection to shutdown. Those are usually two different roles, and the threshold between them should be written down before the first alert arrives.
Technicians also need the evidence, not just the verdict. Show the spectral peaks at the bearing defect frequency, the thermal trend against load, the oil iron reading climbing across three samples. A recommendation that arrives as a colored box trains people to close the box.
An accurate model that a shift supervisor doesn't trust is worth less than a monthly route the team actually walks.
Fallback is part of the design. When connectivity drops or the model is unavailable, scheduled route-based vibration and oil sampling continue unchanged, so the plant never depends on a data path it can't restore quickly. This is also where the work-order system earns its keep, since CMMS asset management with clean failure coding is what makes the next model trainable.
Security and Model Control
Treat OT security as an engineering constraint, not an IT afterthought. Segmented control networks, least-privilege access for anyone pulling sensor data, agreed patch windows that respect production, edge processing where bandwidth is tight, and version control on every deployed model so an alert can be traced to the logic that produced it.
Start in advisory mode with humans owning every shutdown decision, and stay there until the per-mode numbers justify more. A smaller, well-instrumented fleet of 10 to 20 critical pumps, motors or compressors usually produces more dependable decisions than broad deployment across assets nobody has governed.
A Boiler Feed Pump Bearing Caught 300 Hours Early
This is an illustrative composite built from typical pump failure patterns. A 450 kW induction motor drives a boiler feed pump at a chemical plant, and an unplanned trip on that pump costs a full day of production.
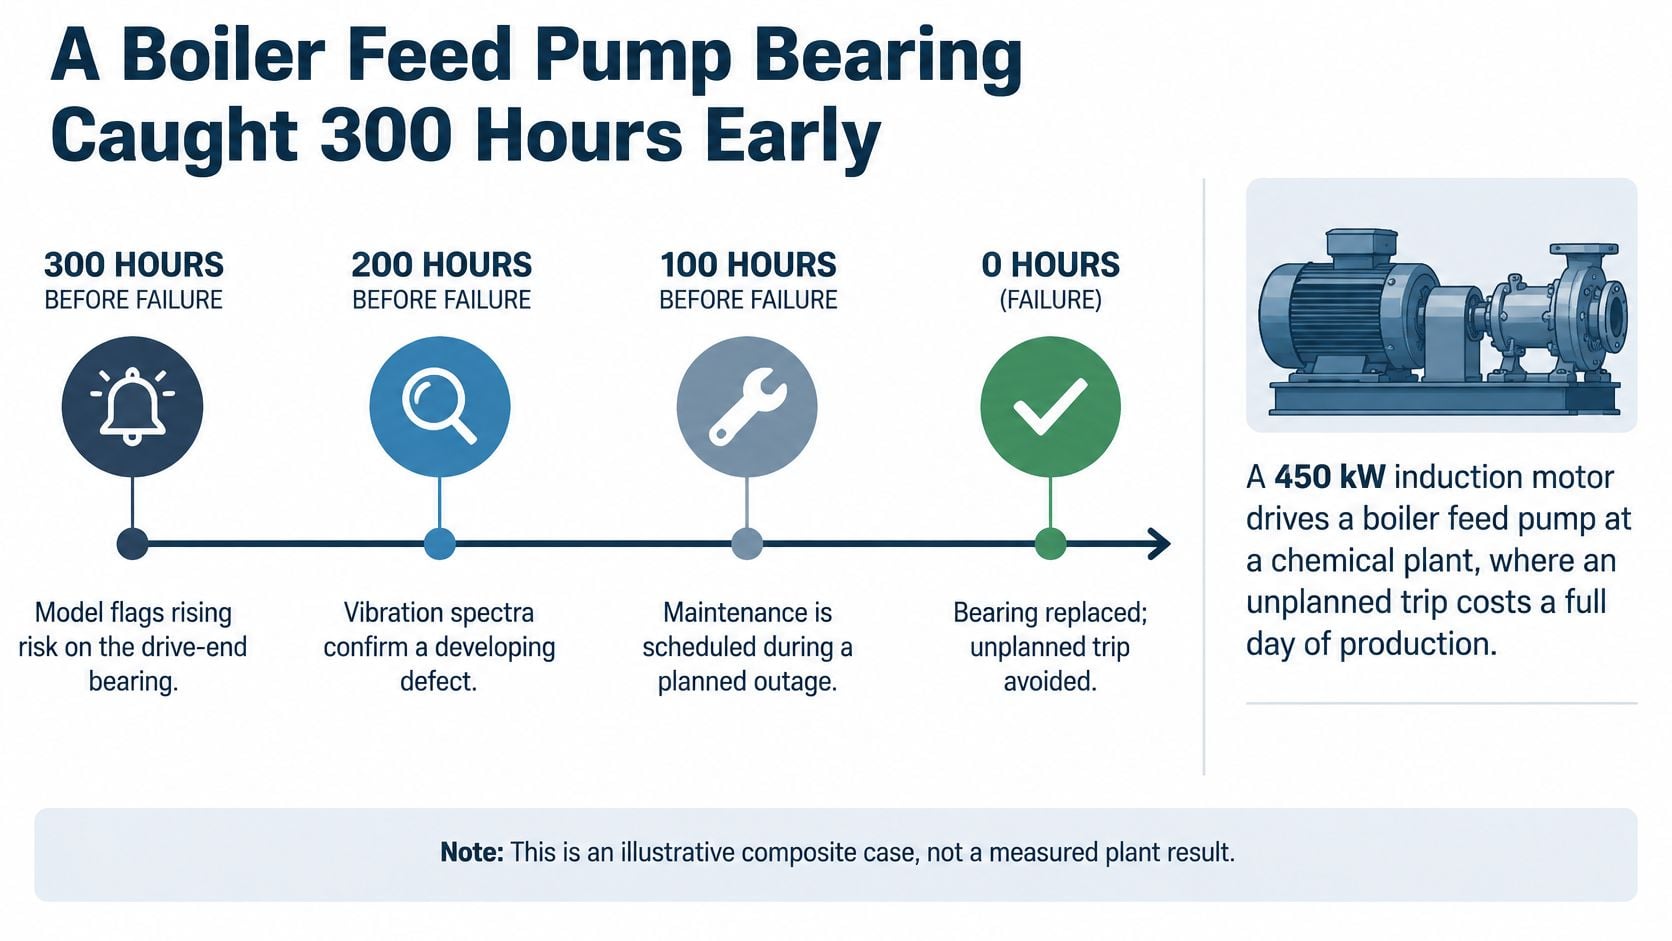
Week one, the model raises a rising bearing-defect signal on the outboard bearing while the pump runs at steady full load, with overall velocity moving from 2.1 to 3.4 mm/s. Week two adds two independent signals: motor current signature analysis shows sidebands pointing to a load-side issue, and oil analysis shows iron rising from 20 to 45 ppm. Week three, the model puts the failure window at about 300 hours, and thermography confirms the bearing housing running 8°C hotter than its sister pump.
The planner does the part software can't. With the failure mode named and the window wide enough to plan, the alert becomes a work order: replace the bearing and check alignment during an outage already on the schedule, with spares ordered ahead of the window rather than after the trip.
The model supplied a window. The planner supplied the date.
Predictive maintenance catches roughly 80% of mechanical failures with 200 to 1,500 hours of lead time, depending on the failure mode, which is the range this case sits inside. The repair took four hours against an emergency day, and the shaft and seal damage never happened.
The decisive inputs were ordinary data work: a named failure mode, labelled history behind that bearing defect, and confirmation across vibration, current, oil and heat before anyone committed parts or outage scope. The model also produced one false alert in the first month, a load-change artifact, which is why steady-state context and the second and third signals carried weight. AI earned its keep by turning scattered measurements into a dated decision, while the pump still had enough life left to make the repair cheap.
Start a Free Reliability Assessment of Your Critical Assets
The review that decides whether AI-driven monitoring pays off is the same one that stress-tests your data before anyone commits to a model. Bring a criticality-ranked asset list, work order history tagged by failure mode, and your current sensor and tag coverage. That material answers the two questions this decision keeps returning to: does the failure history support a model, and who holds the decision rights to act on what it flags.
Forge Reliability opens every engagement with a no-cost reliability assessment, delivered by plant-floor specialists with a 24-hour response. Use it to weigh AI-driven monitoring against conventional condition monitoring or a preventive interval for the assets that carry the most consequence.
Forge Reliability builds predictive maintenance and condition monitoring programs for plants that need alerts to become scheduled work rather than another dashboard. Visit Forge Reliability to book the no-cost assessment and bring the asset list you already have.