A maintenance manager sees this problem every week. A critical multistage centrifugal pump is nearing its overhaul date, production wants another month of runtime, and nobody wants to own the decision if the pump fails in service. Pull it early and the plant absorbs avoidable downtime. Leave it in place and the failure might damage the seal, shaft, bearings, or casing, then turn a manageable job into a forced outage.
That gap between calendar-based maintenance and real machine condition is where remaining useful life becomes valuable. It gives reliability teams a way to estimate how much service an asset likely has left based on condition evidence, operating context, and degradation behavior, instead of relying on age alone. For plant leaders, that changes the conversation from “Should maintenance happen now?” to “What risk is acceptable, and what does the condition data support?”
Table of Contents
- The High Cost of Guessing on Asset Health
- What Remaining Useful Life Is in Practice
- How RUL Is Calculated and Modeled
- The Sensor Data That Fuels RUL Predictions
- Dealing with Uncertainty in RUL Forecasts
- Integrating RUL into Your Maintenance Strategy
- A Practical Roadmap for RUL Implementation
The High Cost of Guessing on Asset Health
A paper mill, chemical unit, or food plant rarely loses sleep over small auxiliary assets. The stress starts when the asset is both fragile and essential. A main boiler feed pump, process air compressor, or induced draft fan can run smoothly for months, then force an outage at the worst possible time.
Consider a centrifugal pump that has reached its time-based overhaul interval. The vibration route doesn't show a severe alarm, but the trend is drifting upward on the outboard bearing. Oil condition is acceptable. Process demand is high, and operations wants to keep the unit online until the next planned window. That's not a technical puzzle alone. It's a business decision with production, maintenance, and risk tied together.
Reactive maintenance handles that situation badly because the team waits for failure. Preventive maintenance often handles it inefficiently because the team acts on the calendar whether the machine needs it or not. Neither approach answers the practical question: how much serviceable life is left under current operating conditions?
That's where remaining useful life earns its place. It turns observed machine condition into a maintenance timing decision. Instead of asking whether an asset is old, the plant asks whether degradation is advancing toward a functional limit fast enough to justify intervention.
Practical rule: If the team can't explain why an overhaul date exists beyond “that's what the PM says,” the interval is already a candidate for RUL-based review.
On the plant floor, this reduces two expensive mistakes:
- Premature intervention: Bearings, seals, couplings, and motors get replaced before their condition supports the work.
- Late intervention: The team stretches runtime too far and loses the asset during production demand.
- Planning gaps: Spare parts, labor, and outage coordination stay reactive because nobody has a defendable forecast.
Plants trying to improve this decision quality usually start with better asset criticality, tighter condition monitoring, and a more disciplined link between findings and schedule changes. A broader maintenance cost review often exposes where fixed-interval work is creating unnecessary spend without reducing operational risk. That's the same issue addressed in this guide to maintenance cost reduction strategies.
What Remaining Useful Life Is in Practice
Remaining useful life is the estimated time, cycles, or output an asset has left before it can no longer perform its required function within an acceptable risk level. In practice, that estimate is tied to a specific failure mode, a measurable condition trend, and a clear intervention limit. If any one of those three is missing, the number may look precise but it will not hold up in a maintenance planning meeting.
That practical definition matters because plant teams do not maintain abstract assets. They maintain gearbox bearings, induced draft fan motors, kiln support rollers, pump seals, turbine blades, and truck tires, each with different failure paths and different business consequences when the forecast is wrong.
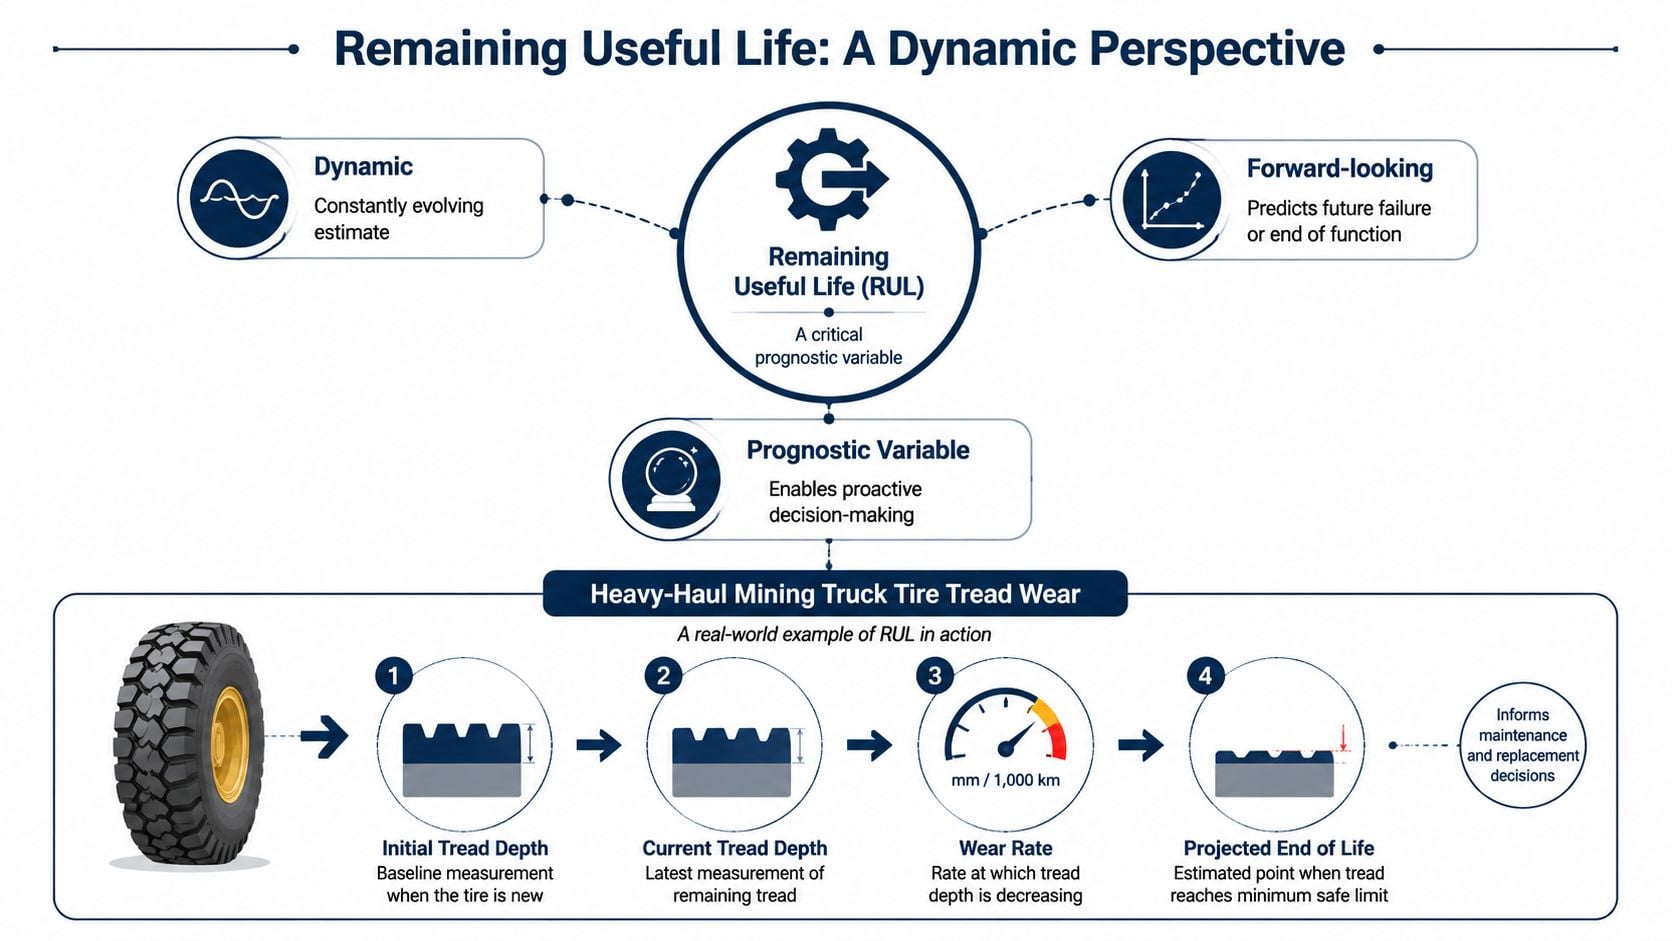
A heavy-haul mining truck tire shows the concept clearly. The current tread depth gives the present condition. The wear trend under actual haul road, loading, and heat conditions gives the degradation path. The minimum safe tread depth sets the limit. RUL is the forecast from today's measured state to that limit, with the understanding that the forecast can shift if the road worsens, loading changes, or the tire starts running hotter.
Why age is a weak planning signal
Age helps with inventory planning. It is a poor stand-alone indicator of remaining service life.
Two gearbox bearings installed on the same day can reach very different outcomes. One runs in clean oil, stays aligned, and sees steady load. The other runs with contamination, poor lubrication, and repeated shock loading from process upsets. Their calendar age matches. Their actual condition does not.
That is why experienced reliability teams treat RUL as a decision variable, not just a technical term. The point is not to produce a neat estimate for a dashboard. The point is to decide whether a conveyor gearbox can safely run to the next shutdown, whether a boiler feed pump needs an earlier outage slot, or whether a spare motor should be staged now instead of after the defect accelerates. Teams using predictive maintenance machine learning methods tied to asset failure behavior usually get more value when the model output is connected directly to those decisions.
Prognostics and health management (PHM) is the discipline behind that work. It combines condition monitoring, degradation assessment, and failure forecasting. Condition indicators are the measured signals used in the forecast, such as bearing defect energy, oil debris concentration, winding insulation test results, temperature rise, or crack depth from inspection.
A practical gearbox example
Consider a process conveyor gearbox with a rolling element bearing that has started to pit. Vibration data shows a growing defect frequency. Oil samples show rising metallic debris. Housing temperature is still within alarm limits, so operations sees a machine that is running. Reliability sees a bearing moving along a known damage path.
RUL for that gearbox is not the gearbox's age and it is not a generic statement like "replace soon." It is an estimate built from the present condition, the current rate of deterioration, and the threshold where the plant no longer accepts the risk of continued operation.
| Element | What the team looks at | Example on a gearbox |
|---|---|---|
| Current condition | Present health state | Bearing fault energy and debris level |
| Degradation path | How quickly damage is progressing | Trend rate under current load and lubrication |
| Failure threshold | The point where function or risk becomes unacceptable | Vibration, temperature, or inspection criteria tied to action |
The trade-off is always practical. If the estimate says the bearing may last long enough to reach the planned outage, the team can avoid an unnecessary stop. If the estimate carries wide uncertainty and the gearbox feeds a bottleneck line, the team may still intervene early because the cost of being wrong is too high. That is what RUL looks like in practice. A forecast under uncertainty, translated into a maintenance decision the plant can defend.
The best RUL programs also express the estimate in operating terms the business can schedule against. A haul truck tire may be tracked in miles. A gas turbine hot section may be tracked in starts and fired hours. A conveyor gearbox bearing is usually tracked in operating hours to the next safe intervention window.
How RUL Is Calculated and Modeled
There isn't one universal remaining useful life model. Plants use different methods because assets fail in different ways, and the available data varies widely from one site to another. A fatigue crack in a structural support, a compressor bearing defect, and a fouling-driven process decline in a heat exchanger don't lend themselves to the same modeling approach.
For practical work, it helps to separate the methods into model families, then judge each one by what it demands from the plant.
Three model families on the plant floor
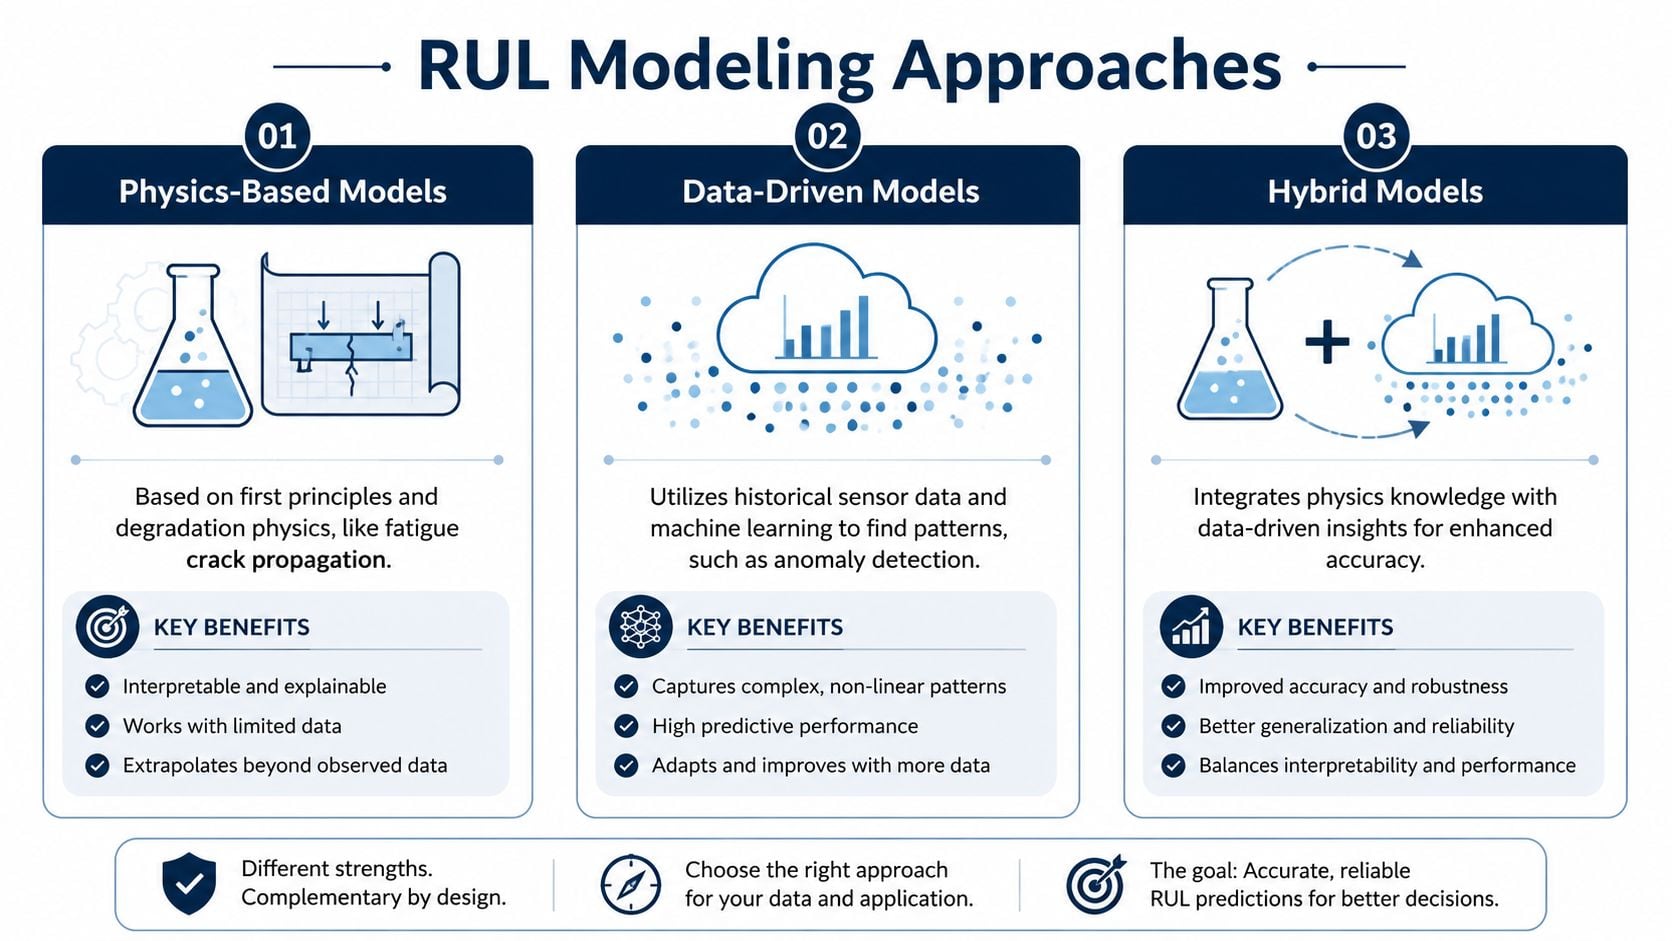
Physics-based models start with known degradation mechanisms. If a component fails by fatigue crack growth, corrosion loss, or wear, engineers can model the damage progression from first principles and inspection data. This is strongest when the failure mode is well understood and the operating stresses are known well enough to support the model.
A common use case is a crack growing in a steel component or pressure-containing part. The team measures crack size, estimates loading, and projects growth to a defined limit. The advantage is interpretability. The drawback is that these models demand good engineering knowledge of the failure mechanism and operating conditions.
Statistical models rely on historical failure information. These include lifetime-data approaches and proportional hazards style thinking, where failure history from similar machines supports an estimate of likely life under comparable service. These methods work well when a plant or enterprise has a fleet of similar pumps, motors, or compressors with consistent asset history.
Machine learning models use multivariate sensor data to learn degradation patterns from many variables at once. They are especially useful when the relationship between condition signals and failure progression is nonlinear or difficult to specify manually. Research in the field has increasingly shifted toward multivariate sensor-driven machine learning for complex equipment, and a Scientific Reports study using the C-MAPSS turbofan benchmark reported that an enhanced multiscale deep-learning model outperformed other methods on that shared dataset under complex operating conditions, as discussed in this C-MAPSS RUL modeling study.
What each approach does well
A plant manager usually doesn't need the math first. The better question is what each method needs to work.
- Physics-based approach: Best when the failure mode is specific and measurable. Crack growth, wear depth, and known material degradation fit here.
- Statistical approach: Best when the organization has clean failure history across similar assets. Fleet behavior matters more than deep sensor coverage.
- Machine learning approach: Best when the plant has multiple sensor streams and enough quality data to identify patterns that aren't obvious from a single indicator.
- Hybrid approach: Often the most practical in industry because it combines engineering knowledge with live condition data.
A second useful lens is the technical approach used to estimate the forecast. The most widely used approaches are lifetime data, run-to-failure similarity models, and threshold-based degradation models, each converting machine history or sensor-derived indicators into an intervention window rather than a generic alarm, as summarized in this overview of remaining useful life modeling methods.
A sophisticated model won't rescue weak data. A simple trend on the right failure mode often beats a complex model fed with noisy, inconsistent measurements.
On a compressor train, that trade-off shows up quickly. If the site has years of failure history but weak online sensing, a statistical method may provide more value than a machine learning model. If the train has vibration, temperature, oil, and process sensors with stable sampling, a data-driven model may capture degradation earlier.
Many teams overcomplicate this stage. They jump to advanced analytics before confirming three basics:
- The failure mode is understood.
- The condition indicator moves with damage.
- The threshold has operational meaning.
Plants evaluating more advanced analytics for this work should understand how sensor quality, labeling, and failure history affect outcomes. That issue sits at the center of predictive maintenance machine learning in real industrial settings.
The Sensor Data That Fuels RUL Predictions
RUL models don't run on theory alone. They run on signals from actual machines. If the data doesn't reflect the degradation mode, the forecast won't help much. That's why the most effective implementations start by matching the sensing method to the failure mechanism on the asset.
Matching sensors to failure modes
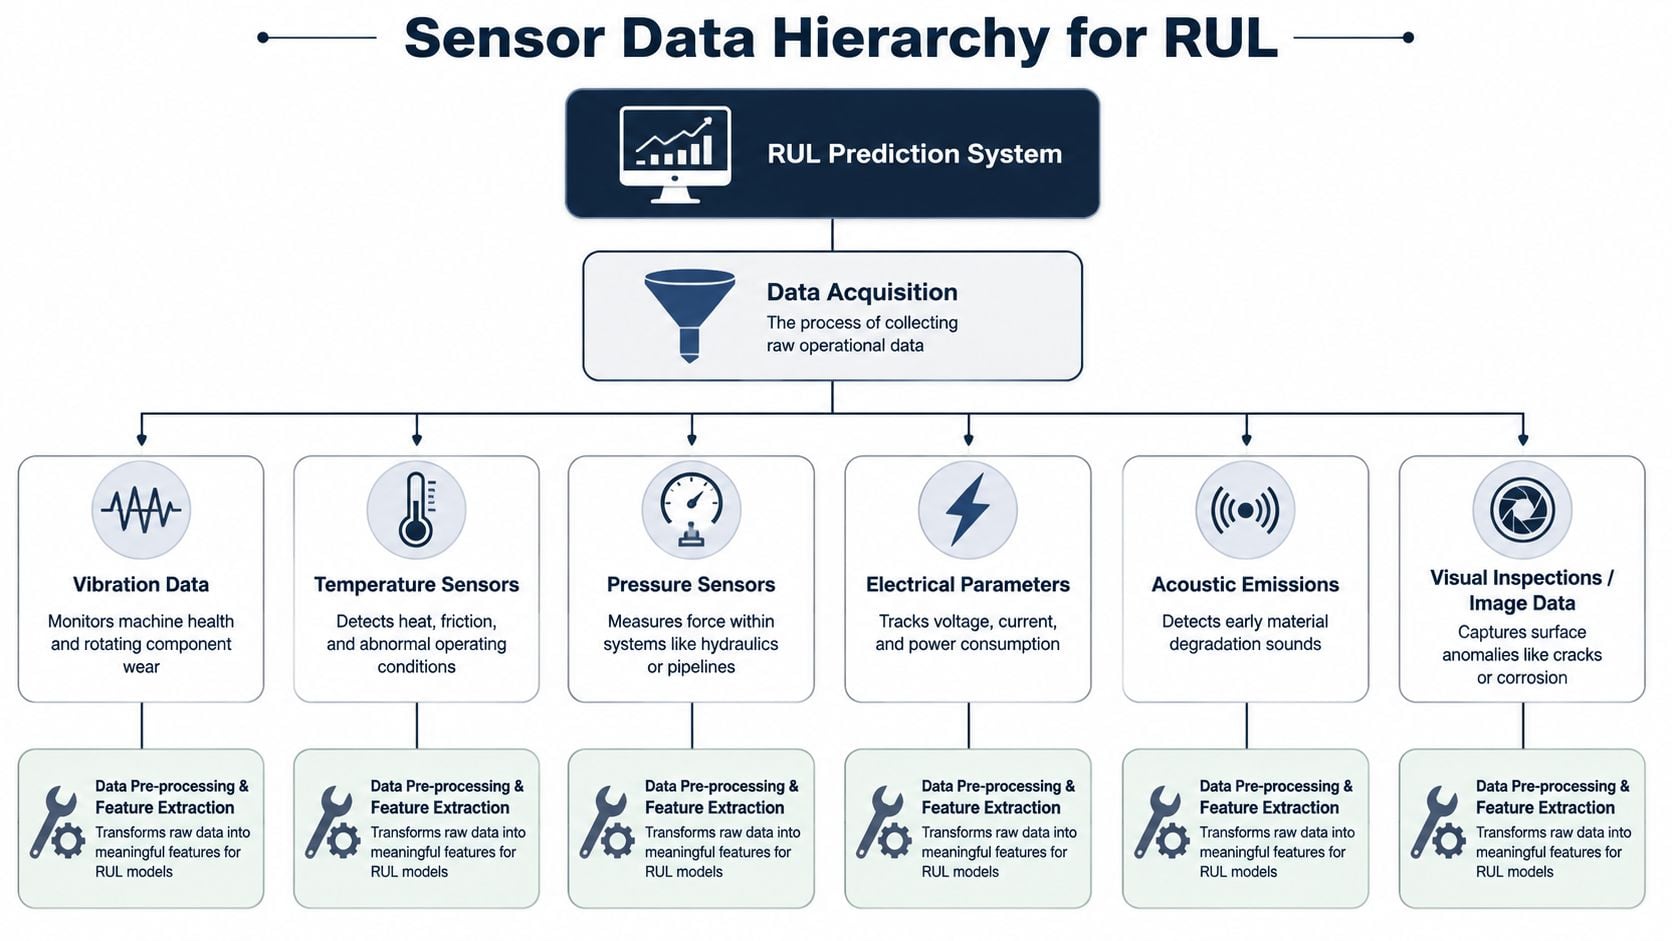
For rotating equipment, a few technologies carry most of the workload.
- Vibration analysis: Best for imbalance, misalignment, looseness, bearing defects, gear mesh problems, and resonance issues. On a paper machine roll bearing or a cooling water pump motor, vibration often provides the earliest usable trend for mechanical degradation.
- Oil analysis: Best for lubrication condition, contamination, additive depletion, and wear debris. Large gearboxes, hydraulic systems, and sleeve bearing systems benefit when oil data is tied to wear progression rather than used as a standalone report.
- Infrared thermography: Best for identifying thermal anomalies from electrical resistance, friction, poor heat transfer, or refractory issues. It helps locate hot connections in motor control centers and abnormal surface temperatures on process equipment.
- Motor current signature analysis: Best for electrical and electromechanical issues in motors, including rotor and stator-related abnormalities that mechanical data alone may miss.
- Airborne ultrasound: Best for early rolling-element bearing distress, compressed air leaks, steam trap issues, and some lubrication condition checks.
A practical motor example ties these together. A driven motor on a process pump may show increasing vibration at bearing frequencies, while current signature remains stable. That points the team toward a mechanical fault rather than an electrical one. If the motor also runs hotter than normal and lubrication history is inconsistent, the RUL forecast becomes stronger because multiple indicators support the same story. Teams wanting a deeper look at defect detection in electric machines can use this guide to vibration analysis of motors.
Why raw data alone is not enough
Condition monitoring produces value when it becomes a usable condition indicator. A waveform, thermogram, oil sample, or current trace has to be cleaned, trended, and tied to a threshold. Otherwise, the plant just accumulates reports.
That's why plants usually build RUL around a few disciplined steps:
| Step | What happens | Plant-floor example |
|---|---|---|
| Acquire | Collect repeatable sensor data | Monthly route vibration on a critical pump set |
| Process | Extract useful features | Bearing energy, temperature trend, debris level |
| Compare | Relate data to history or thresholds | Match current trend to similar failed gearboxes |
| Forecast | Estimate time to functional limit | Plan repair during next outage window |
The broader digital point matters too. RUL becomes easier to sustain when the plant has connected data flows between sensors, maintenance records, and operational context. For teams building that broader foundation, the Wonderment Apps guide to business growth gives a useful high-level view of how IoT and analytics support operational decision-making beyond simple data collection.
Plants don't need every sensor on every asset. They need the right sensor on the assets where the failure consequence justifies the effort.
A compressor fleet is a good example. One site may use route vibration and oil analysis on all units, then add continuous monitoring only on the lead machine where process interruption risk is highest. Another site may focus on online temperature, pressure, and current data for motors, then reserve deeper diagnostics for exceptions. The right architecture depends on consequence, detectability, and how quickly the failure mode develops.
Dealing with Uncertainty in RUL Forecasts
The most common mistake with remaining useful life is treating it like a precise countdown clock. Plant teams naturally want a clean answer. They want to hear that a compressor bearing has a specific number of hours left and schedule the repair around that number.
Real assets don't behave that neatly. Load changes, environment shifts, lubrication quality varies, sensors drift, and degradation rates accelerate or flatten. The forecast is always an estimate, not a promise.
Why a single number can mislead
A useful RUL output should include uncertainty. The hard part isn't generating a point estimate. The hard part is deciding whether the uncertainty around that estimate is acceptable for the asset and operating mode.
This is the operational gap most public discussion skips. The practical question is not only how long until failure. It's what confidence is sufficient to schedule a shutdown, order long-lead spares, or defer intervention. That issue is directly highlighted in this discussion of uncertainty in remaining useful life estimation, which notes that confidence-bounded predictions matter because point estimates alone aren't enough for real maintenance planning.
Three sources usually drive uncertainty on the plant floor:
- Measurement uncertainty: Sensors may be poorly mounted, inconsistently sampled, or affected by process noise.
- Model uncertainty: The chosen model may not reflect the actual failure mechanism well.
- Operational uncertainty: Future load, speed, starts and stops, contamination events, and operator behavior may differ from past conditions.
A wide uncertainty band doesn't automatically make the forecast useless. It just changes how the team should use it.
A practical decision framework
A non-critical standby pump can tolerate a broader forecast range because the consequence of being wrong is limited. A primary air compressor feeding the whole plant cannot. On high-consequence assets, maintenance leaders should judge RUL by decision quality, not by elegance.
A practical review usually asks:
- What happens if the asset fails early? Production loss, safety exposure, collateral damage, or environmental impact.
- What happens if maintenance happens too early? Lost production opportunity, wasted component life, and unnecessary labor.
- How wide is the uncertainty band relative to the planning window? If the forecast range overlaps the next outage, action may be justified even if the point estimate looks comfortable.
- What new evidence could tighten the decision? Higher frequency data, inspection, borescope review, lubrication check, or operating constraint changes.
The best RUL forecast is the one that supports a defensible action. If it can't support a decision, the plant still has an analytics output, not a maintenance strategy.
For many organizations, this connects naturally with reliability metrics already in use. Failure history, criticality, and runtime patterns still matter. They just shouldn't be mistaken for a substitute for forward-looking condition evidence. Used properly, RUL sharpens those legacy measures instead of replacing them. Teams that still rely heavily on historical averages should revisit how those metrics differ from condition-based forecasting, especially when working from mean time between failure calculations.
Integrating RUL into Your Maintenance Strategy
A remaining useful life estimate has no value sitting in a dashboard. It creates value when it changes a work order date, a parts purchase, an outage plan, or a repair versus replace decision. The plants that benefit most are the ones that tie RUL directly into existing maintenance workflows instead of treating it as a separate analytics exercise.
Where RUL changes daily work
The first place RUL changes behavior is preventive maintenance optimization. A time-based interval that once triggered every shutdown can be extended, shortened, or replaced with a condition-based trigger when the asset's degradation trend justifies it. That reduces routine work that doesn't lower failure risk.
It also improves reliability-centered maintenance decisions. If a pump bearing repeatedly degrades faster than expected under one service condition, the team has evidence that the failure pattern is not random. That opens better questions about lubrication, alignment, NPSH-related vibration, operating point, or installation quality.
RUL also improves parts and capital planning in ways that operations can understand:
- Spare parts timing: Long-lead bearings, seals, or couplings can be ordered when the forecast enters a defined action zone.
- Outage coordination: Work can be aligned with an upcoming production stop instead of triggering a separate event.
- Repair versus replace decisions: If several condition indicators show end-of-life behavior across an asset family, planners can make a stronger case for replacement.
- Labor loading: Supervisors can prepare craft hours in advance instead of scrambling after a failure.
A refrigeration compressor example
A food and beverage plant offers a good example because refrigeration assets often have high production consequence and tight operating windows. Suppose the main refrigeration compressor motor bearings begin trending upward in vibration. The trend is not yet severe enough to force an immediate outage, but the degradation is clear and stable enough to estimate an intervention window.
That estimate lets the plant do four things in sequence. It can reserve the holiday shutdown for the work, stage the replacement bearings and support parts before the outage, coordinate mechanical and electrical labor, and avoid the risk of losing refrigeration during peak production. None of that requires a perfect prediction. It requires a credible forecast tied to planning thresholds.
Maintenance execution matters. Plants get the most from RUL when planning, scheduling, asset history, and condition monitoring all feed the same operating routine. Without that integration, the forecast remains interesting but underused. The day-to-day discipline involved is the same kind of discipline required for stronger operation and maintenance practices.
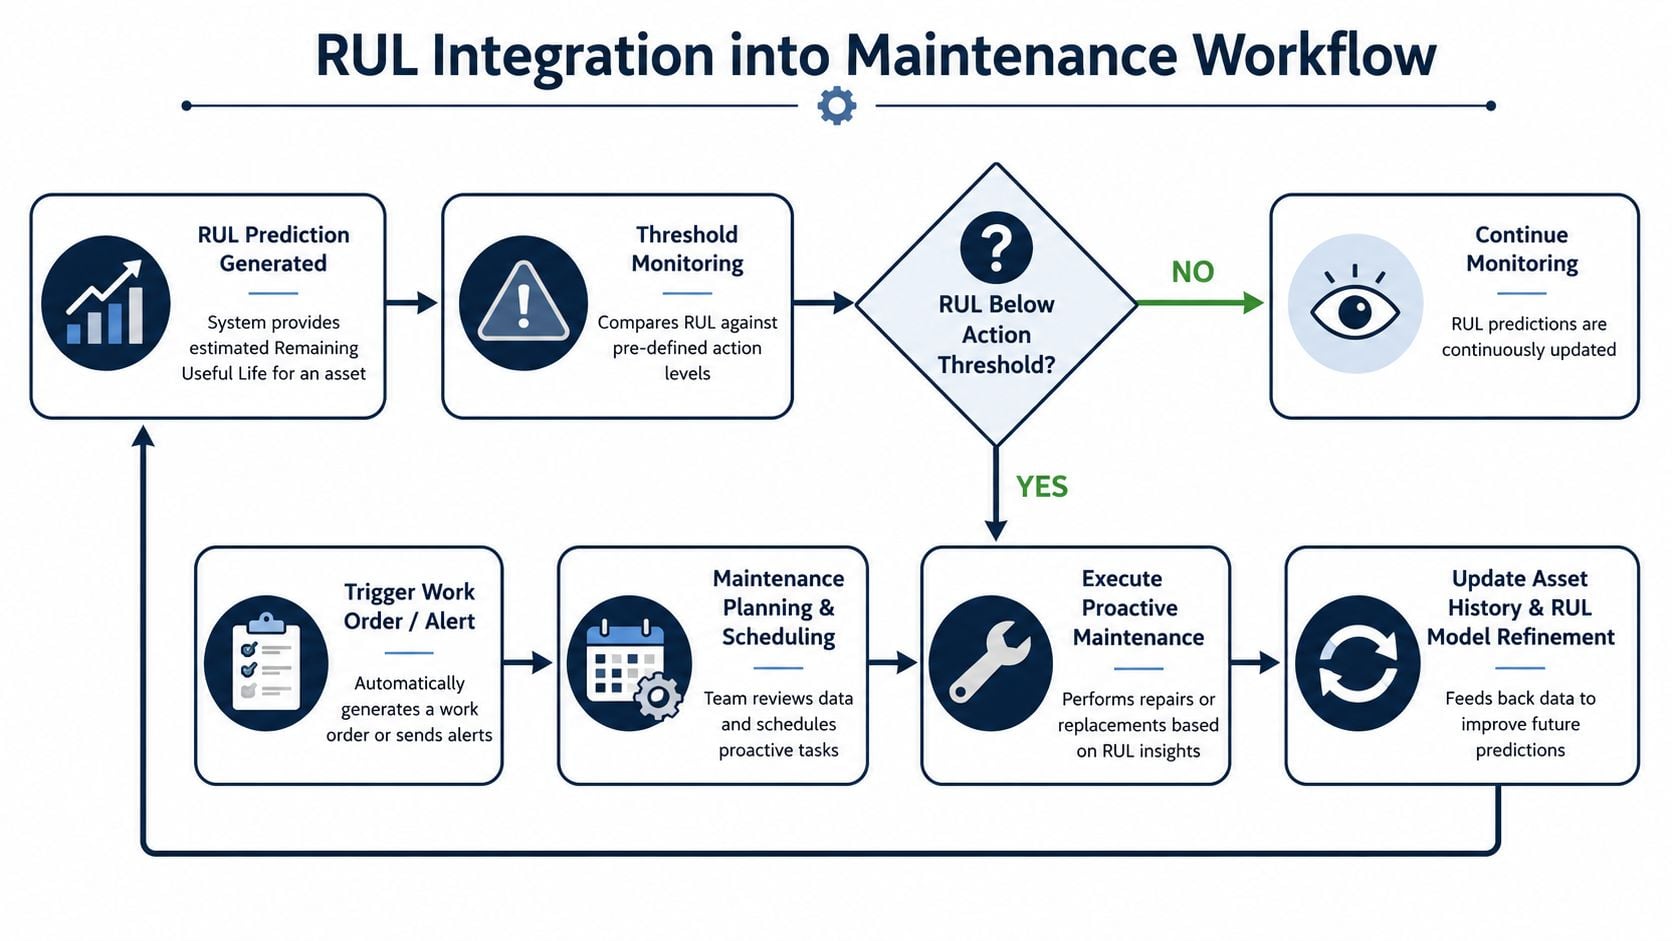
A mature workflow usually follows a simple loop:
| Trigger | Maintenance response | Business effect |
|---|---|---|
| Stable forecast with adequate margin | Continue monitoring | Avoid unnecessary maintenance |
| Forecast enters planning zone | Order parts and reserve labor | Reduce schedule pressure |
| Forecast enters action zone | Schedule outage work | Prevent forced failure |
| Post-repair condition reset | Update history and model | Improve future decisions |
A Practical Roadmap for RUL Implementation
A plant usually does not fail at RUL because the math is weak. It fails because the first rollout tries to cover every critical asset at once, mixes different failure modes into one dashboard, and gives planners a forecast they cannot act on. The better path is narrower and more operational. Start where the consequences are high, the degradation is observable, and the maintenance decision is still hard enough to benefit from a forecast.
Pick assets that create real tension between running longer and intervening early. A main air compressor with recurring bearing defects is a good candidate. So is a refrigeration compressor that can force product loss if it trips, or a process pump that repeatedly triggers arguments between operations and maintenance about whether it can make the next planned outage. Those are the situations where RUL earns its keep. It gives the team a decision window instead of another condition report.
Start with assets and decisions, not models
A practical rollout usually works best in phases:
- Select a small group of critical assets. Focus on machines with high downtime cost, repeat failures, or enough condition history to support a forecast. Main process pumps, large motors, refrigeration compressors, forced draft fans, and plant air compressors are common starting points.
- Define the failure mode clearly. Build the workflow around something specific such as outer-race bearing damage, lubrication failure, rotor imbalance, gear wear, or motor insulation deterioration. If the team cannot name the degradation mechanism, it is too early to talk about RUL.
- Set up repeatable data collection. Use the same sensor location, collection interval, operating state, and tagging structure every time. A simple, clean vibration route on a pump train will outperform a messy data stream from ten sensors mounted inconsistently.
- Choose a decision threshold and planning threshold. One threshold should trigger preparation, such as ordering bearings or reserving a millwright. Another should trigger the work order itself. This is how a probabilistic forecast becomes a maintenance plan.
- Compare forecasts with field findings. Teardown results, inspection notes, and post-repair condition data should go back into the review loop. That is how forecast quality improves and how the team learns where uncertainty is acceptable and where it is not.
The trade-off is straightforward. Starting with a simpler method gets the plant into use faster, but only if the team defines what action the forecast is supposed to support.
Build the workflow around uncertainty
An RUL estimate is rarely a single date that everyone should trust blindly. For a critical motor bearing, the useful output may be a window. For example, the current trend may support continued operation through the next two production runs but not through the monthly shutdown after that. That is enough to trigger parts staging, labor coordination, and contingency planning.
This is the part many plants skip. They spend time on prediction and very little time on decision rules. A maintenance leader should decide in advance what happens if the forecast range widens, if the confidence drops after a load change, or if operations asks for one more week of runtime. Without those rules, uncertainty pushes the plant back to calendar maintenance or late reactive work.
Common mistakes that stall progress
The same problems show up repeatedly on plant sites:
- Poor sensor installation or collection discipline. Bad mounting, changing routes, and measurements taken under different loads create trends no one can trust.
- Reports without action limits. Analysts may issue useful condition summaries, but planners still need explicit planning and action thresholds tied to the asset.
- A model that does not match the failure mechanism. A fleet-level statistical approach will not help much when one induced draft fan is failing because of local contamination or chronic misalignment.
- No owner for the final decision. If reliability, maintenance, and operations do not agree on who acts on the forecast, the work sits in review meetings until the asset forces the decision itself.
Start small. Prove value on a handful of assets. Then expand only after the plant can show that forecasts changed maintenance timing, reduced forced outages, or improved outage preparation.
A focused assessment can identify where remaining useful life will improve decisions instead of adding more reports. Forge Reliability offers a free reliability assessment to help plants prioritize critical assets, review current condition monitoring coverage, and build a practical path toward risk-based maintenance planning.