A motor rarely fails without warning. The warning usually gets missed, misread, or pushed aside because production needs the line running for one more shift.
That pattern shows up in every plant. A packaging conveyor drive starts running rough on a Friday night. Operators hear a little extra noise, maintenance checks for heat, nothing looks severe, and the asset stays in service. By Monday, the motor bearing has degraded far enough to force an unplanned stop, and the damage extends beyond the motor. The line schedule slips, upstream product piles up, and the team gets dragged into reactive work that should've been planned.
Vibration analysis of motor changes that sequence. It gives maintenance and operations a way to see developing faults before they become shutdowns. More important, it gives the plant a basis for deciding what to do next: monitor, repair at the next window, or pull the asset immediately because the risk is no longer acceptable.
Table of Contents
- Why Motor Vibration Is Your Plant's Most Critical Health Signal
- Understanding the Language of Motor Vibration
- Your Guide to Sensors and Data Collection Strategy
- How to Identify Specific Faults in Your Vibration Data
- From Raw Data to Actionable Diagnosis
- Using Standards to Set Effective Vibration Alarms
- Turning Vibration Insights into Smart Maintenance Decisions
Why Motor Vibration Is Your Plant's Most Critical Health Signal
A motor is often the least appreciated critical asset in the building. It sits between power and process, and when it drops out, the whole system reminds everyone how important it was.
In a food processing plant, a single failed motor on a conveyor, mixer, or pump can stop far more than one machine. Product can back up, sanitation windows can shift, temperature-sensitive material can sit too long, and supervisors can end up making rushed restart decisions under pressure. That's why vibration should be treated as a health signal, not just a maintenance reading.

Why vibration gets attention before other symptoms
Temperature often rises late. Noise is subjective. Visual inspection is useful, but it usually catches damage after the fault has progressed.
Vibration moves earlier in the chain of evidence. As explained in electric motor maintenance testing and monitoring practices, the strongest programs don't wait for obvious failure symptoms. They track condition changes while the machine is still running and still repairable on a planned schedule.
For motors, that matters because many of the common failure modes start as motion problems. Unbalance, misalignment, looseness, and bearing defects all change how the machine vibrates before they force a shutdown. Once those patterns are trended, the team stops guessing and starts managing deterioration.
Practical rule: If a motor is critical enough to stop production, it's critical enough to trend.
Why this signal matters to operations leaders
Maintenance teams care about fault detection. Operations leaders care about whether the line runs. Vibration connects those two priorities.
A blower motor in a dust collection system is a good example. If vibration starts trending up and the team identifies unbalance early, the plant can clean, inspect, and correct it during a planned stop. If the warning is ignored, the same motor can degrade into bearing damage, loosen hardware, and create a much bigger repair scope.
That's the difference between predictive work and emergency work. Predictive work happens with parts staged, labor planned, and production informed. Emergency work happens with everyone reacting at once.
A mature vibration program gives the plant something more valuable than a diagnosis. It gives decision time. That is the advantage.
Understanding the Language of Motor Vibration
A motor trips a high vibration alarm on night shift. The spectrum shows a strong peak, maintenance sees a bearing change in the recent history, and the first instinct is to order another bearing. By morning, a phase check shows the true problem is misalignment from a rushed coupling install. The bearing was only reporting the stress.
That kind of mistake is common in plants that collect vibration data but do not read it in the right order. Good analysts start by asking three questions. How much motion is present? At what frequency? How is that motion behaving from one point to another? Those answers shape the repair plan and, just as important, help the team decide whether the motor can run to the weekend or needs attention before the next shift change.
What amplitude frequency and phase tell the team
The basic language of vibration analysis of motor starts with amplitude, frequency, and phase angle. If a team treats vibration as one overall number, it loses the detail needed to separate a nuisance alarm from a fault that can take down production.
- Amplitude shows how much the machine moves. Use it to judge severity and trend change over time.
- Frequency shows how often that motion repeats. Use it to connect the vibration to running speed, bearing frequencies, electrical forces, or structural resonance.
- Phase angle shows the timing of motion relative to shaft rotation or another measurement point. Use it to sort out faults that can look similar in the spectrum.
Each parameter answers a different maintenance question. Amplitude answers, "How bad is it?" Frequency answers, "What family of fault fits this pattern?" Phase answers, "Does the machine motion support that conclusion, or are we chasing the wrong fault?"
On a pump motor set, that sequence matters. A high overall reading may justify concern, but it does not justify a work order by itself. If the dominant energy sits at 1× running speed, unbalance moves up the list. If phase readings across the coupling show a pattern more consistent with angular or offset misalignment, the job changes. The team checks alignment, soft foot, and base condition before it sends the rotor for balancing.
That is where vibration becomes a decision tool instead of a reporting exercise.
A practical route helps. Teams that want cleaner comparisons from asset to asset should standardize points, directions, and operating states. A vibration monitoring route setup guide for repeatable motor data collection helps reduce the kind of variation that leads to false conclusions.
Vibration is a pattern tied to machine behavior. The repair gains credibility when the pattern, not a single number, supports the diagnosis.
Why displacement velocity and acceleration are not interchangeable
Analysts also need the right measurement family for the fault they are trying to catch. Displacement, velocity, and acceleration do not compete with each other. They answer different questions in different frequency ranges.
- Displacement is usually expressed in mils. It is useful for low-frequency motion such as unbalance, shaft movement, and journal-bearing behavior.
- Velocity is commonly expressed in inches per second or millimeters per second. It gives a practical broad view of machine condition and works well for routine severity trending.
- Acceleration is used for higher-frequency activity. It is often the first place early bearing damage, impacting, or friction-related events show up.
In the field, this affects priorities.
A large fan motor with buildup on the wheel usually shows the problem clearly in displacement and velocity because the fault energy stays close to running speed. A high-speed motor on a process pump may look acceptable in overall velocity while acceleration reveals early bearing distress. If that motor feeds a bottleneck line, the response should not be, "overall is fine." The better question is whether the fault type can stay stable until the next planned outage or whether it is likely to progress into heat, clearance loss, and collateral damage.
That trade-off is where newer analysts often struggle. They see low overall velocity and downgrade the alert. An experienced reliability engineer looks at the measurement type, the fault pattern, and the duty of the asset. Early bearing activity on a redundant motor may justify closer monitoring. The same pattern on a non-redundant induced draft fan may justify immediate inspection because the production risk is higher than the amplitude alone suggests.
A quick field reference
| Measurement family | Best fit in practice | Typical maintenance use |
|---|---|---|
| Displacement | Low-frequency motion | Unbalance, shaft movement, journal-bearing behavior |
| Velocity | Broad condition view | Overall machine severity and routine trending |
| Acceleration | High-frequency content | Early bearing fault detection and impact activity |
Teams that mix up these units either miss developing faults or overreact to harmless motion. Good analysis starts with using the right language, then tying that language to a maintenance decision the plant can defend.
Your Guide to Sensors and Data Collection Strategy
A motor trips on high vibration at 2 a.m. The route data from the last three months shows one radial point on the outboard end, one overall value, and no axial reading. Maintenance can see that vibration went up, but not whether the problem is misalignment, a soft foot condition, bearing damage, or a base issue. The result is familiar. The team either opens the motor without enough evidence or puts it back in service and accepts unnecessary risk.
Good sensor strategy prevents that situation. The point is not to collect more data for its own sake. The point is to collect the minimum set of repeatable measurements that lets the team decide whether to watch, plan, or intervene now.
Where to mount sensors on a motor
Motor vibration work depends on three basics: where the vibration is measured, which direction is measured, and whether the point can be repeated the same way next month. Analysts use amplitude, frequency, and phase to sort likely fault sources, but none of that helps if the sensor location misses the load path.
For route-based monitoring, start at both motor bearings and collect in three directions whenever access and safety allow:
- Horizontal radial shows many unbalance and structural responses.
- Vertical radial often exposes support stiffness, base problems, and looseness more clearly.
- Axial helps confirm coupling misalignment, thrust-related issues, and shaft movement that radial points can miss.
On a direct-coupled pump set, axial data often makes the difference between a planned alignment correction and a preventable seal failure. A motor can look acceptable in radial readings while axial vibration at one bearing is climbing every month. If that pump feeds a process header with no installed spare, the collection plan should reflect that production risk. Missing the axial point is not a data gap. It is a decision-making gap.
Sensor location also changes with the question being asked. If the plant is screening general condition on a low-risk utility motor, standard bearing housing points are usually enough. If the motor drives a critical compressor or induced draft fan, add the points that help separate motor-side and driven-side behavior, and make sure the route is consistent enough to support trending. A documented vibration monitoring route setup guide helps standardize locations, directions, and naming so analysts are comparing the same point every round.
How to choose waveform and spectrum settings that matter
Collection settings decide which faults can be seen early and which ones stay hidden until the machine is already in trouble.
Use each data type for a specific purpose:
- Time waveform shows impacts, modulation, and repeating events over time.
- FFT spectrum separates the signal into frequencies so running-speed, bearing, and electrical components can be examined.
- Phase data helps confirm whether machine parts are moving together, against each other, or in a pattern that fits the suspected fault.
Settings should match machine speed, construction, and failure risk. A low-speed cooling tower fan motor needs enough low-frequency resolution to judge running-speed behavior, looseness, and structural response. A high-speed motor on a process pump may need a setup that preserves higher-frequency content, because early bearing distress will appear there before overall values force attention.
Newer programs lose time when they apply one default setup to every motor in the plant. That approach is easy to administer, but it weakens diagnosis and creates avoidable work orders. A generic spectrum may be fine for broad screening. It is a poor choice when the team is trying to decide whether a critical motor can run to the next outage.
Field advice: Start with the failure mode you need to catch and the consequence of missing it. Then choose the sensor, mounting method, frequency range, and resolution that support that decision.
A practical collection checklist
- Mount close to the bearing housing. Long transmission paths smear the signal and hide fault detail.
- Use the same point every route. Small location changes can distort trends enough to trigger false alarms or hide real growth.
- Collect axial data on coupled machines. Many alignment and thrust problems show up there first.
- Review waveform and spectrum together. The spectrum shows where the energy sits. The waveform shows how it behaves.
- Match settings to the asset's risk. A standby utility motor and a production bottleneck motor should not get the same level of detail.
Plants do not need laboratory conditions. They need repeatable field data that supports a defensible maintenance decision. That standard is realistic, and it starts with choosing points and settings based on fault detectability, asset criticality, and what production stands to lose if the team gets the call wrong.
How to Identify Specific Faults in Your Vibration Data
A spectrum only becomes useful when the analyst can connect frequency behavior to physical failure modes. That is where vibration analysis of motor stops being interesting and starts being operationally valuable.
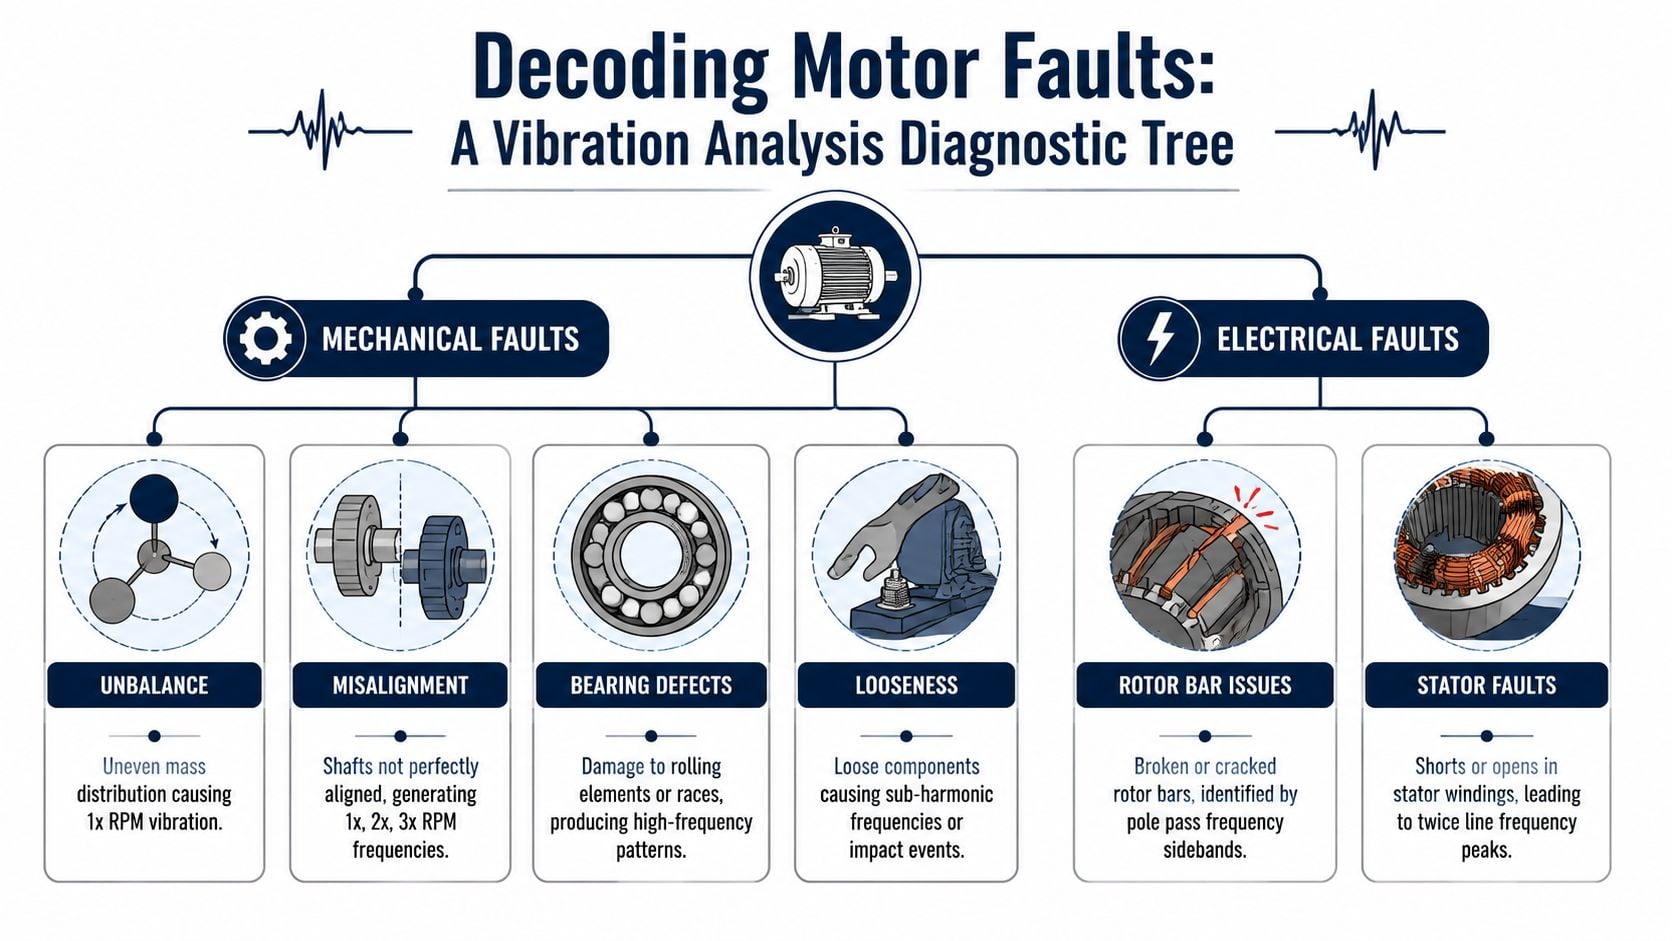
On the plant floor, most motor faults fall into a short list. Unbalance, misalignment, looseness, bearing damage, gear-related issues on driven systems, and electrical faults all leave different fingerprints. The key is learning which patterns deserve immediate action and which ones call for confirmation before the team tears into the machine.
What common motor fault patterns look like
A practical diagnostic rule is that 1× running-speed vibration usually indicates rotor unbalance or a shift in mass distribution, 2× running-speed vibration often points to misalignment, bent shaft, or mechanical looseness, and broadband noise growth across multiple frequencies is consistent with bearing wear or developing surface damage. For gear-driven motors, gear-mesh frequencies appear at tooth-count times shaft speed, and worn gears create sidebands around that mesh frequency. Bearing defects generate characteristic defect frequencies with high-frequency impacts modulated by shaft speed, as summarized in this vibration fault pattern reference.
That framework works well in real equipment.
A belt-driven blower motor with a dirty fan wheel often shows a dominant 1× pattern. A pump motor with coupling alignment drift may develop stronger axial response and increased 2× content. A motor bearing beginning to pit or spall often shows a rougher spectrum, rising high-frequency activity, and impact behavior in the waveform.
The mistake is assuming one peak tells the whole story. It doesn't. A strong 1× peak could be unbalance, but if the machine also has phase inconsistency, axial growth, or looseness indicators, the repair plan changes.
Common Motor Fault Signatures
| Fault Type | Primary Frequency Signature | Common Notes & Characteristics |
|---|---|---|
| Unbalance | Increased 1× running speed | Often tied to uneven mass distribution. Usually strongest in radial directions. Common on fans and blowers with buildup or damaged rotating elements. |
| Misalignment | Elevated 2× running speed, sometimes with axial response | Often appears in coupled motor-driven equipment such as pumps. A bent shaft can look similar, so confirmation matters. |
| Mechanical looseness | Elevated 2× running speed and related instability | May involve base issues, fit problems, or structural movement. Time waveform review is often important. |
| Bearing wear or surface damage | Broadband noise growth across multiple frequencies with high-frequency impacts | Early faults may show up better in acceleration and waveform data than in overall readings. |
| Gear wear in motor-driven systems | Gear-mesh frequency with sidebands | Common where the motor drives a gearbox. Sideband structure often grows as wear progresses. |
| Electrical faults | Frequency content tied to electrical excitation rather than simple running-speed behavior | These can be mistaken for mechanical faults if the analyst only looks at overall amplitude. |
A deeper bearing review often deserves dedicated analysis, especially when the fault is still in an early stage. Teams working through that problem typically benefit from a focused bearing fault detection resource for vibration analysis.
How to separate mechanical from electrical problems
Mechanical faults usually track physical rotation, load path, or structural support. Electrical faults often show frequency behavior tied to electromagnetic effects instead. That distinction matters because the corrective action is completely different.
An induction motor with a developing electrical issue may not need balancing or realignment at all. If the team mistakes electrical excitation for a mechanical fault, it can lose a shutdown window and still return the asset to service with the original risk intact.
When a pattern doesn't fit the physical construction of the machine, stop forcing the diagnosis. Recheck speed, line frequency relationships, and operating condition before issuing the recommendation.
A good analyst doesn't chase peaks. A good analyst matches the signal to the machine, the mounting, the operating state, and the failure mechanism that makes sense.
From Raw Data to Actionable Diagnosis
The best analysts follow a repeatable path. They don't jump straight from an alarm to a repair order, and they don't let software labels make the final call.
For motor work, the most actionable baseline metrics are acceleration, velocity RMS, and displacement RMS because each emphasizes a different fault band. Velocity RMS is commonly used as the main severity indicator in industrial monitoring because ISO 10816 defines vibration severity classes by velocity, while acceleration is more sensitive to high-frequency faults and displacement highlights low-frequency motion such as rotor unbalance, as explained in this motor vibration analysis reference.
A practical workflow for analyzing a motor alarm
A useful workflow looks like this:
- Check the overall trend first. If velocity RMS has shifted upward, confirm that the machine was operating under comparable load and speed.
- Open the FFT spectrum next. Identify the dominant peaks and note whether they align with running speed, harmonics, broadband growth, or gear-related content.
- Compare direction and location. A fault that appears only at one point may indicate a local issue. A pattern across both motor bearings may indicate a system problem.
- Review the time waveform. Impacts, modulation, or repeating strikes often confirm what the spectrum only suggests.
- Write the recommendation in maintenance language. "Inspect coupling alignment at next outage" is more useful than "2× observed."
A wastewater plant motor driving a sludge pump is a good example. If overall velocity begins climbing, the analyst shouldn't stop there. The next step is to see whether the spectrum points to 1× unbalance, 2× misalignment, or high-frequency bearing activity. The final recommendation changes the work scope, parts, and outage timing.
Where plants need extra diagnostic support, a service such as industrial vibration analysis support can help validate patterns before the team commits to a repair plan.
What good analysts confirm before writing a work order
Before maintenance touches the machine, several questions need answers:
- Was operating speed stable? Variable operating conditions can change the spectrum shape.
- Did the team collect the right unit? A bearing call made from low-frequency data alone is weak.
- Does the waveform support the diagnosis? This is especially important for impacts and looseness.
- Is the direction of vibration logical? Radial and axial behavior should fit the suspected fault.
- Has the trend moved gradually or abruptly? That affects urgency.
Decision point: The purpose of analysis isn't to name a fault. It's to recommend the right action at the right time with the least disruption to production.
That mindset is what separates diagnostics from useful reliability work.
Using Standards to Set Effective Vibration Alarms
Alarm limits are where many programs lose credibility. If the limits are too loose, the team catches problems late. If they're too tight, the system creates nuisance alarms and operations stops paying attention.
Standards help, but they shouldn't run the whole program. They provide a reference point for overall condition, not a substitute for machine-specific knowledge.
Where standards help
Velocity-based severity classes give teams a common language for discussing general machine health. That's useful when a plant is trying to build consistency across many motors with different ages, service histories, and operating demands.
A plant with newly installed process pumps may use those classes to establish a starting boundary for acceptable overall vibration. An older utility motor may also be reviewed against that framework, but the decision still needs context. Mounting stiffness, machine size, support condition, and process duty all affect how meaningful the overall reading really is.
Standards are especially helpful in three situations:
- Commissioning new assets. They give the team an initial reference.
- Comparing similar equipment classes. They improve consistency.
- Communicating severity across departments. Operations, maintenance, and engineering can discuss the same condition language.
Where standards fall short
A standard does not know if the motor powers an auxiliary cooling fan or a production-critical extruder. It cannot determine if the machine has always operated with slightly higher vibration, or if the current measurement represents a sudden departure from its typical performance.
That's why the strongest programs pair standards with trend-based alarms built from asset history.
Better alarm logic on the plant floor
| Alarm approach | What it does well | Where it can fail |
|---|---|---|
| Standards-based overall alarm | Gives a common severity reference | May miss early change on a machine that normally runs low |
| Historical trend alarm | Detects deviation from that motor's normal baseline | Requires disciplined data collection and enough history |
| Fault-specific review | Supports targeted action | Needs analyst skill and good spectral data |
A paper mill motor on a critical fan may never cross a broad overall threshold until the defect is already advanced. But a steady deviation from its own established pattern can reveal the problem much sooner. That is often where reliability teams gain real planning time.
The practical answer is simple. Use standards to anchor the program. Use machine history to make it sensitive enough to matter.
Turning Vibration Insights into Smart Maintenance Decisions
Most plants struggle at this point. The team has a diagnosis, maybe even a good one, but it still has to decide whether the motor should stay online, be repaired at the next planned window, or come down now.
That choice can't be based on vibration alone. A key challenge in practice is deciding how to rank urgency, combine vibration with other condition data, and choose whether to fix, monitor, or redesign under real production constraints, as discussed in this resource on practical analysis tools and decision-making gaps.
A triage framework that works on the plant floor
A useful decision framework weighs four things together.
First is fault type. Not every vibration issue carries the same immediate risk. Mild unbalance on a non-critical ventilation fan may be monitored until the next outage. Signs of active bearing surface damage on a critical process motor deserve much faster action because secondary damage can escalate quickly.
Second is asset criticality. A motor on a standby service and a motor on a continuous production bottleneck do not get the same response, even with similar readings. The consequence of failure changes the urgency.
Third is rate of change. A stable but high condition may be manageable short term. A rapidly changing trend is different. Even if the absolute level doesn't look extreme yet, the deterioration rate can justify intervention.
Fourth is operating context. Load, environment, redundancy, spare availability, and the next outage opportunity all matter. A cement plant kiln support motor and a warehouse exhaust fan don't live under the same decision rules.
A diagnosis answers "what is wrong." A maintenance decision answers "what happens if this runs until next week."
A practical urgency screen
- Monitor and trend when the pattern is mild, stable, and on a low-consequence asset.
- Plan repair at next outage when the fault is confirmed, deterioration is present, and failure consequence is meaningful but manageable.
- Escalate for immediate review when the pattern suggests active bearing damage, severe looseness, electrical concern, or a fast-moving change on a production-critical motor.
- Consider redesign or system correction when the same failure repeats after repair. Chronic misalignment, poor base stiffness, or process-induced loading won't be solved by replacing parts alone.
A structured predictive maintenance program can support that triage by combining route data, continuous monitoring, and asset criticality into one maintenance decision process. Forge Reliability provides that kind of support for industrial plants using vibration, thermography, oil analysis, ultrasound, and motor-related diagnostics.
Why combined condition data leads to better repair timing
Vibration should lead the conversation, but it shouldn't work alone.
If the vibration pattern suggests a bearing defect, thermography may show whether heat is also rising. If the pattern points toward an electrical issue, motor current signature analysis can help confirm that the fault isn't purely mechanical. If looseness is suspected, inspection findings at the base, hold-downs, or bearing fits may settle the question faster than another round of trending.
A chemical process motor driving a critical pump is a good example. If vibration shows developing bearing activity but temperature is stable and the trend is slow, the team may schedule the repair in the next controlled outage. If vibration, heat, and lubricant condition all worsen together, that same motor moves into a much shorter response window.
Good decisions come from stacked evidence, not isolated readings.
The plants that get the most value from vibration analysis of motor aren't just better at finding faults. They're better at deciding what deserves action now, what can wait, and what needs a larger reliability fix so the same motor doesn't fail the same way again.
If a plant is trying to turn vibration data into clearer maintenance decisions, Forge Reliability offers a free reliability assessment to review critical motors, current monitoring practices, and the gaps between detection and action.