A plant manager usually sees the same pattern before asking about predictive vs preventive maintenance. The team is closing PM work orders on time. The planners are booked solid. Storeroom turns look reasonable. Then a critical compressor, gearbox, or process pump fails a few weeks after a scheduled service, and production asks the question maintenance hates hearing: if the asset was just serviced, why did it still fail?
That's the problem with the predictive vs preventive maintenance debate. It isn't a theoretical choice between two maintenance buzzwords. It's a decision about where fixed schedules still make sense, where condition data should drive action, and how much risk a plant is willing to carry on equipment that can shut down a line.
In many facilities, the answer isn't to abandon PM. It's to stop treating every asset the same. Programs that adopt predictive maintenance for critical equipment report meaningful gains. Predictive maintenance programs can cut unplanned downtime by 30% to 50% and reduce maintenance costs by 10% to 25%, while roughly 30% of surveyed facilities had already adopted predictive maintenance according to this industrial maintenance summary. The practical question is where those methods belong, and where a well-run preventive program is still the better use of labor and budget.
Table of Contents
- The Hidden Risk of Calendar-Based Maintenance
- Defining Core Maintenance Philosophies
- A Technical Comparison of Maintenance Approaches
- Key Predictive Monitoring Technologies and Their Applications
- Building a Hybrid Strategy with Asset Criticality
- Calculating ROI and Implementing a Phased PdM Program
- Your Maintenance Strategy Decision Checklist
The Hidden Risk of Calendar-Based Maintenance
A chemical plant's main process pump gets rebuilt every planned outage. Bearings are replaced. Alignment is checked. Lubrication is refreshed. The work order closes cleanly. Three weeks later, vibration climbs, seal temperature rises, and the pump trips in service. The production team sees a recent PM sticker. Maintenance sees an asset that failed between intervals.
That's the blind spot in calendar-based maintenance. A scheduled task assumes deterioration follows the calendar. Real machines rarely cooperate. Contamination, load swings, poor lubrication practice, base looseness, process upset, and operating context push equipment along different failure curves. A compressor running clean and steady may survive well beyond its scheduled interval. Another unit in a hot, dirty corner of the plant may enter failure long before the next PM route.
Preventive maintenance still matters. A plant needs scheduled lubrication, inspections, statutory tasks, and basic care. Teams that want to tighten those routines often start by improving their preventive maintenance program structure. But PM alone can create false confidence when the schedule becomes the proxy for condition.
Practical rule: A completed PM doesn't prove asset health. It only proves the scheduled work was done.
Calendar-based programs also create hidden cost in two directions:
- Over-maintenance: healthy parts get replaced early, introducing labor cost and the risk of infant mortality after intrusive work.
- Under-detection: developing faults grow between intervals because nobody is measuring the right signal.
A plastics plant sees this often on chilled water pumps, extruder gearboxes, and air compressors. The PM schedule may be disciplined, yet misalignment, bearing damage, oil contamination, or motor electrical issues still progress in the gap between scheduled tasks. That's why the useful question isn't whether PM is good or bad. It's whether the interval matches the failure behavior of the asset.
Defining Core Maintenance Philosophies
Preventive and predictive maintenance are often discussed as if they're small variations of the same program. They're not. They use different trigger logic.
Preventive maintenance
Preventive maintenance is time-based or usage-based maintenance. The team performs work at a set calendar interval or after a defined number of operating hours, whether the machine shows deterioration or not.
A common example is the plant's main air compressor that gets serviced every 2,000 operating hours. Filters are changed, oil is replaced, and inspections are performed on schedule. That works well when wear is broadly age-related, when the task is low cost, or when regulation and warranty requirements demand routine service.
Industry guidance estimates that preventive maintenance delivers 12% to 18% cost savings over reactive maintenance, while predictive maintenance delivers 25% to 30% savings. That same guidance notes that predictive maintenance usually needs a larger upfront investment and 12 to 24 months to fully implement, according to this maintenance comparison from UpKeep.
Predictive maintenance
Predictive maintenance is condition-based maintenance. The team monitors asset health and intervenes when the data shows deterioration is developing. The trigger isn't the calendar. The trigger is evidence.
On that same air compressor, the plant may monitor:
- Vibration trend changes that point to bearing wear, looseness, or imbalance
- Oil condition that reveals contamination, viscosity shift, or internal wear
- Temperature behavior that indicates friction, cooling problems, or electrical stress
- Performance trend changes such as declining output or increasing energy draw
For plants trying to formalize this logic at the policy level, a structured reliability-centered maintenance implementation guide helps decide which tasks should remain scheduled and which should become condition-driven.
Preventive maintenance asks, “Has enough time passed?” Predictive maintenance asks, “What is the asset telling the team right now?”
The difference sounds simple, but it changes everything. It changes how labor is deployed, how outages are planned, how spares are stocked, and how maintenance justifies its budget to operations.
A Technical Comparison of Maintenance Approaches
A useful predictive vs preventive maintenance comparison has to go beyond generic pros and cons. Plant leaders need to evaluate each strategy against actual engineering criteria.
Decision matrix for plant equipment
The table below uses a critical gearbox in a chemical processing plant as the reference case.
| Criterion | Preventive Maintenance (Time-Based) | Predictive Maintenance (Condition-Based) |
|---|---|---|
| Work trigger | Calendar date or operating hours | Measured condition change or fault signature |
| Cost profile | Lower initial setup, but can drive unnecessary parts replacement and intrusive work | Higher initial spend for sensing, analytics, and training, but better long-term targeting |
| Data and infrastructure needs | CMMS scheduling, task lists, basic inspection records | Sensors or route-based measurements, trending, alarm logic, analysis workflow |
| Failure detection capability | Best for known wear-out tasks and routine care | Best for detecting emerging defects such as bearing damage, imbalance, misalignment, lubrication issues, and thermal anomalies |
| Labor model | Repeating scheduled tasks, easier to assign broadly | Fewer but more targeted interventions, requires analysis skill and response discipline |
| Best asset fit | Low- to medium-criticality assets, simple utilities, compliance tasks | Bottleneck, high-value, high-consequence assets where downtime is expensive |
| Failure risk between intervals | Can miss faults that develop after the last service | Lower when the monitored failure mode produces detectable signals |
| Parts usage | More early replacement risk | Better timing of replacement near actual degradation window |
Plants that apply predictive methods well can reduce overall maintenance costs by 25% to 35% and improve asset availability by 30% to 45% versus traditional preventive approaches, according to this condition-based maintenance analysis.
A related point often gets missed in maintenance strategy meetings. Lubrication quality heavily affects what any strategy can achieve. If the plant uses the wrong fluid or poor contamination control, no schedule or sensor system will rescue the asset. On machining and cutting operations, selection and management of Evo Dyne Products industrial fluids is a useful example of how lubricant condition directly shapes wear, heat generation, and service life.
How the strategies behave on a critical gearbox
Consider a reducer on a resin transfer conveyor. It carries a high production consequence because line stoppage backs up upstream equipment quickly.
With a preventive strategy, the plant may:
- change oil on a fixed interval
- inspect seals during shutdowns
- perform periodic visual checks
- replace bearings during major overhauls
That's sensible baseline care. But it won't reliably catch a growing inner race defect, soft foot, coupling misalignment, or lubrication contamination at the right time unless those failure modes happen to line up with the inspection window.
With a predictive strategy, the team can monitor for:
- Vibration spectral changes tied to gear mesh issues or bearing damage
- Oil debris and contamination indicators that show internal distress
- Temperature shifts tied to friction or lubrication breakdown
- Load-related trend changes that flag changing operating stress
A gearbox rarely fails because the calendar says it should. It fails because load, lubrication, alignment, contamination, and internal damage move it toward a detectable fault state.
That distinction matters when discussing mean time between failure calculations. MTBF is useful for understanding asset history, but it doesn't tell the team whether a specific machine is healthy today. Condition data does.
The practical takeaway is straightforward. PM controls routine care. PdM controls timing. Plants need both, but not in equal measure on every asset.
Key Predictive Monitoring Technologies and Their Applications
Predictive maintenance only works when the monitoring method matches the failure mode. Plants waste money when they install sensors because the technology sounds advanced, not because it captures the right physical signal.
This visual summarizes the main categories used in industrial condition monitoring:
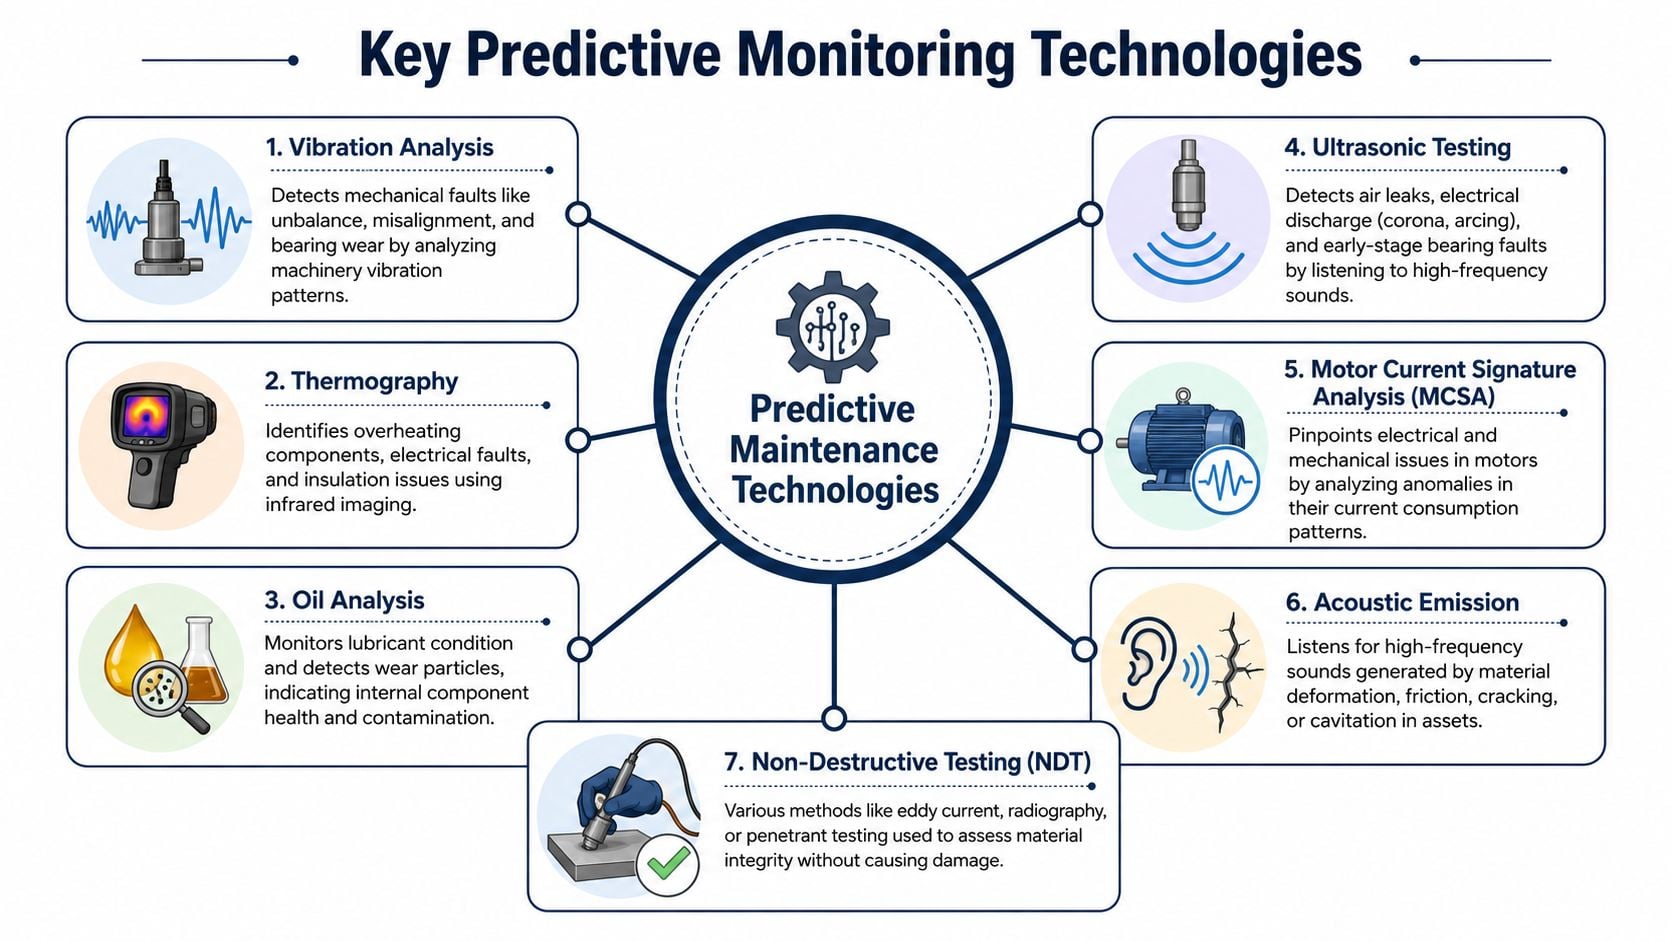
What each technology actually detects
Vibration analysis measures the motion of rotating equipment. It's the primary tool for unbalance, misalignment, looseness, resonance concerns, and rolling element bearing faults. It's especially valuable on pumps, fans, motors, gearboxes, and compressors. Plants that need a formal route or troubleshooting support often start with vibration analysis services.
Thermal imaging measures surface temperature patterns. It's strong for electrical connections, overloaded circuits, motor hot spots, refractory issues, and some mechanical friction problems. It's often the fastest way to screen MCCs, switchgear, and overloaded bearings during operating rounds.
Oil analysis evaluates lubricant condition and machine health through contamination, wear debris, additive condition, and fluid degradation. It works best on gearboxes, hydraulic systems, compressors, and circulating oil systems. It's less useful on assets with tiny sumps and poor sample quality unless the sampling method is controlled.
Matching tools to equipment and failure modes
Ultrasound detects high-frequency sound energy. It's excellent for compressed air leaks, steam trap issues, electrical discharge, and early-stage bearing friction. In many plants, ultrasound finds utility losses and incipient bearing problems before they become obvious in standard inspections.
Motor current signature analysis examines electrical current patterns to identify motor and driven-equipment issues. It's valuable when the team suspects rotor defects, air gap eccentricity, or electrically visible load anomalies. It's particularly useful where access for direct mechanical measurement is limited.
Other methods also have a place:
- Acoustic emission: useful for detecting friction, cracking, cavitation, or deformation events that produce high-frequency stress waves.
- Non-destructive testing: useful for material integrity questions such as wall loss, cracking, or surface defects where the issue is structural, not just rotating condition.
A food and beverage plant offers a clear example. Vibration analysis is the primary tool on homogenizer motors and high-speed pumps. Oil analysis is applied to gear reducers and hydraulic power units. Thermography is used on panels in washdown areas where moisture-related electrical issues are common. Ultrasound is often the quickest way to locate air leaks that tax the utility system.
Field advice: Don't start by asking which technology is most advanced. Start by asking which failure mode hurts the plant most, and what signal appears first.
The strongest PdM programs don't rely on one method. They combine methods where the failure physics justify it.
Building a Hybrid Strategy with Asset Criticality
The best answer to predictive vs preventive maintenance usually isn't a single strategy. It's a hybrid allocation model.
The useful operational question is not which approach wins in the abstract. It's what mix fits the plant's assets, failure modes, and downtime exposure. Many facilities keep preventive schedules on lower-criticality assets and reserve predictive monitoring for equipment where an unplanned failure has the highest operational and financial consequence, as described in this overview of proactive maintenance strategy selection.
This framework is easier to apply when the plant maps assets by criticality first:
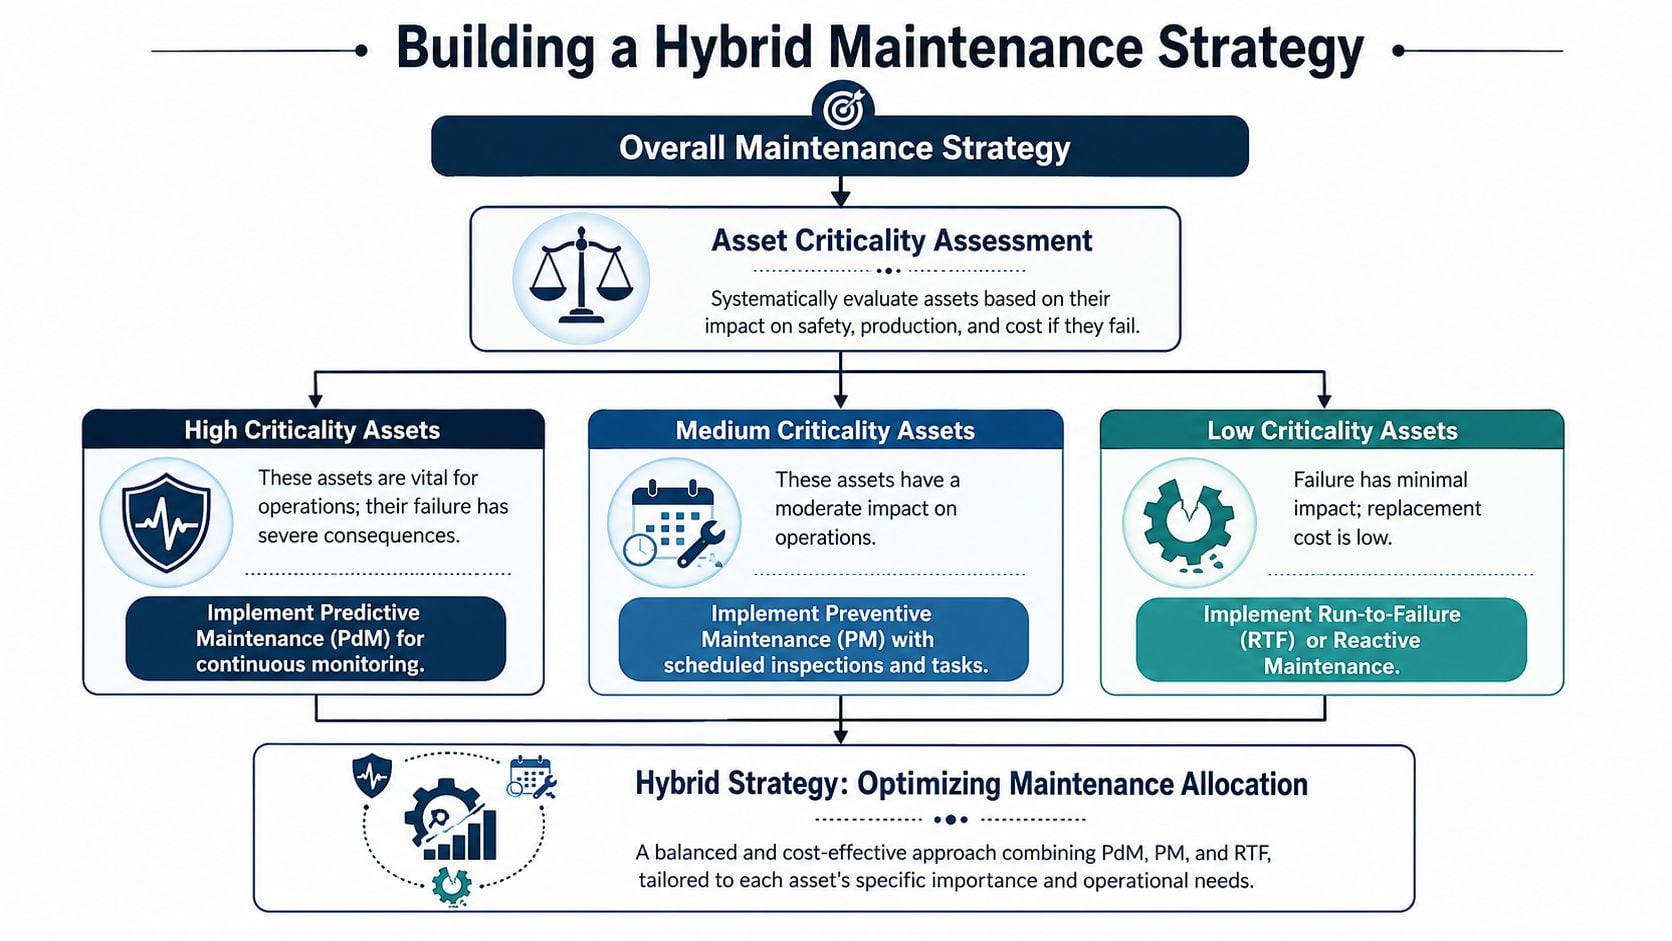
How to rank assets without overcomplicating it
A practical criticality review should score each asset on a few direct questions:
- Safety consequence: If this asset fails, can people get hurt or can an environmental event occur?
- Production consequence: Does failure stop the line, reduce rate, or create quality loss?
- Repair consequence: Is the fix simple, or does it require specialty labor, long lead spares, or major outage coordination?
- Failure detectability: Can the team detect the dominant failure mode early with available technology?
- Redundancy: Is there a true installed spare, or is the “backup” a manual workaround that still hurts throughput?
Plants often overrate equipment because everything feels important. The better method is to rank consequence, not sentiment.
A practical asset allocation model
A paper mill provides a useful example.
High-criticality assets such as a primary press roll drive, main vacuum pump, or recovery boiler fan should usually receive continuous or high-frequency predictive monitoring. These assets justify better sensing because one failure can disrupt a large part of the process.
Medium-criticality assets such as stock prep pumps, trim conveyors, or auxiliary process motors usually fit route-based monitoring, optimized lubrication tasks, and focused PM. These machines matter, but they don't all need permanent instrumentation.
Low-criticality assets such as warehouse exhaust fans, nonessential utility skids, or office HVAC units often remain on straightforward PM or even run-to-failure if risk is low and replacement is simple.
That hybrid model gives planners defensible logic for labor allocation. It also prevents the common mistake of spreading predictive tools too thin across the entire plant and generating more alerts than the team can act on.
The plant doesn't need more data on every asset. It needs better decisions on the assets that can hurt production the most.
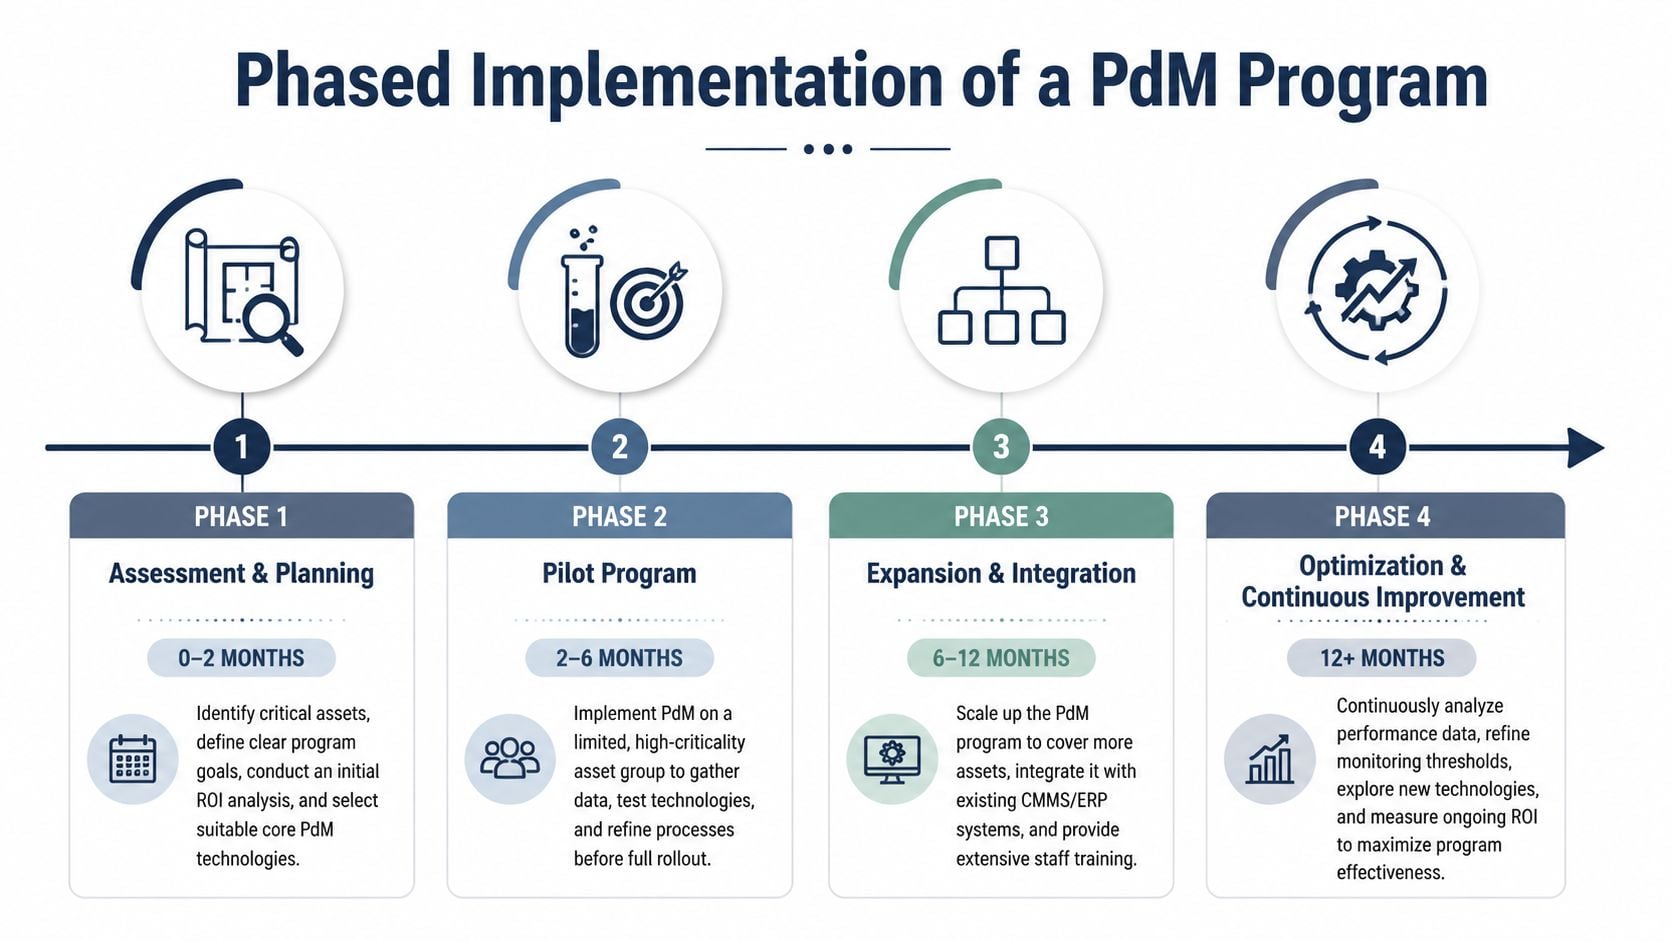
Calculating ROI and Implementing a Phased PdM Program
Predictive maintenance often loses support for the wrong reason. Plants try to justify it as a technology project. It's better justified as a downtime avoidance and planning discipline.
Heavy-equipment benchmark data reported preventive maintenance at $127,000 per unit annually versus $84,000 for predictive maintenance, a 34% reduction. The same report noted modern AI-enabled systems reaching 85% to 92% prediction accuracy with 2 to 8 week warnings for major failures, according to this heavy-equipment maintenance cost comparison.
This implementation sequence captures the practical rollout path:
A simple ROI logic plant leaders can use
A basic ROI model doesn't need to be complicated. It should compare:
- Avoided downtime cost
- Reduced emergency labor and contractor cost
- Reduced premature parts replacement
- Improved outage planning and spare staging
Against:
- Sensors and hardware
- Software or monitoring service cost
- Training and analyst time
- Workflow integration effort
A plastics plant can apply this to an injection molding press hydraulic power unit. If one unplanned failure creates scrap, missed schedule, and overtime, the business case may be stronger than it first appears. The key is to use actual plant consequence, not generic averages, for downtime cost.
A phased rollout that avoids common failure points
A phased program is safer than a plantwide launch.
Assessment and planning
Choose a small set of critical, failure-prone assets. Define the failure modes to monitor. Don't start with equipment that's easy to instrument but operationally insignificant.Pilot deployment
Establish baselines. Decide who reviews alarms, who validates findings, and how the maintenance planner converts findings into work.Expansion and integration
Add assets only after the pilot produces trusted findings. Build CMMS links and alarm priorities carefully. Plants often fail here by generating alerts faster than the team can triage them. A structured 12-month reliability program roadmap is useful at this stage.Optimization
Tune alarm thresholds, clean up false alerts, and refine routes versus continuous monitoring decisions.
The most common implementation mistake isn't buying the wrong sensor. It's building no execution path between a detected problem and a planned corrective action.
Your Maintenance Strategy Decision Checklist
By the time a plant is evaluating predictive vs preventive maintenance, the decision usually isn't technical anymore. It's organizational. The team has to decide whether it wants a cleaner schedule, better fault visibility, or both, and whether it can act on the information it collects.
This checklist keeps that decision grounded in plant reality:
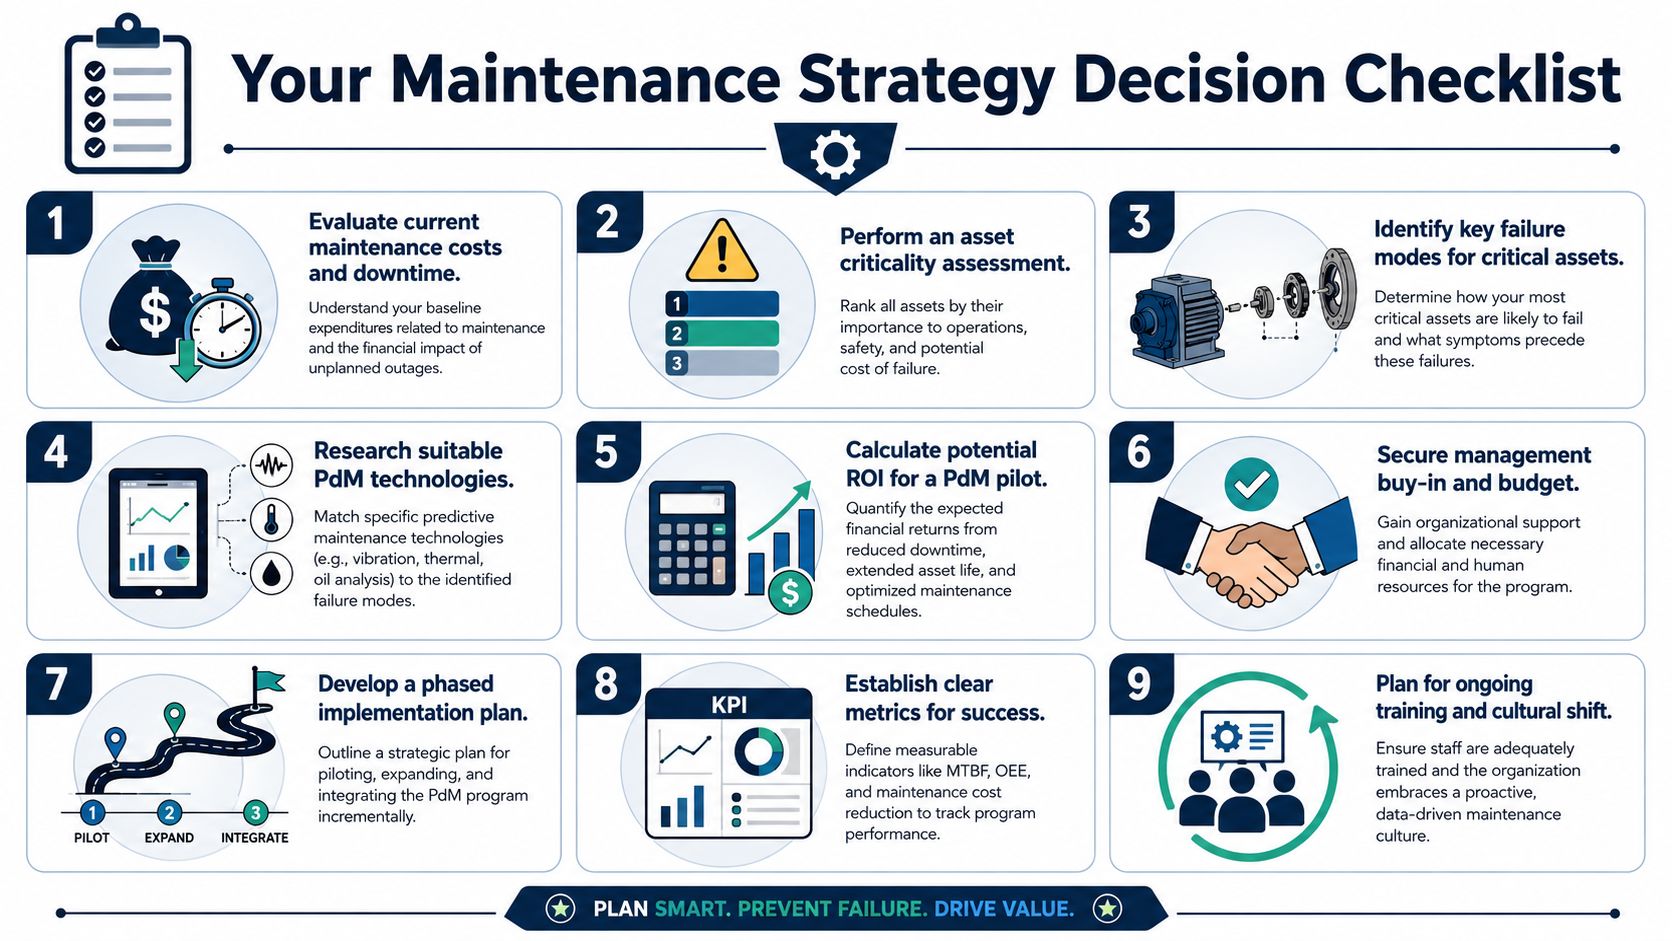
- Asset ranking is formalized: Has the plant ranked assets by safety, production, quality, repair complexity, and redundancy?
- Failure modes are known: For each critical pump, motor, gearbox, compressor, or fan, does the team know the dominant failure modes and the symptoms that appear first?
- Current PM value is tested: Which PM tasks clearly prevent failure, and which ones persist only because they've always been on the schedule?
- Downtime consequence is understood: What does one hour of unplanned downtime cost on the bottleneck process?
- Monitoring methods fit physics: Is the plant matching vibration, thermography, oil analysis, ultrasound, or electrical testing to the specific failure mechanism?
- Data has an owner: Who reviews the data, who decides priority, and who turns that finding into a work order?
- Backlog discipline exists: Can the team schedule condition-based repairs before they become emergency work?
- Pilot scope is realistic: Is the first wave limited to a manageable group of high-consequence assets?
- Success measures are defined: Will the plant track avoided failures, asset availability, parts usage, and planning efficiency?
A maintenance strategy is only as good as the plant's ability to convert findings into scheduled corrective work.
Plants that answer those questions usually land in the same place. Critical assets move toward predictive monitoring. Essential but less exposed equipment stays on optimized PM. Low-consequence assets remain simple.
If a plant needs help deciding where predictive maintenance belongs, Forge Reliability offers a free reliability assessment focused on asset criticality, failure modes, monitoring strategy, and practical rollout planning. It's a straightforward way to identify which equipment should stay on PM, which should move to condition-based monitoring, and how to build a reliability program that reduces unplanned downtime without overcomplicating maintenance.