
A critical pump trips again during peak production, maintenance swaps the bearing cartridge, and the unit is back online by the end of the shift. Two months later, it fails the same way. That pattern usually means the plant repaired the damage but never mapped the failure logic that produced it.
Fault Tree Analysis, or FTA, gives reliability teams a practical way to work backward from a single plant problem and identify the cause paths that can recreate it. The method starts with one top event, such as pump cavitation, bearing spalling, or a motor ground fault, and breaks that event into intermediate and basic events that can be inspected, tested, or designed out. In practice, that matters because recurring failures rarely come from one isolated defect. They come from combinations of process conditions, maintenance errors, degraded components, and weak controls lining up at the same time.
The logic structure is simple enough to use in the field but strong enough to support serious reliability decisions. OR gates show paths where any one event can trigger the top event. AND gates show the combinations that must occur together. The value is not the diagram by itself. The value is what the diagram forces a team to clarify: what failed, what evidence confirms each branch, which combinations are most exposed, and which corrective action removes risk instead of delaying the next outage.
Minimal cut sets usually separate useful FTA work from paperwork. If an order-1 cut set can produce the top event, one bad actor can stop the asset. If several higher-order cut sets dominate, the strategy shifts toward condition monitoring, operating discipline, and protection layers. That is why plant teams get so much from well-built FTA case studies. They connect the tree to real diagnostics, such as vibration signatures, oil cleanliness limits, temperature trends, insulation test results, and valve leakage checks, then tie those findings to maintenance plans, spares decisions, and redesign priorities.
That is also the standard used in the case studies that follow. Each one is built around a common industrial asset, a clearly defined top event, the logic that links symptoms to causes, the diagnostic checks that confirm the active branch, the minimal cut sets that deserve attention first, and the corrective actions most likely to improve uptime. For teams dealing with recurring pump problems, that often starts with understanding pump cavitation causes and corrective actions before the next repair order arrives.
Table of Contents
- 1. Centrifugal Pump Failure Due to Cavitation
- 2. Rolling Element Bearing Spalling and Race Degradation
- 3. Gearbox Oil Degradation and Gear Tooth Failure
- 4. Motor Winding Insulation Degradation and Phase-to-Ground Fault
- 5. Compressor Capacity Control Valve Malfunction and Bypass Leakage
- 6. Heat Exchanger Tube Fouling and Thermal Performance Degradation
- 7. VFD Power Stage Failure and Fleet Reliability Strategy
- Fault Tree Analysis, 7 Case Comparison
- Putting Analysis into Action Your Next Steps to Uptime
1. Centrifugal Pump Failure Due to Cavitation
The call usually starts the same way. Operators report a pump that has turned noisy, flow is slipping, and the last rebuild did not last. By the time maintenance opens the casing, the impeller shows pitting at the eye and along the vane surfaces. That is the point where fault tree analysis earns its keep, because it separates cavitation from the bearing, seal, and alignment symptoms that tend to distract the team.
For this case, the top event should stay tight: pump cavitation damage causing loss of capacity. That definition keeps the tree focused on the fluid conditions that create vapor bubbles and the operating factors that let those bubbles collapse inside the pump. If the top event is written as "pump failure," the analysis quickly fills with unrelated branches and stops helping anyone make a decision.
At the first level, the tree is usually built around an OR gate with three common paths:
- Insufficient NPSH available
- Process changes that reduce suction margin
- Suction-side restriction or poor inlet conditions
Those branches sound simple, but the useful tree goes one level deeper. Under insufficient NPSH available, I usually break out high liquid temperature, low suction vessel level, excessive suction lift, and friction losses that were underestimated during design or added later by field changes. Under restriction, the usual contributors are a dirty strainer, a partially shut valve, collapsed hose or liner, fouled suction piping, or piping geometry that creates localized pressure loss at the pump eye.
Minimal cut sets matter here because they show how little it can take to produce repeat damage. A single dirty strainer may be enough. So can one process change, such as a hotter incoming fluid. In other cases the damaging path is a combination event, like marginal suction head plus a temporary rate increase. That distinction affects what gets fixed first and what needs procedural control instead of a hardware change.
Failure logic on the suction side
Cavitation trees work best when they reflect the actual operating envelope, not the nameplate duty point. A pump that runs clean in winter may cavitate every summer because source level drops while fluid temperature rises. A transfer pump may only fail during startup because the suction line is not fully flooded. A production team may call it intermittent. The tree usually shows it is conditional.
That is why I want the logic tied to evidence, not assumptions. For recurring pump cases, a bearing root cause analysis approach for rotating equipment is also useful because it helps teams separate secondary mechanical damage from the fluid-side trigger.
What maintenance teams should check first
The best pump FTAs include the diagnostic checks that prove or eliminate each branch. Start with data gathered at the same operating condition, because a vibration reading from one shift and a suction pressure from another can send the team in the wrong direction.
- NPSH margin check: Recalculate NPSH available using actual suction pressure, liquid temperature, vapor pressure, fluid level, and flow rate. Use current piping losses, not old design values.
- Suction pressure stability: Look for pressure drop, oscillation, or vacuum excursions during rate changes, batch transitions, or tank level swings.
- Strainer differential pressure: Trend it. Rising differential pressure often appears before operators notice capacity loss.
- Vibration and acoustics: High-frequency broadband vibration and ultrasonic activity can support a cavitation diagnosis, especially when the pattern changes with flow or suction conditions.
- Damage location on the impeller: Pitting near the eye and vane inlet supports cavitation. Damage concentrated elsewhere may point to solids erosion or recirculation instead.
- Process temperature review: Small increases in suction temperature can erase the safety margin on a pump that already runs close to its limit.
One practical trade-off comes up often. Teams want to replace the impeller and return the unit to service quickly. That restores production, but it rarely changes the failure path. If the tree shows a single-point issue such as an undersized suction line or poor operating control near minimum suction margin, the durable fix is usually process or piping work, not another rotating-element changeout.
Corrective action should follow the branch that dominates risk. If the cut set is strainer fouling, tighten inspection intervals and address upstream contamination. If the cut set is low source level plus high fluid temperature, revise operating limits and add alarms around the cavitation threshold. If inlet geometry is the problem, review reducer orientation, straight-run length, and valve placement. For recurring cases, use pump cavitation causes and solutions as a field reference, then update the PM task list so the same conditions are caught before the impeller is damaged again.
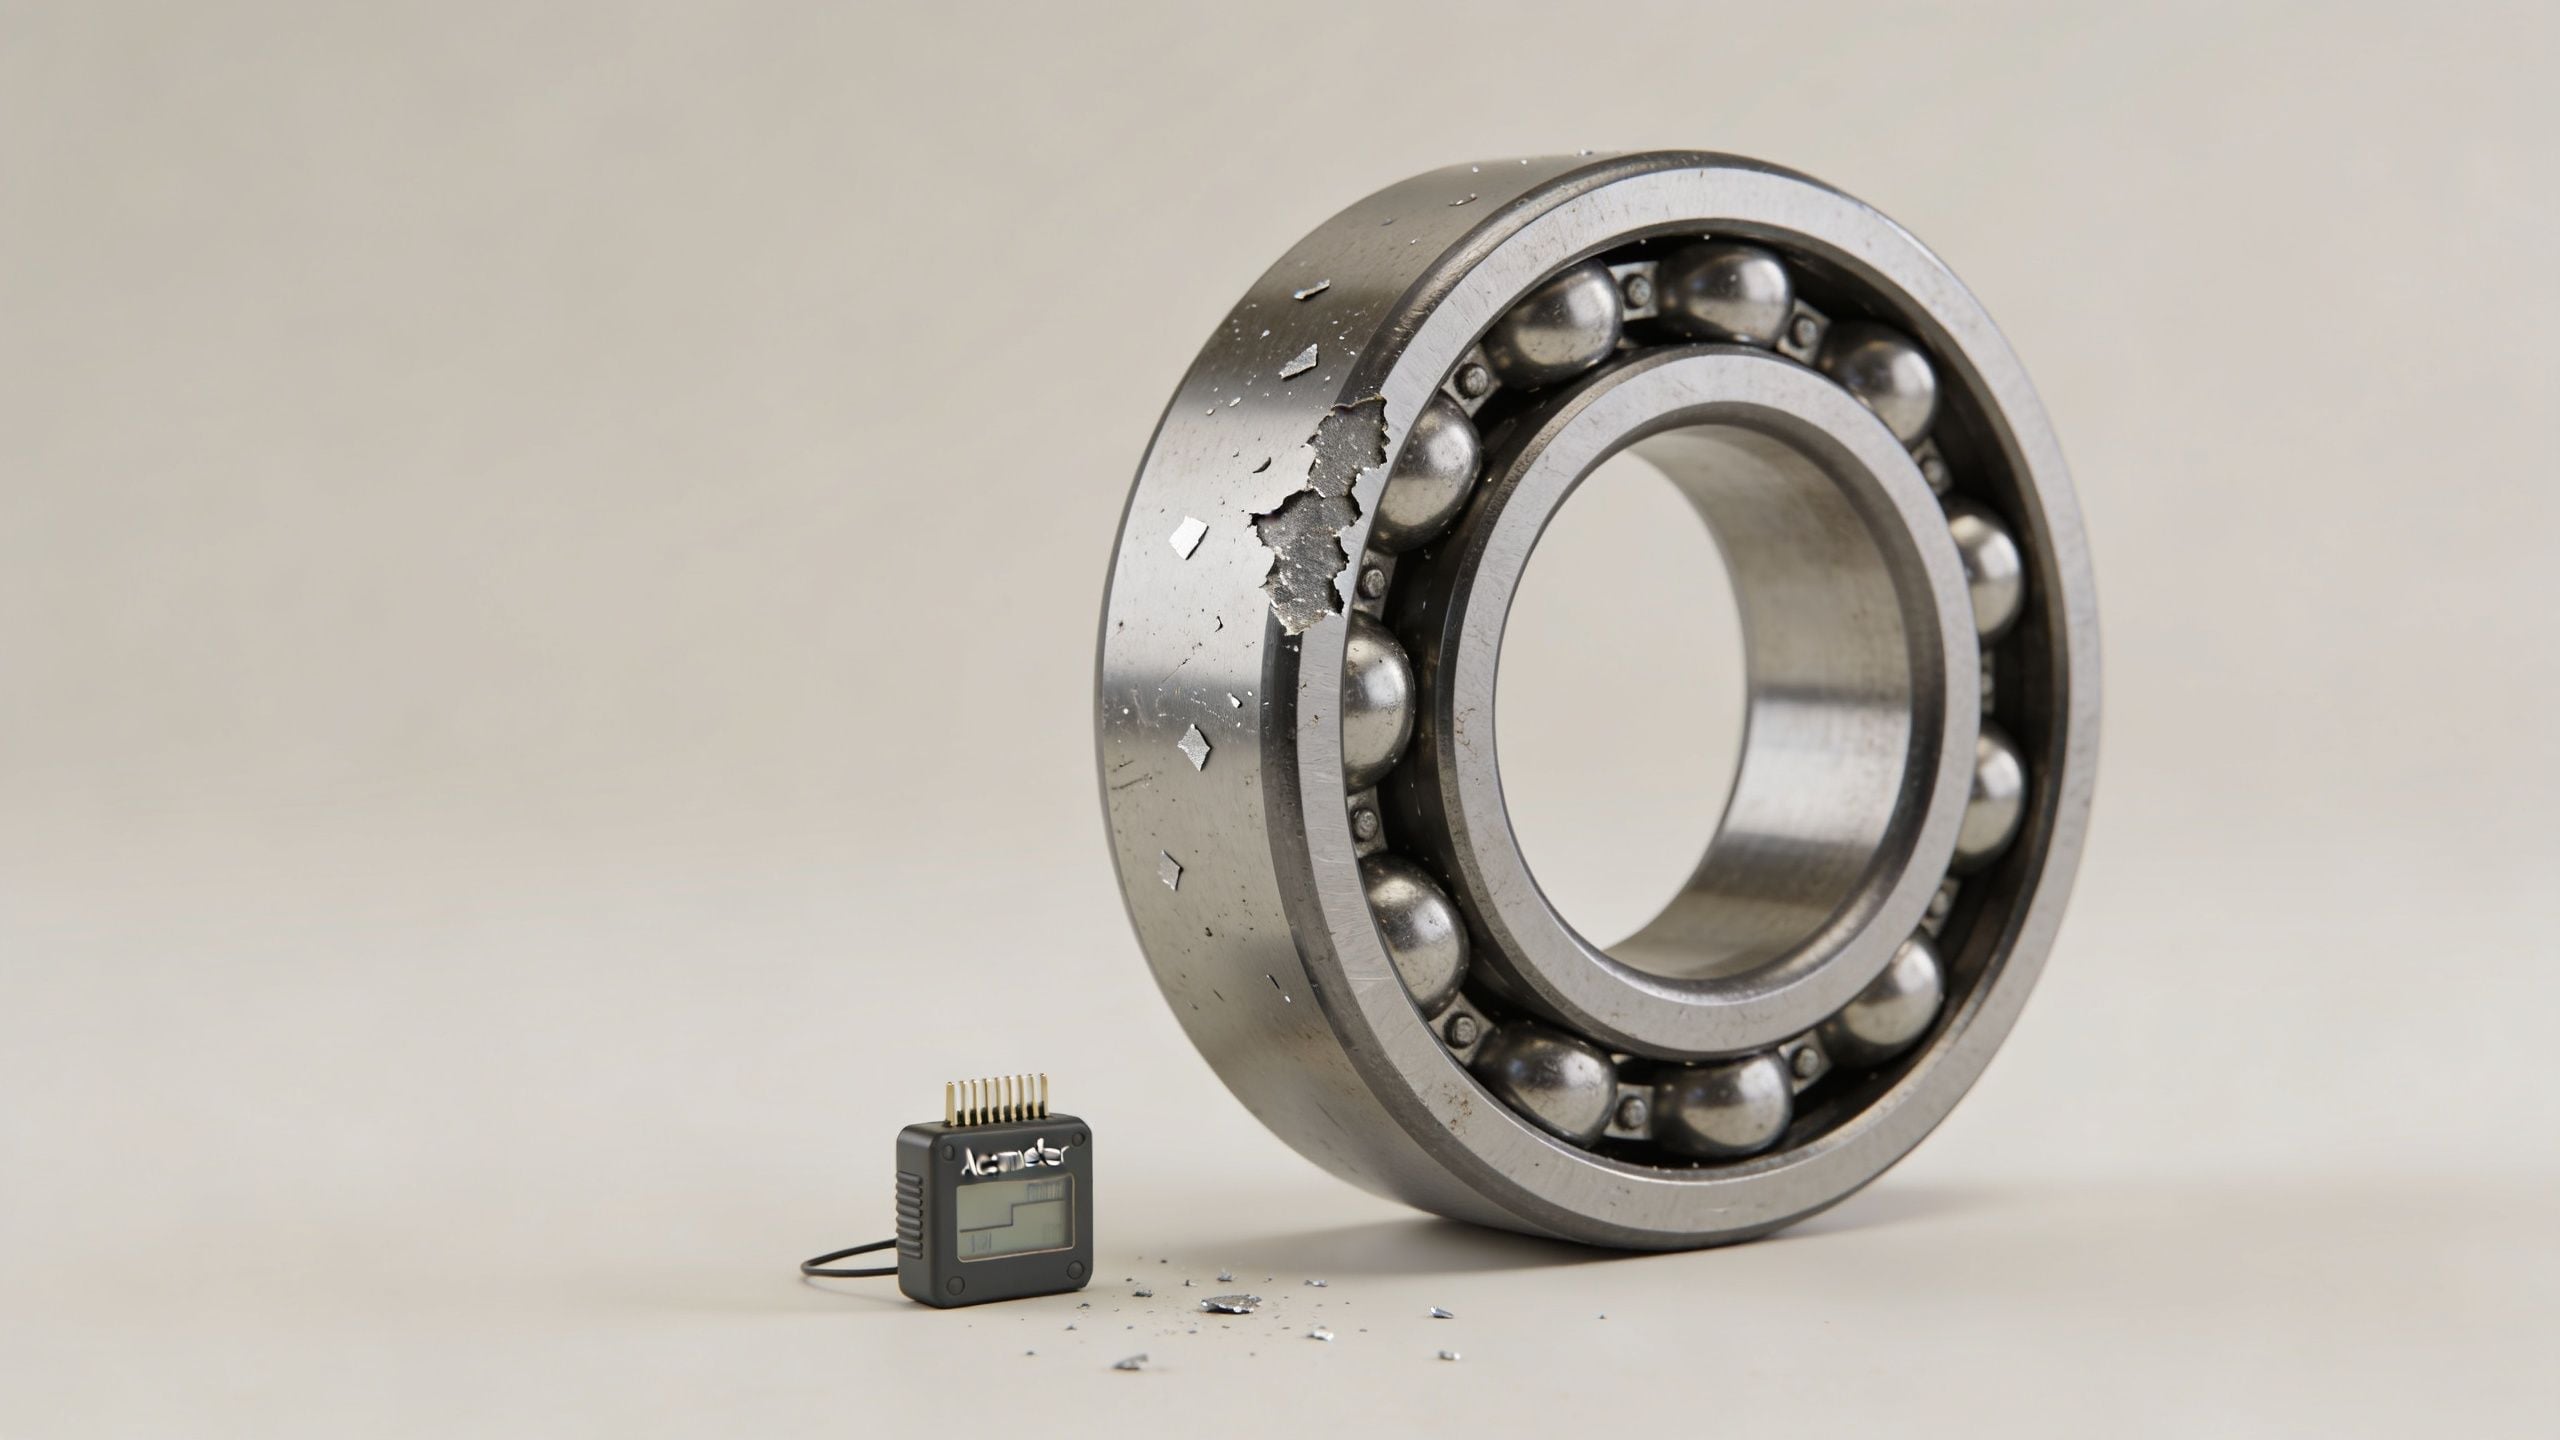
2. Rolling Element Bearing Spalling and Race Degradation
A motor trips on high vibration, maintenance swaps the bearing, and the unit runs again for three months. Then the same bearing position fails with the same damage pattern on the outer race. That is where a bearing fault tree earns its keep. The useful top event is not "bearing failure." It is "loss of load-carrying capacity due to raceway spalling." That definition keeps the analysis tied to a physical damage mechanism and forces the team to sort between fatigue, lubrication loss, contamination, fit problems, and alignment error.
For most plant assets, the first level of the tree is an OR gate with four practical branches: inadequate lubricant film, contaminant ingress, improper internal clearance from fit or preload, and shaft or housing geometry error. Some branches need AND logic to reflect field reality. Grease starvation by itself may not create visible spalling quickly, but grease starvation plus high operating temperature or excess radial load often will. Misalignment can do the same. A small offset may be tolerated until soft foot, thermal growth, or belt tension pushes contact stress past what the race can handle.
This case study works because the checks are specific. The tree is only useful if each branch can be tested with evidence from the machine, the lubricant, and the installation records.
Diagnostic checks that confirm the active branch
Start with vibration, but do not stop there. A single high overall reading is a poor basis for corrective action.
- Envelope or acceleration demodulation: Confirm whether defect energy aligns with BPFO, BPFI, BSF, or FTF. Outer race frequencies that stay stable with load and speed usually point to a localized race defect. Sideband growth around those frequencies often suggests looseness or modulation from fit issues.
- Temperature trend: Compare current bearing metal temperature to that machine's normal operating baseline. A steady increase after relubrication often points to overgreasing, wrong viscosity, or excessive preload. A rapid increase with rising vibration usually means the defect is progressing into a friction-driven failure.
- Lubricant condition: Check grease consistency, oil bleed, contamination, and wear debris. For oil-lubricated housings, use oil analysis for lubrication systems to separate fatigue-driven distress from dirt, water, or viscosity loss.
- Fit and geometry checks: Verify shaft and housing tolerances, locknut setting, runout, soft foot, and shaft alignment. Repeat failures at the same location often trace back to fit or geometry, not the bearing manufacturer or bearing type.
- Load and duty review: Look for process changes, belt tension increases, thermal cycling, starts per hour, and variable-speed operation near critical resonance zones.
The minimal cut sets usually become clear once those checks are combined. A few examples show how the same top event can come from very different paths:
- Contamination-driven spalling: seal damage + dirty environment + inadequate regreasing practice
- Lubrication-driven spalling: wrong grease type + extended relubrication interval + high bearing temperature
- Fit-driven spalling: loose outer race fit + housing creep + vibration-induced fretting
- Alignment-driven spalling: shaft offset + thermal growth not accounted for during alignment
Those distinctions matter because the corrective actions are different.
I have seen teams lose months replacing bearings that were never the primary problem. On conveyors, the actual cause was washdown water getting past the seals. On motors, it was a tight fit that closed internal clearance after startup temperature stabilized. On fan shafts, it was alignment set cold with no allowance for thermal movement. The bearing was the damaged part in every case, but the dominant branch in the tree was different.
A good FTA for bearing spalling ends with action tied to the branch that dominates risk. If contamination is the cut set, improve seals, breathers, storage practice, and regreasing cleanliness. If lubrication breakdown is driving the damage, correct the lubricant specification, set intervals from duty and temperature, and verify delivery volume. If fit or preload is the issue, inspect tolerances and installation method before the next rebuild. If alignment or structural distortion is active, correct soft foot, pipe strain, base condition, and thermal growth targets. For recurring cases, root cause analysis for bearing systems helps connect defect patterns to fixes that extend bearing life.
3. Gearbox Oil Degradation and Gear Tooth Failure
A gearbox comes in hot at the end of shift, operators report a new growl at load, and vibration shows activity around gear mesh. That is the point where weak fault trees waste time. If the top event is just "gearbox failure," the team usually heads straight for teardown. A more useful top event is narrower: gear tooth pitting and wear caused by loss of lubricant film integrity. That definition keeps the analysis tied to physical failure mechanisms and to checks a maintenance team can run the same day.

For this case, the main branches usually split into oxidation, water ingress, particulate contamination, thermal stress, and load-related distress. The logic is rarely all OR or all AND. Oxidized oil by itself may not produce immediate tooth damage, but oxidized oil plus increased temperature and repeated high load often will. Water changes the picture fast because it lowers film performance, drives corrosion, and helps generate abrasive debris that then feeds the wear branch.
The practical value of FTA here is that it separates initiating causes from loud symptoms. I have seen plants pull a gearbox for suspected tooth damage because gear mesh vibration climbed, only to find the gears were reacting to a lubrication problem that had been visible in the oil for weeks.
A self-contained tree for this failure mode should connect each branch to evidence, minimal cut sets, and a corrective action that changes risk.
- Oxidation branch: rising acid number, viscosity shift, darkened oil, varnish or sludge, poor cooler performance, sustained high sump temperature.
- Water ingress branch: high water content, hazy oil, corrosion staining, breather saturation, damaged seals, frequent washdown or humid service.
- Particulate contamination branch: increased particle count, ferrous debris, dirt entry through breathers or fill ports, residue left after maintenance work.
- Load and alignment branch: gear mesh frequency with modulation sidebands, edge contact on tooth patterns, torque excursions, shaft misalignment, coupling issues.
- Thermal stress branch: hot casing zones, restricted oil flow, fouled cooler passages, low oil level, wrong viscosity grade for ambient and load.
Common minimal cut sets look like this:
- Water ingress plus inadequate breather protection
- High temperature plus extended drain interval
- Contamination plus poor filtration or dirty fill practice
- Excess load plus marginal lubricant viscosity
- Misalignment plus degraded film strength
Those combinations matter because the fix is different for each one. Replacing gears without correcting water entry and breather condition usually buys a short, expensive pause. Changing oil without addressing chronic heat gives the same result.
Diagnostics have to be specific. Oil samples should come from a consistent live zone, not from the bottom after shutdown where settled debris distorts the picture. Water content, particle count, viscosity, acid formation, and wear debris trend together better than any single test alone. On the vibration side, gear mesh frequency with sidebands tied to shaft speed often points to load-sensitive distress, while broadband increases with contamination and poor lubrication can suggest surface damage progressing across multiple teeth. Where the gearbox is motor-driven, motor current signature analysis for fault detection can help confirm whether torque fluctuation is feeding the problem or whether the gearbox is the dominant source.
Field conditions usually tell you which branch deserves attention first. In food processing, washdown often overwhelms seals and breathers. In mining, water and dirt control dominate. In continuous-process plants, heat management and oil life are frequent parents in the tree, especially on enclosed units that run near their thermal limit for long periods.
Corrective actions that reduce repeat failures
Corrective action should match the branch, not the symptom.
- For oxidation and heat: verify oil grade, confirm cooler performance, clean flow restrictions, check oil level control, and shorten drain intervals until the trend stabilizes.
- For water ingress: replace failed seals, upgrade breathers, inspect washdown exposure, and confirm the housing is not pulling humid air in during thermal cycling.
- For contamination: improve fill and transfer cleanliness, inspect filters and magnets, and clean housings during rebuilds instead of leaving residual debris in place.
- For load-related distress: review actual transmitted load, coupling condition, shaft alignment, and tooth contact pattern before approving another gear set.
- For recurring wear debris: inspect whether the gear damage is primary or whether bearing looseness, shaft deflection, or housing distortion is changing the contact pattern.
For lubrication-led cases, oil analysis for lubrication systems is usually the fastest way to validate the dominant branch before teardown. That is where FTA earns its keep. It turns a gearbox problem from "replace parts and hope" into a set of checks, minimal cut sets, and actions that improve uptime on the next run, not just after the next rebuild.
4. Motor Winding Insulation Degradation and Phase-to-Ground Fault
A motor runs through another humid night shift, starts cold the next morning, and trips on a ground fault before the line gets to rate. By the time maintenance opens the terminal box, the actual failure has already happened. The short was the end of the chain, not the start.
For fault tree analysis, define the top event tightly: phase-to-ground short caused by winding insulation breakdown. That scope matters. If the top event is written too broadly as "motor failure," the tree fills up with branches that belong somewhere else, such as driven-load issues, control faults, or protection settings. A useful tree for this case usually breaks into thermal aging, moisture ingress, conductive contamination, mechanical abrasion, and terminal or lead connection defects. Some are straight OR branches. Others need AND logic, especially where moisture plus thermal cycling plus inadequate enclosure protection combine to lower insulation margin over time.
This is one of the most practical FTA examples in a plant because the branches are testable before the motor burns down. A reliability team can connect each branch to a shop check, a route-based inspection, or an online condition indicator, then decide whether to dry out, clean, reterminate, rewind, or replace the machine.
Where insulation systems actually lose margin
Thermal aging is still the dominant branch in many sites, but it rarely acts alone. Repeated overtemperature from overload, blocked cooling paths, failed fans, high ambient conditions, voltage imbalance, or frequent starts hardens and cracks insulation. Moisture then gets an easier path into the winding. In washdown service, conductive residue often matters as much as free water. In dirty process areas, carbon dust, chemical vapors, or salt contamination can turn a survivable insulation system into a ground fault candidate.
Mechanical factors deserve their own branch. I have seen motors condemned as "electrical failures" when the initiator was vibration from the driven asset working the end turns and lead supports until insulation wore through. Lead exit points, slot wedges, and terminal box connections are common weak spots. If the frame shakes, the winding system pays for it.
Diagnostic checks that prove or reject each branch
Useful motor winding fault trees are built around checks with clear decision value.
- Insulation resistance and polarization trend: Use the motor's own history, temperature correction, and environment to judge whether the insulation system is stable, wet, or contaminated.
- PI and absorption behavior after cleaning or dry-out: If values recover after drying but fall again in service, the tree should stay focused on moisture ingress or enclosure breathing.
- Thermal imaging at the frame, terminal box, and cable terminations: Localized heating often points to loose or oxidized connections rather than generalized winding aging.
- Current and voltage review: Imbalance, harmonic content, and load-related distortion help separate supply stress from internal winding distress. Motor current signature analysis for fault detection is particularly useful when you need to sort electrical symptoms from mechanical excitation.
- Cooling circuit inspection: Plugged fins, blocked airflow, missing fan covers, and damaged fans belong high in the tree because they drive several downstream branches.
- Contamination and moisture survey: Check drain paths, space heater function, gasket condition, conduit seals, washdown exposure, and signs of condensation in the terminal box.
- Vibration and structural checks: Look for increased running vibration, soft foot, base looseness, coupling issues, and resonance that can abrade leads or winding supports.
Minimal cut sets that show up often
Several small combinations account for a large share of repeat failures. One common cut set is blocked cooling plus sustained overload. Another is washdown exposure plus compromised seals or drains. A third is high vibration plus inadequate lead support at the termination area. A fourth is contamination plus thermal cycling inside a motor that regularly cools below ambient dew point.
Those combinations matter because the corrective action changes with the cut set. Drying a winding may get a motor back online, but it will not fix a missing drain, a failed space heater, or a fan that stopped moving air months ago.
Corrective actions tied to the branch
Match the intervention to the proven cause path.
- For thermal aging: verify actual load, supply balance, start frequency, cooling airflow, fan condition, and ambient temperature around the motor.
- For moisture ingress: restore seals and drains, inspect conduit entry points, confirm space heater operation, and review whether the enclosure rating fits the washdown or outdoor exposure.
- For conductive contamination: clean the motor correctly, control dust or chemical exposure, and check whether purge, shielding, or a different enclosure is justified.
- For mechanical abrasion: correct vibration at the source, inspect lead bracing and end turns, verify alignment and soft foot, and check whether piping strain or base distortion is feeding movement into the frame.
- For terminal defects: reterminate, torque correctly, replace heat-damaged lugs and insulation, and inspect for tracking inside the box.
There is a real trade-off with intrusive electrical testing. High-potential or aggressive off-line testing can answer a question, but it can also add stress to an already weak insulation system. If trend data, thermal evidence, contamination findings, and current behavior already isolate the branch, lower-risk diagnostics often support a better maintenance decision. That is the point of the fault tree. It turns a motor burnout from a vague electrical event into a set of minimal cut sets, targeted checks, and corrections that improve uptime on the next run.
5. Compressor Capacity Control Valve Malfunction and Bypass Leakage
Compressed air systems create a classic troubleshooting trap. Delivery pressure drops, operators hear the complaint from production, and attention goes straight to motor load, demand growth, or aftercooler performance. In many cases, the top event belongs in a fault tree as "reduced compressor capacity caused by control valve bypass leakage." That is a very different problem from "compressor underperforming."
The first branch often splits through OR logic into valve seat wear, contamination, pilot line blockage, actuator malfunction, and carbon deposits that prevent proper transition. Depending on design, an AND gate may be needed where leakage only becomes significant when seal wear combines with poor valve positioning, altering the necessary corrective action. Cleaning a cooler won't fix a leaking unloader or capacity control element.
A common misdiagnosis in compressed air systems
A pharmaceutical plant may see pressure drift while demand remains stable. A bottling line may notice lower delivery pressure and assume the plant needs more compressor horsepower. A metal fabrication shop may fight chronic low pressure when the issue is internal bypass coupled with fouling elsewhere in the package.
The fault tree works because it makes teams prove the branch. Pressure, flow, power draw, discharge temperature, and thermal imaging should all be checked together. If power rises without a matching increase in useful flow, internal leakage becomes a credible path.
Where the fault tree usually points
Once the tree is laid out, several checks tend to separate root cause from noise:
- Pressure decay testing: Isolate the machine and verify whether discharge pressure falls faster than it should with the discharge side closed.
- Specific power review: Compare motor kilowatts to delivered flow. Deterioration often shows up here before production notices severe pressure loss.
- Thermal imaging: A hotter-than-expected valve body or discharge path can indicate active bypass flow.
- Lubricant condition: On oil-injected units, oil degradation and contamination can support the carbon deposit branch.
A compressor can still run every day and still be failing. FTA is useful precisely because it catches functional failure before hard failure.
This kind of analysis is especially valuable where compressed air quality and pressure stability affect product quality, packaging, controls, or instrument air reliability. The best corrective actions usually combine valve service, contamination control, oil review, and verification of actual air demand instead of defaulting to larger equipment or more run time.
6. Heat Exchanger Tube Fouling and Thermal Performance Degradation
A heat exchanger rarely fails all at once. The usual pattern is slower cooling, a creeping approach temperature, an operator adjustment to keep production on spec, and then an outage when the margin finally disappears. Fault tree analysis is useful here because it forces the team to define the top event clearly: loss of required heat transfer caused by deposit buildup, flow restriction, or flow maldistribution.
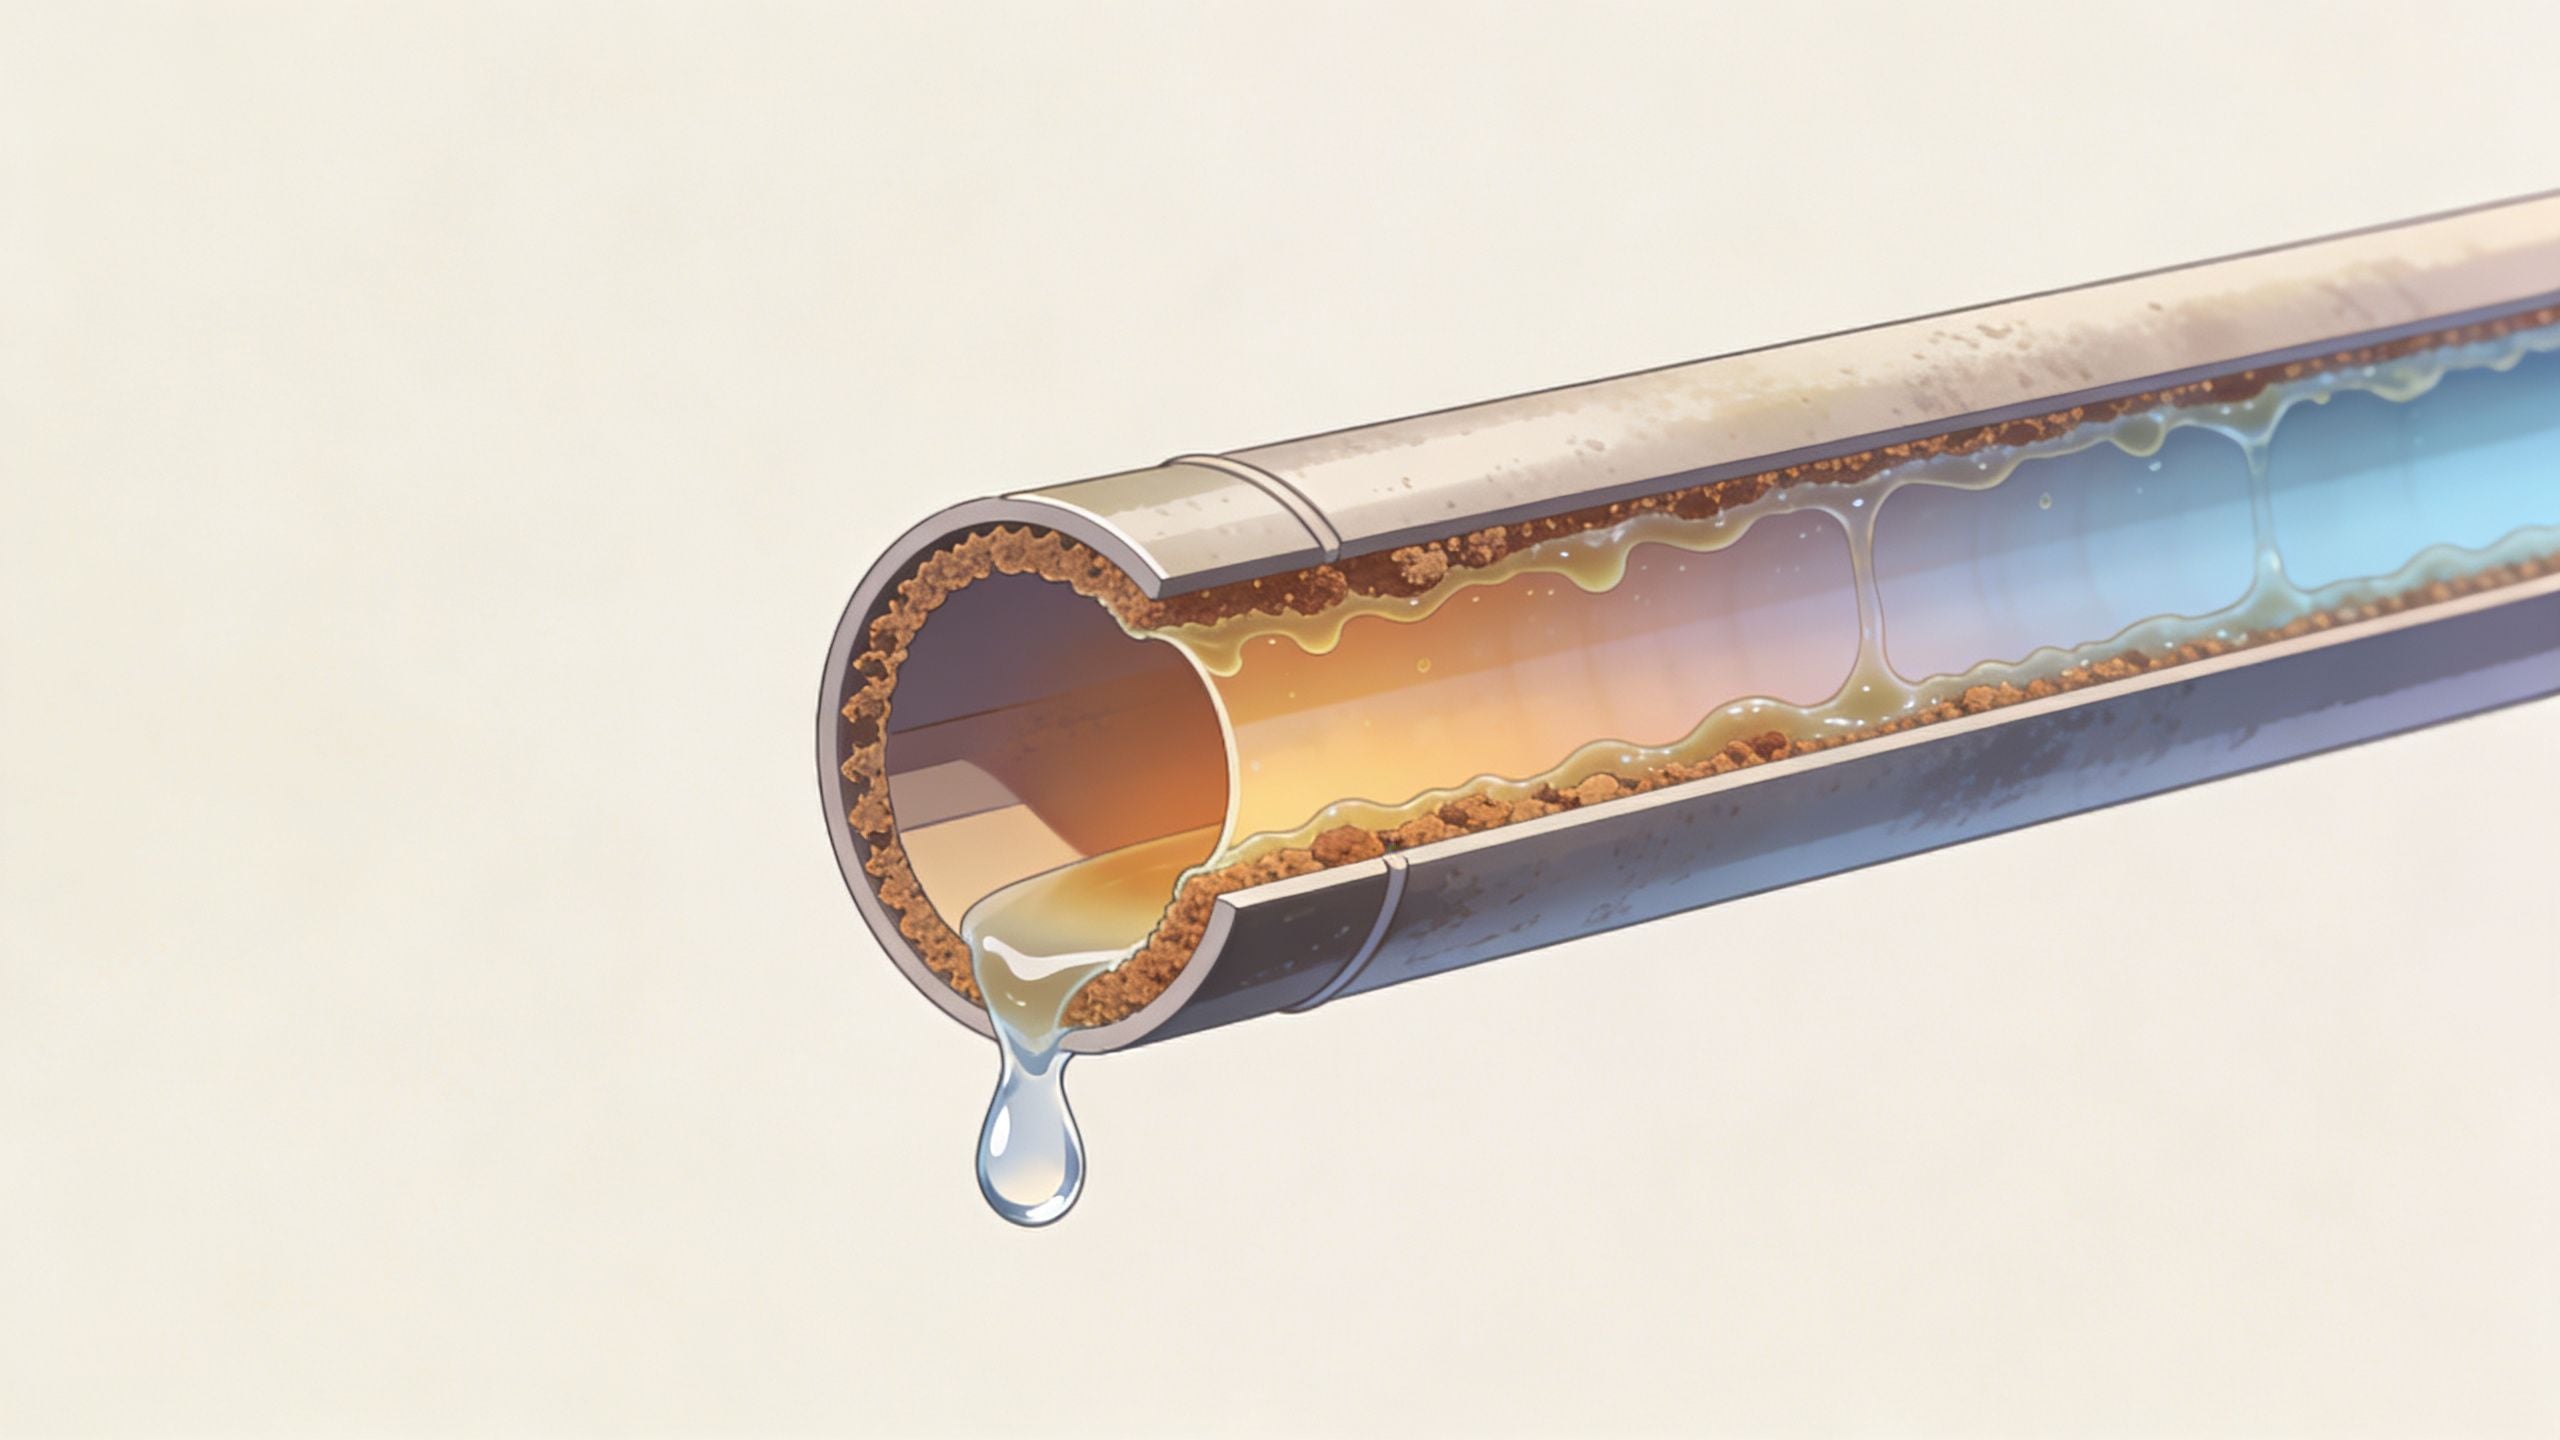
The tree usually branches into a few recurring causes: mineral scale, corrosion products, biological fouling, suspended solids, hydrocarbon or polymer film, poor distribution across the bundle, and cleaning that removes only the soft deposits while leaving the hard ones in place. Process change often sits high in the tree. A new water source, a seasonal shift in cooling-water temperature, a treatment chemistry upset, or a CIP change can push the exchanger into a different fouling regime without any visible hardware failure.
That distinction matters in practice. If the deposits are calcium-based scale, the corrective action is chemistry control and descaling. If the exchanger is plugging with upstream rust or solids, the answer is usually filtration, corrosion control, or piping remediation. If the bundle is clean in some lanes and dirty in others, distribution and velocity become the primary branch, not cleaning frequency.
A workable exchanger FTA needs more than work-order history. It needs process evidence that can prove or eliminate branches.
For a cooling-water exchanger, I would expect to review approach temperature trend, pressure drop across the bundle, inlet and outlet temperatures on both sides, recent water chemistry, and inspection photos from the last pull. For a pasteurizer or CIP-serviced unit, flow rate, wash temperature, concentration, and contact time belong in the tree because poor cleaning parameters can create the same top event as bad utility water. For closed-loop systems, slime growth and corrosion products often show up together, so conductivity, pH, inhibitor residual, and microbiological checks should be read as a set rather than in isolation.
The most useful checks are specific enough to guide action:
- Approach temperature trend: A rising approach temperature usually shows the thermal resistance branch developing before quality or throughput is hit.
- Differential pressure across the exchanger: Higher pressure drop supports deposit buildup or partial tube plugging. Normal pressure drop with poor heat transfer points more toward insulating film or bypassing.
- Chemistry review: Hardness, chlorides, pH, inhibitor residual, iron, suspended solids, and microbiological control help separate scale, corrosion fouling, and biological growth.
- Temperature profile and surface scan: Uneven shell, channel, or bundle temperatures can indicate maldistribution, dead zones, or blocked passes.
- Inspection findings after opening: Deposit color, texture, location, and adhesion often identify the active branch faster than trend data alone.
Minimal cut sets are often straightforward once the tree is built. Examples include poor water treatment plus increased tube wall temperature, failed side-stream filtration plus upstream corrosion release, or reduced CIP flow plus reduced wash temperature. Those combinations are what maintenance and operations can act on.
This section also ties directly to condition monitoring discipline. Plants that already use structured thermal and electrical monitoring on rotating and power assets usually have an easier time building evidence-based exchanger trees because the same mindset applies to process equipment. The method is similar to the checks used in condition monitoring for variable speed drives and VFDs. Trend the right indicators, define alarm limits, and verify the failure path before choosing the fix.
Cleaning interval is a maintenance response. It is not the root cause.
The trade-off is practical. More frequent cleaning can protect short-term production, but it also adds labor, outage time, tube damage risk, and chemical cost. If the tree shows the actual drivers are chemistry drift, poor distribution, missing filtration, or weak CIP parameters, fixing those branches usually gives a longer run length and more stable thermal performance than repeating the same cleaning plan.
7. VFD Power Stage Failure and Fleet Reliability Strategy
A drive trips on an afternoon shift, maintenance swaps a module, and production restarts before anyone asks the harder question. Why did three similar drives in the same area fail within a year? That is the point of building the fault tree at fleet level instead of stopping at a single cabinet.
For VFDs, the top event is usually defined as loss of output caused by DC bus or power stage failure. A useful tree then breaks that event into branches that technicians can verify in the field: capacitor aging, repeated thermal overload, cooling path restriction, input voltage distortion or imbalance, conductive contamination, and installation stress such as long motor leads or poor enclosure layout. On larger fleets, common-cause exposure matters more than the failed transistor or capacitor you can see on the bench.
Many teams underuse FTA in this scenario. They complete a failure report on one drive, replace parts, and close the work order. The stronger approach is to compare units by run hours, load profile, cabinet temperature history, alarm logs, location, and maintenance quality. That changes the question from "what failed?" to "what keeps shortening life across this group of assets?"
The diagnostic checks need to be specific enough to support maintenance decisions. For the DC bus branch, trend ripple voltage and look for year-over-year growth, repeated undervoltage trips, or bulging capacitor cans during outages. For the thermal branch, review heat sink temperature, fan current, blocked filters, and cabinet air inlet temperature. For contamination, inspect bus bars, control boards, and cooling passages for dust, oil film, or corrosive residue. For installation stress, verify motor cable length, grounding quality, output reactor or dv/dt protection where required, and enclosure heat load against the original design basis.
Minimal cut sets are often practical and actionable. Examples include failed cooling fan plus clogged filter, aged DC bus capacitors plus sustained high enclosure temperature, or long motor cable plus missing output protection under high switching stress. Those combinations are what drive replacement timing, spare module strategy, and cabinet retrofit scope.
I have seen plants save money by resisting blanket drive replacement. If the tree shows one area has the same overheating branch across multiple units, fixing ventilation and filter maintenance often buys more life than replacing drives on age alone. The opposite can also be true. If ripple is rising across an older population with similar service hours, planned capacitor or drive replacement can be cheaper than repeated nuisance trips and emergency callouts.
A workable fleet program does not require a massive analysis effort. It requires consistent evidence and a tree built around failure mechanisms that technicians can confirm.
- DC bus condition: Trend ripple, nuisance trip history, and any capacitor distress found during shutdown inspections.
- Thermal exposure: Record enclosure temperature, heat sink condition, fan health, and ambient conditions by location.
- Cooling path integrity: Check filters, airflow direction, blocked vents, and fouled heat sinks on a fixed route.
- Electrical stress: Review incoming voltage balance, harmonic environment, grounding, and motor lead length.
- Replacement priority: Rank by asset criticality, service age, thermal history, spare availability, and condition findings.
A chemical plant may find that repeated pump-drive faults share the same parent branch: poor cabinet cooling during summer peaks, followed by DC bus stress and intermittent trips. A packaging line may trace conveyor drive failures to contamination entering undersized enclosures during washdown cycles. In both cases, the fault tree connects the logic to measurable checks and then to action. Teams that want a stronger inspection route can use condition monitoring techniques for variable speed drives and VFDs to standardize what gets trended, what gets alarmed, and which drives move to the top of the intervention list.
Fault Tree Analysis, 7 Case Comparison
| Failure scenario | Implementation complexity | Resource requirements | Expected outcomes | Ideal use cases | Key advantages |
|---|---|---|---|---|---|
| Centrifugal Pump Failure Due to Cavitation | Moderate, requires fluid-dynamics/NPSH analysis and monitoring setup | Suction pressure/temp sensors, vibration/acoustic monitors, pump curves, engineering expertise | Early cavitation detection, reduced impeller damage, optimized maintenance intervals | Pumps in chemical, oil & gas, water treatment, food & beverage | Observable diagnostics, enables predictive maintenance, well‑documented mitigations |
| Rolling Element Bearing Spalling and Race Degradation | High, needs high‑frequency vibration analysis and skilled interpretation | HF accelerometers, envelope analysis software, oil analysis, alignment tools, trained analysts | Detect spalls weeks ahead, planned bearing replacement, lower unplanned downtime | Motors, fans, compressors, gearboxes across manufacturing and power sectors | Reliable CM integration, quantifiable defect frequencies, supports spare planning |
| Gearbox Oil Degradation and Gear Tooth Failure | Moderate, oil analysis plus FFT vibration expertise required | Oil lab, temp & vibration sensors, FFT tools, RUL models, sampling procedures | Optimize oil change intervals, reduce tooth wear, improve RUL and spare timing | Gearboxes in continuous processes: pulp & paper, mining, chemical, steel | Non‑destructive monitoring, actionable oil metrics, cost‑effective interventions |
| Motor Winding Insulation Degradation and Phase‑to‑Ground Fault | Moderate, combines electrical diagnostics, MCSA and thermography | Megohm/hi‑pot testers, MCSA tools, thermography, humidity control, skilled technicians | Early insulation degradation detection, planned rewinds/replacements, fewer ground faults | Motors in high‑humidity, washdown, vibration‑prone environments across industries | Simple trending (megohm), non‑invasive tests, links to facility mitigation |
| Compressor Capacity Control Valve Malfunction and Bypass Leakage | Low–Moderate, requires combined mechanical and energy‑trend analysis | Pressure/flow/power sensors, thermal imaging, oil analysis, valve service kits | Restore delivery pressure, improve energy efficiency, targeted valve service | Compressed air systems in food & beverage, pharma, chemical and manufacturing | Measurable energy signature, cost‑effective valve repair, clear diagnostics |
| Heat Exchanger Tube Fouling and Thermal Performance Degradation | Low–Moderate, trending and water‑chemistry analysis; modeling fouling rates | Temp/pressure sensors, water quality lab tests, cleaning equipment, treatment chemicals | Maintain heat transfer, scheduled cleaning, prevent process temperature excursions | Heat exchangers in petrochemical, power, food & beverage, pharmaceutical plants | Simple monitoring, reversible cleaning, clear intervention thresholds |
| VFD Power Stage Failure & Fleet Reliability Strategy | High, fleet analytics, DC‑bus ripple monitoring and life‑modeling needed | DC bus ripple monitors, enclosure temp sensors, spare capacitors, data platform | Reduced VFD failures, planned capacitor replacements, improved fleet MTBF | Sites with large VFD fleets (chemical, water, manufacturing, mining) | Low‑cost preventive replacements, fleet prioritization, prevents cascading damage |
Putting Analysis into Action Your Next Steps to Uptime
A pump trips at 2:00 a.m., production calls maintenance, and the first instinct is to replace the failed part and get the line running. Plants stay reactive when that cycle repeats. Fault tree analysis breaks it by forcing one disciplined question first. What exact combination of failures produced the top event that hurt uptime?
The seven examples in this article show why that question matters. A useful tree does more than map causes on paper. It ties a failure mode to checks a team can perform, such as vane-pass vibration, bearing defect frequencies, ISO cleanliness codes, moisture limits, insulation resistance trend, bypass leakage evidence, approach-temperature drift, or DC-bus ripple. Once those checks are attached to the logic, the tree stops being an academic exercise and becomes a work order filter, an inspection plan, and in some cases a capital justification.
Top-event definition decides whether the analysis helps or wastes time. "Pump failure" is too broad. "Cavitation damage causing loss of head" is specific enough to test. The same rule applies across the cases covered here. Race spalling, oil-driven gear distress, phase-to-ground fault, control valve leakage, thermal performance loss, and power-stage failure all give the team a physical event to confirm or rule out with evidence.
That precision changes decisions.
A maintenance supervisor can tighten PM scope around the few inspection points that separate dominant branches. A reliability engineer can identify the minimal cut sets that deserve redesign, not another round of parts replacement. An operations manager can see which process conditions, such as low NPSH margin, poor contamination control, cooling air blockage, or chronic low-load operation, are feeding repeat failures that maintenance alone cannot fix.
Condition data is what makes the tree actionable. Vibration distinguishes looseness from hydraulic instability and bearing distress from gear mesh problems. Oil analysis shows whether a gearbox branch is driven by wear debris, water ingress, additive depletion, or oxidation. Thermography and electrical testing confirm hot connections, insulation deterioration, blocked cooling paths, and uneven exchanger performance. Without those checks, FTA remains qualitative. With them, teams can rank branches by evidence, not opinion.
FTA also earns its keep when it is connected to the rest of the reliability workflow. Failure modes and effects analysis lists what can fail. Reliability-centered maintenance helps choose the maintenance task that fits the consequence and failure pattern. Life data analysis estimates when age-related failures start to rise. Fault tree analysis answers a different question. Which combinations of events are most likely to produce the plant-level failure that matters, and which of those combinations can be interrupted at the lowest cost?
That is the practical trade-off. The best corrective action is not always the most elegant technical fix. On one asset, better contamination control and tighter oil sampling may remove the dominant cut set for a fraction of the cost of a gearbox redesign. On another, repeated electrical failures may justify a change in enclosure standard, cooling arrangement, or harmonic control because inspection alone will only catch the problem late. Good FTA makes those choices visible before budget gets spent in the wrong place.
Used well, the method changes uptime because it connects symptoms, failure logic, diagnostics, and action in one chain. Teams stop treating every repeat failure as a new surprise. They start seeing patterns, proving dominant branches, and intervening earlier.
Take control of your facility's reliability. Contact Forge Reliability today to schedule a no-cost, no-obligation reliability assessment with one of our plant-floor specialists.
Forge Reliability helps industrial teams turn recurring failures into clear reliability actions. If critical pumps, motors, gearboxes, compressors, VFDs, or process systems keep falling back into reactive repair, a free reliability assessment can identify the likely failure paths, the right diagnostic methods, and the highest-value corrective actions for the assets that matter most.