The pressure usually shows up in the same sequence. Finance asks for lower maintenance spend. Operations asks why the line keeps stopping. Maintenance gets squeezed in the middle and starts delaying work that doesn't look urgent. For a few weeks, the numbers look better. Then a pump seal fails, a motor runs hot, a gearbox contaminates its oil, and the plant pays for the “savings” in overtime, expediting, scrap, and lost throughput.
That's why maintenance cost reduction has to be treated as a reliability problem, not a budgeting exercise. The plants that lower cost sustainably don't start by cutting labor or deleting work orders blindly. They start by finding waste, tightening planning, matching maintenance methods to actual failure modes, and fixing the data and spare-parts decisions that keep reactive work alive.
A typical example is a packaging line with multiple motors, reducers, conveyors, and pneumatic systems. If the team only tracks total monthly spend, every maintenance action looks like a cost. If the team tracks chronic failures by asset, parts usage, and production consequence, the picture changes fast. The expensive issue usually isn't the planned work. It's the repeated failure that keeps pulling technicians away from planned work.
Table of Contents
- The True Cost of a Reactive Maintenance Culture
- Establish Your Baseline and Find Early Wins
- Map Failure Modes to Predictive Technologies
- Optimize Intervals with RCM and FMEA
- Refine Your CMMS and Spare Parts Strategy
- Measure ROI and Scale Your Reliability Program
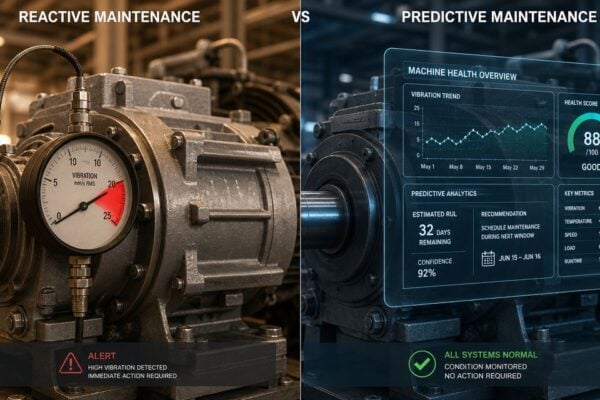
The True Cost of a Reactive Maintenance Culture
A reactive plant rarely looks reactive on paper. The weekly schedule may still show preventive work. The storeroom may still issue standard parts. But the underlying pattern is easy to spot on the floor. Technicians get pulled off planned jobs. Planners rebuild the schedule every day. Supervisors approve rush work because the asset is already down.
The damage isn't limited to repair labor. A failed bearing on a critical process pump can also damage the shaft, mechanical seal, coupling, and adjacent equipment. An overheated motor in a dusty environment can increase safety exposure while also threatening production. A compressor trip can trigger process instability well beyond the compressor itself.
A peer-reviewed analysis discussed by NIST estimated total annual maintenance-related costs and losses at about $222.0 billion, and found that manufacturers relying less on reactive maintenance spent 81.7% more on direct maintenance costs but had 51.8% less additional cost from faults and failures, 52.7% less unplanned downtime, and 78.5% fewer defects (NIST summary of maintenance cost and loss findings). That's the core trade-off plant leaders have to understand. Lower direct maintenance spend can still mean higher total operating cost.
What reactive maintenance hides
Three cost buckets usually get ignored when plants focus only on the maintenance budget:
- Production loss: Downtime usually costs more than the repair itself, especially on bottleneck assets such as fillers, air compressors, boiler feed pumps, and line-drive motors.
- Secondary damage: A missed lubrication problem can become a bearing replacement, then a shaft repair, then a full rebuild.
- Planning disruption: Every emergency job displaces scheduled work, which creates the next wave of emergencies.
Reactive maintenance doesn't stay contained to one asset. It spreads through the schedule, the storeroom, and the production plan.
A plant manager looking for a disciplined way to discuss these trade-offs internally should start with a reliability-focused maintenance budgeting approach. Budget pressure is real, but deferring the wrong work shifts cost into more expensive categories.
What actually reduces cost
Sustainable maintenance cost reduction comes from eliminating waste and controlling failure consequences. That usually means better planning, fewer low-value PM tasks, sharper asset prioritization, more effective condition monitoring, and stronger spare-parts governance. It does not mean treating every PM hour as overhead that needs to be trimmed.
A food plant with recurring conveyor drive failures is a good example. If the team keeps replacing failed bearings after breakdown, the plant pays repeatedly in labor, lost output, and cleanup. If the team identifies contamination and misalignment as the actual failure modes, changes the task mix, and stages the right spares, the repair count drops and the schedule stabilizes. Cost falls because failure demand falls.
Establish Your Baseline and Find Early Wins
Most plants already have enough data to find early savings. The problem is that the data sits in the CMMS as closed work orders, inconsistent failure notes, and PM routines nobody has challenged in years. Before changing strategy, the team needs a baseline that shows where labor, parts, and downtime are really going.

Start with work order history, not assumptions
A Pareto analysis is one of the fastest ways to expose waste. In plain terms, it means sorting maintenance history so the worst cost drivers show up first. That should be done by asset, failure mode, labor hours, parts consumed, and repeat event count.
On a beverage packaging line, that might reveal that a small group of conveyor drives, case packer motors, and compressed air leaks consume a disproportionate share of work orders. Those aren't always the most expensive assets. They're often the assets that fail often enough to absorb planner time, technician availability, and rush parts.
A practical baseline review should answer these questions:
- Which assets generate the most repeat corrective work?
- Which PM tasks repeatedly find nothing useful?
- Which failures create the most schedule disruption?
- Which jobs require unplanned parts purchases or expedited shipping?
- Which assets have weak failure coding or poor history, making decisions harder than they need to be?
Teams building this review into a broader rollout often benefit from a 12-month reliability program roadmap so the early wins don't get separated from longer-term reliability work.
Measure wrench time and PM value
Wrench time means the share of a technician's day spent performing maintenance work, rather than walking, waiting, searching for parts, getting permits, or clarifying scope. Field experience summarized by Reliability Academy notes that wrench time is often around 30%, and with strong planning and scheduling it can rise to about 45%, which is roughly a 35% productivity gain. The same source says 40% to 60% of PM tasks may add little value, and removing that waste can cut the maintenance workload by about 20% or more without hurting reliability (Reliability Academy on wrench time and PM task value).
That finding matters because many plants chase cost reduction by freezing hiring or delaying overtime approval, when the first gains are often available inside existing labor hours.
Practical rule: Don't cut PM volume until each task is tied to a known failure mode, a useful inspection, or a clear compliance requirement.
A useful PM review doesn't ask whether a task has always been done. It asks whether the task prevents a specific failure. For example:
- Monthly motor inspection: Valuable if it checks for overheating, contamination, or looseness that the team has observed.
- Calendar-based gearbox oil change: Questionable if oil analysis shows the lubricant remains healthy and contamination is controlled.
- Frequent bearing greasing: Risky if it's done by habit and over-lubrication has already caused failures.
Where early wins usually appear
Early wins tend to come from a combination of process and content fixes:
- Planner discipline: Better job scope, parts staging, and schedule control increase labor effectiveness before any technology is added.
- PM cleanup: Remove duplicate inspections, merge low-value tasks, and rewrite vague PMs into failure-based checks.
- Bad actor focus: Assign engineering time to assets with repeated breakdown patterns, not to the entire equipment population at once.
A food processing plant with recurring pump and gearbox issues often finds that low-value calendar PMs are crowding out targeted work on lubrication contamination, coupling alignment, and seal leakage. The labor was already there. It just wasn't aimed at the right failure mechanisms.
Map Failure Modes to Predictive Technologies
A plant installs wireless sensors on every critical motor, then still loses production because the failure that stopped the line started as lubricant contamination in a gearbox and a loose electrical termination in the MCC. The technology was not wrong. The coverage was incomplete, and the response process was unclear.

Predictive maintenance cuts cost only when each method is tied to a specific failure mode, a decision threshold, and a work process that turns findings into planned action. Plants that start with sensors alone usually end up with one of two problems. They either monitor too much low-consequence equipment, or they collect alerts that never become scheduled work because parts, labor, and outage windows were never defined.
Criticality drives the monitoring plan
The first question is not which technology to buy. It is which failure would hurt the plant most.
Asset criticality ranking sorts equipment by consequence of failure across safety, throughput, quality, environmental exposure, repair cost, and lead time for replacement. That matters because a standby utility pump and a single-point-of-failure process pump do not need the same monitoring depth. The same goes for a standard motor that can be changed in hours versus a large gearbox with long rebuild lead times and expensive internal damage if the fault runs unchecked.
A practical sequence works well in most plants: rank the assets, define the dominant failure modes, assign the right diagnostic method, set alarm and response criteria, then route findings into the CMMS so planners can stage labor and parts. Plants evaluating rotating equipment coverage can use predictive maintenance vibration monitoring equipment guidance to match machine criticality, accessibility, and fault risk to the right monitoring approach.
Predictive Maintenance Technology Selection Guide
| Technology | Detects Failure Modes | Common Applications | Primary Benefit |
|---|---|---|---|
| Vibration analysis | Imbalance, misalignment, looseness, rolling element bearing defects | Pumps, motors, fans, compressors, gearboxes | Finds mechanical defects early enough to plan repair before they trigger secondary damage |
| Thermography | Electrical hot spots, overloaded connections, friction heat, insulation issues | MCCs, switchgear, motor terminations, bearings, process heaters | Identifies heat-related deterioration without taking equipment offline |
| Oil analysis | Wear debris, contamination, lubricant degradation | Gearboxes, hydraulic systems, circulating oil systems, large bearings | Shows internal wear and lubricant condition before damage is visible externally |
| Ultrasound | Air and gas leaks, steam leaks, arcing, poor lubrication conditions | Compressed air systems, steam systems, electrical cabinets, bearings | Finds energy loss and early fault activity that route inspections often miss |
| Motor current signature analysis | Rotor bar problems and electrical defects in motors | Critical motors and motor-driven systems | Detects internal motor issues that mechanical testing alone may not reveal |
One asset often needs more than one method
Single-tool programs leave blind spots. Rotating assets fail through mechanical, electrical, and lubrication paths, and the cost of missing one path often shows up later in spare parts spend and outage duration.
Consider a chemical plant with a critical process pump train. Vibration analysis may catch bearing damage or coupling misalignment on the pump and motor. Thermography may find a heating termination in the motor control center before it trips under load. Oil analysis may show contamination and wear inside a connected gearbox before the unit sheds debris into the system. Ultrasound may identify an air leak on a valve actuator that is causing unstable control and process upsets.
That is the integrated system many plants miss. PdM is not only a condition monitoring program. It also shapes how planners prepare work, which spare parts the storeroom must hold, and which long-lead components deserve closer lifecycle attention.
Matching technology to failure mode reduces two expensive mistakes: buying coverage that does not answer a real failure question, and missing early warnings on assets with high production or repair consequence.
The response plan matters as much as the sensor
Detection alone does not reduce maintenance cost. Response does.
If an analyst finds rising bearing frequencies on a cooling water pump, the plant should already know who validates the alert, what inspection confirms it, whether a bearing kit or complete cartridge is stocked, and whether the repair can wait for the next scheduled outage. If those decisions are still being debated after the alert, the plant will lose part of the value of early detection. In some cases it loses all of it.
Spare parts strategy and lifecycle risk connect to predictive work at this intersection. There is little value in identifying a degrading gearbox six weeks early if the replacement has a twenty-week lead time and no repair path was defined. In that case, the monitoring program should trigger a different decision tree: load reduction, lubrication control, temporary inspection frequency changes, repair booking, or contingency planning for a controlled outage.
Some plants build that capability internally. Others use outside support such as Forge Reliability's reliability services for vibration, thermography, oil analysis, ultrasound, and motor testing when internal coverage is thin. The source of the data matters less than the discipline behind it. The plant needs clear ownership, defined thresholds, stocked or planned parts, and CMMS workflows that convert findings into scheduled work orders instead of another report in a shared folder.
Optimize Intervals with RCM and FMEA
A lot of unnecessary maintenance survives because nobody has challenged the interval logic. The task exists, the calendar triggers it, and the craft executes it. That's how plants end up overhauling healthy components too early while still missing the failures that matter most.
What FMEA and RCM mean on the plant floor
FMEA, or Failure Modes and Effects Analysis, is a structured review of how an asset can fail, what causes that failure, and what the consequence is. RCM, or Reliability-Centered Maintenance, uses that understanding to decide the most appropriate maintenance strategy for each failure mode.
In practical terms, FMEA asks questions such as these for a boiler feed pump, hydraulic power unit, or induced draft fan:
- What functional failure matters?
- What physical failure modes cause it?
- Can the failure be detected before it becomes functional?
- Is there a maintenance task that is technically feasible and worth doing?
- If not, does the plant redesign, run to failure, or accept the risk?
Many maintenance cost reduction discussions ignore the risk of blindly cutting PMs. Deferred maintenance can escalate repair expense dramatically as failure propagates, so interval changes should be based on failure modes and lifecycle cost rather than simple budget pressure.
A team formalizing that decision process can use a reliability-centered maintenance implementation guide to move from calendar-based routines to risk-based maintenance logic.
A PM interval is only defensible if the plant can explain which failure mode it addresses and why that timing makes sense.
A practical interval decision
Take an auxiliary pump in a power-generation setting. The legacy PM might call for a full time-based overhaul at a fixed interval because “that's how it has always been done.” An FMEA often shows that not all dominant failure modes are age-related. Some are contamination-driven, some are alignment-related, and some are detectable through condition change.
That changes the maintenance strategy:
- The team may keep a visual inspection and alignment verification after disturbance.
- It may move bearing and lubrication condition into vibration and oil analysis.
- It may reserve overhaul for evidence of deterioration rather than the calendar alone.
This isn't a theoretical distinction. It affects labor loading, outage scope, parts consumption, and risk. On rotating equipment, over-maintenance can introduce infant mortality through reassembly errors, contamination, incorrect fits, and disturbed alignment. Under-maintenance creates a different problem. The failure progresses until the repair scope expands.
A process plant applying RCM correctly doesn't ask whether PMs should be reduced across the board. It asks which tasks are worth preserving, which should be replaced by condition monitoring, and which need redesign because no maintenance task will control the failure effectively.
Refine Your CMMS and Spare Parts Strategy
A plant can do solid failure analysis and still lose money because the CMMS is unreliable and the storeroom is unmanaged. That's common. Teams identify a developing bearing fault correctly, then discover the part number is wrong, the BOM is incomplete, the spare is obsolete, or the same component exists under several duplicate stock codes.
Clean data changes maintenance decisions
The CMMS should do more than store work orders. It should provide a usable asset hierarchy, accurate equipment naming, consistent failure coding, and complete bills of material for critical assets. Without that, labor planning becomes guesswork and reliability analysis turns into manual investigation.
Spare-parts economics are often underexplained in maintenance cost reduction conversations. Inventory optimization can significantly reduce maintenance spend, but it depends on disciplined parts classification, criticality ranking, and CMMS accuracy so the plant avoids both stockouts of critical parts and the hidden carrying costs of duplicate or obsolete SKUs.
A mining operation is a useful example. Hydraulic filters, seals, and hose assemblies often accumulate duplicate item records when multiple buyers, vendors, or naming conventions exist. That drives excess stock and hides actual usage patterns. Once the team cleans the master data and standardizes descriptions, the plant can see what it really consumes and where interchangeability is possible.
Build a criticality-driven spare parts policy
Not every spare belongs on the shelf, and not every stockout is acceptable. The right policy depends on asset consequence, lead time, replacement complexity, and demand pattern.
A practical classification looks like this:
- Critical spares: Parts that protect uptime or safety on high-consequence assets, such as key pump bearings, seal kits, or motor components with long lead times.
- Insurance spares: Low-use items with severe consequence if unavailable, often kept because procurement delay would expose the plant to unacceptable risk.
- Consumables: Predictable-use items such as filters, standard belts, and common lubrication supplies.
- Nonessential stock: Obsolete or rarely justified parts that tie up cash without supporting plant reliability.
The storeroom is part of the reliability system. If the plant can't trust part identity, stocking policy, or lead time assumptions, planned maintenance turns reactive again.
The CMMS should connect each critical asset to the parts needed for known failure modes. A clean CMMS implementation guide for maintenance teams helps build that link so planners can stage the right material before a condition-based repair window arrives.
For assets like slurry pumps, cooling tower gearboxes, or large process motors, this connection between diagnostics and logistics is where maintenance cost reduction becomes real. A vibration route that identifies a problem early only creates financial value if the parts, labor, and schedule can be organized before the asset fails in service.
Measure ROI and Scale Your Reliability Program
Leadership usually supports reliability work when the plant shows its value in operating terms. That means fewer surprises, steadier production, and a maintenance strategy that spends money where failure risk justifies it. The plant doesn't need a complicated financial model to start. It needs a small group of indicators that connect asset health to business performance.
Use KPIs that connect reliability to money
Three measures are especially useful:
- Maintenance cost as a percentage of replacement asset value: This helps show whether maintenance spend is stable relative to the asset base.
- PM and PdM compliance: If planned work isn't being completed, the program can't be judged fairly.
- Mean time between failures: This shows whether the plant is reducing repeat failure demand on critical assets.
For ROI discussions, the baseline argument is already strong. A foundational U.S. Department of Energy benchmark, summarized in industry reporting, found that predictive maintenance can reduce maintenance costs by 30% to 40% versus reactive maintenance. A separate PwC study found that PdM decreased costs by 12% and improved availability by 9% (industry summary of DOE and PwC predictive maintenance benchmarks). Those figures give plant leaders a credible reference point for why predictive and condition-based methods belong in a cost reduction plan.
A practical ROI calculation uses avoided cost categories such as emergency labor, repeat failures, quality loss, production interruption, and unnecessary time-based work that condition data replaces. It should stay grounded in the plant's own history. If a critical motor-driven pump fails repeatedly, avoided repeat events provide a better business case than broad claims about digital transformation.
Scale what the plant can sustain
The strongest reliability programs usually scale in layers. They start with bad actors and critical assets. They standardize work identification and response rules. Then they extend the model to adjacent systems.
A manufacturing plant with chronic gearbox and motor failures might scale in this order:
- Clean up failure coding and PM content on the most troublesome line.
- Add route-based monitoring where the failure consequence is highest.
- Improve spare-parts accuracy for the same equipment family.
- Review intervals with FMEA and RCM logic.
- Expand only after the team can sustain data review, planning, and corrective action.
Reliability programs fail when the plant scales data collection faster than it scales decision-making.
The objective isn't to create more reports. It's to create fewer emergency jobs, fewer repeat defects, and a maintenance workload that stays planned. That's what long-term maintenance cost reduction looks like on the floor.
Forge Reliability helps industrial teams build that kind of roadmap through predictive maintenance, condition monitoring, reliability consulting, CMMS data governance, and spare-parts optimization. For plants that need a practical starting point, a free reliability assessment from Forge Reliability can identify critical assets, likely failure modes, and the highest-value actions to reduce maintenance cost without increasing plant risk.