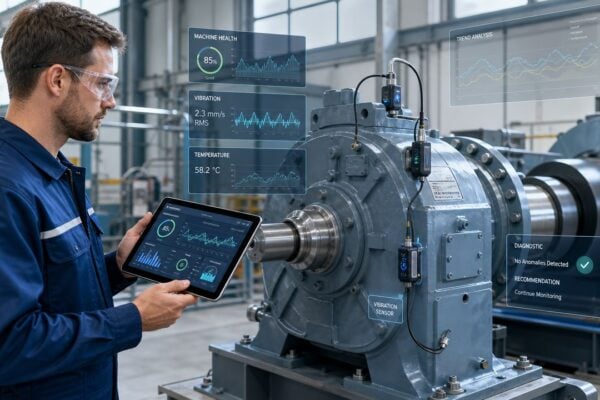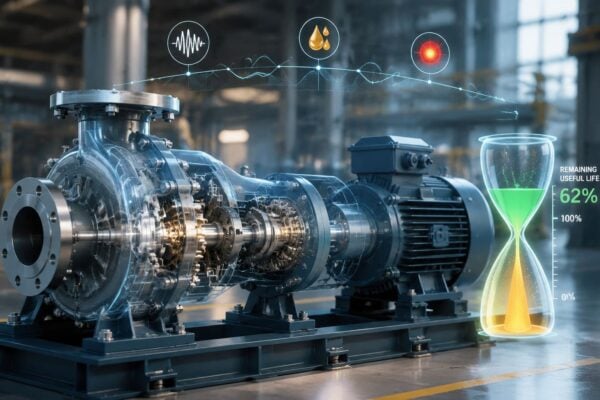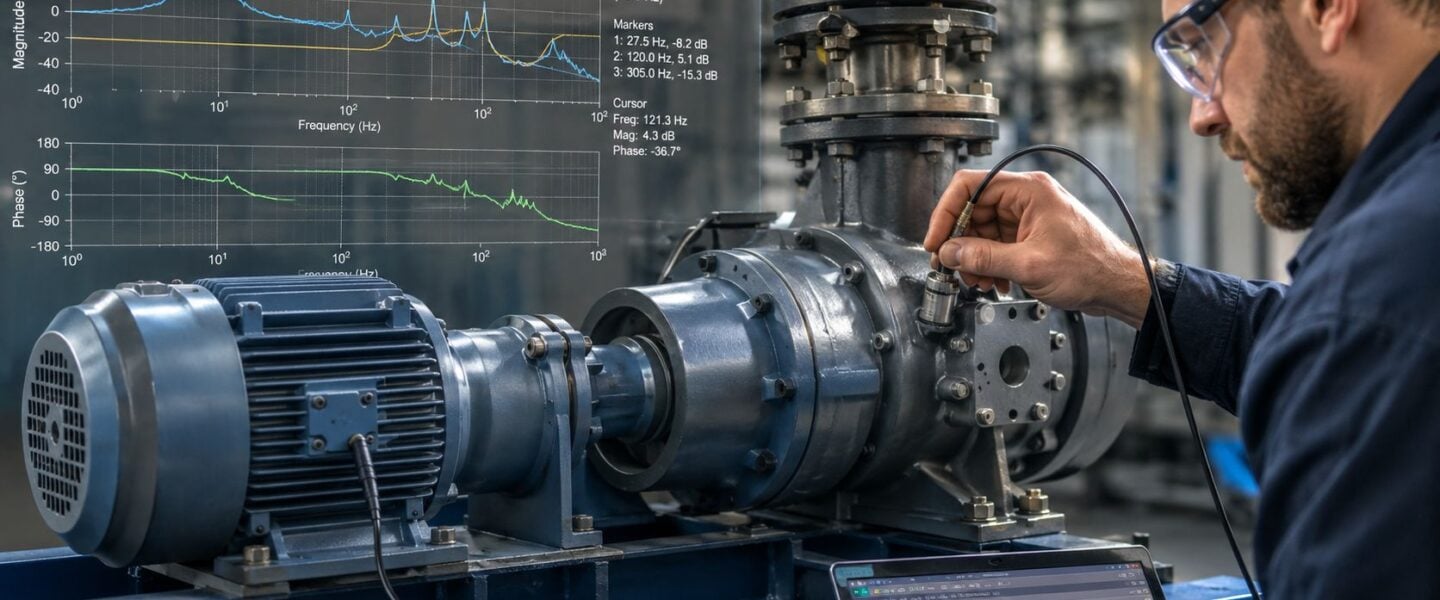
A compressor that trips on high vibration every few shifts, then runs normally after inspection, can eat up a maintenance team's time fast. Bearings look acceptable, alignment checks don't change the story, balancing doesn't stick, and the same alarm comes back after the next startup. That kind of problem is where frequency response analysis earns its keep, because the issue may not be a simple defect at all, it may be the way the machine and its structure respond to excitation.
Table of Contents
- Introduction The Diagnostic Power of FRA
- What Is Frequency Response Analysis Core Concepts
- The FRA Testing Process and Instrumentation
- Interpreting FRA Signatures for Failure Diagnosis
- Real-World FRA Case Studies in Industrial Assets
- Best Practices for High-Confidence FRA Results
- Integrating FRA into Your Predictive Maintenance Program
Introduction The Diagnostic Power of FRA
A reliability team can chase the same vibration alarm for weeks and still miss the root cause if the equipment is responding to a structural or modal issue instead of a classic rotating defect. In those cases, the machine may look healthy in a bearing inspection, a coupling check, or a balance correction, yet the operating environment still pushes it into a resonant condition. Frequency response analysis helps by showing how the asset behaves across frequency, not just how hard it shakes at one operating point.
In engineering terms, FRA excites a system with sinusoidal inputs across a sweep of frequencies and measures the complex output response as magnitude and phase, usually on a Bode plot. That is the standard way to extract transfer function behavior, bandwidth, and resonance information for linear systems, according to solver guidance on frequency response analysis. For structural and rotating-equipment work, the output is often displacement, velocity, acceleration, force, stress, or strain, and damping can shift the phase even when the response stays at the same driving frequency. That matters when a structure or machine support is living too close to resonance, because small changes in stiffness, mass, or boundary condition can alter the operating signature enough to hide a developing problem.
That is why FRA is so useful on a noisy pump skid, a fan foundation, or a transformer with a suspicious baseline shift. It turns a vague vibration complaint into a dynamic fingerprint. It also gives the maintenance team a more defensible answer to a hard question, whether the peak is a true fault or whether the model behind the expected response is too idealized for field conditions.
Practical rule: when the same machine keeps failing and routine checks keep clearing it, the structure around the machine deserves the same level of suspicion as the machine itself.
A good diagnostic review also depends on how the asset sits in the plant, which is why understanding the duty area, adjacent equipment, and measurement points matters. For teams that manage many assets across different lines or buildings, a territory-style review of where the problems cluster can help prioritize field time, much like OnRoute's territory management advice helps organize coverage in other operational settings. If you need the modeling side to support that review, modal analysis fundamentals for reliability engineers gives the next layer of context for separating structural behavior from simple rotating faults.
What Is Frequency Response Analysis Core Concepts
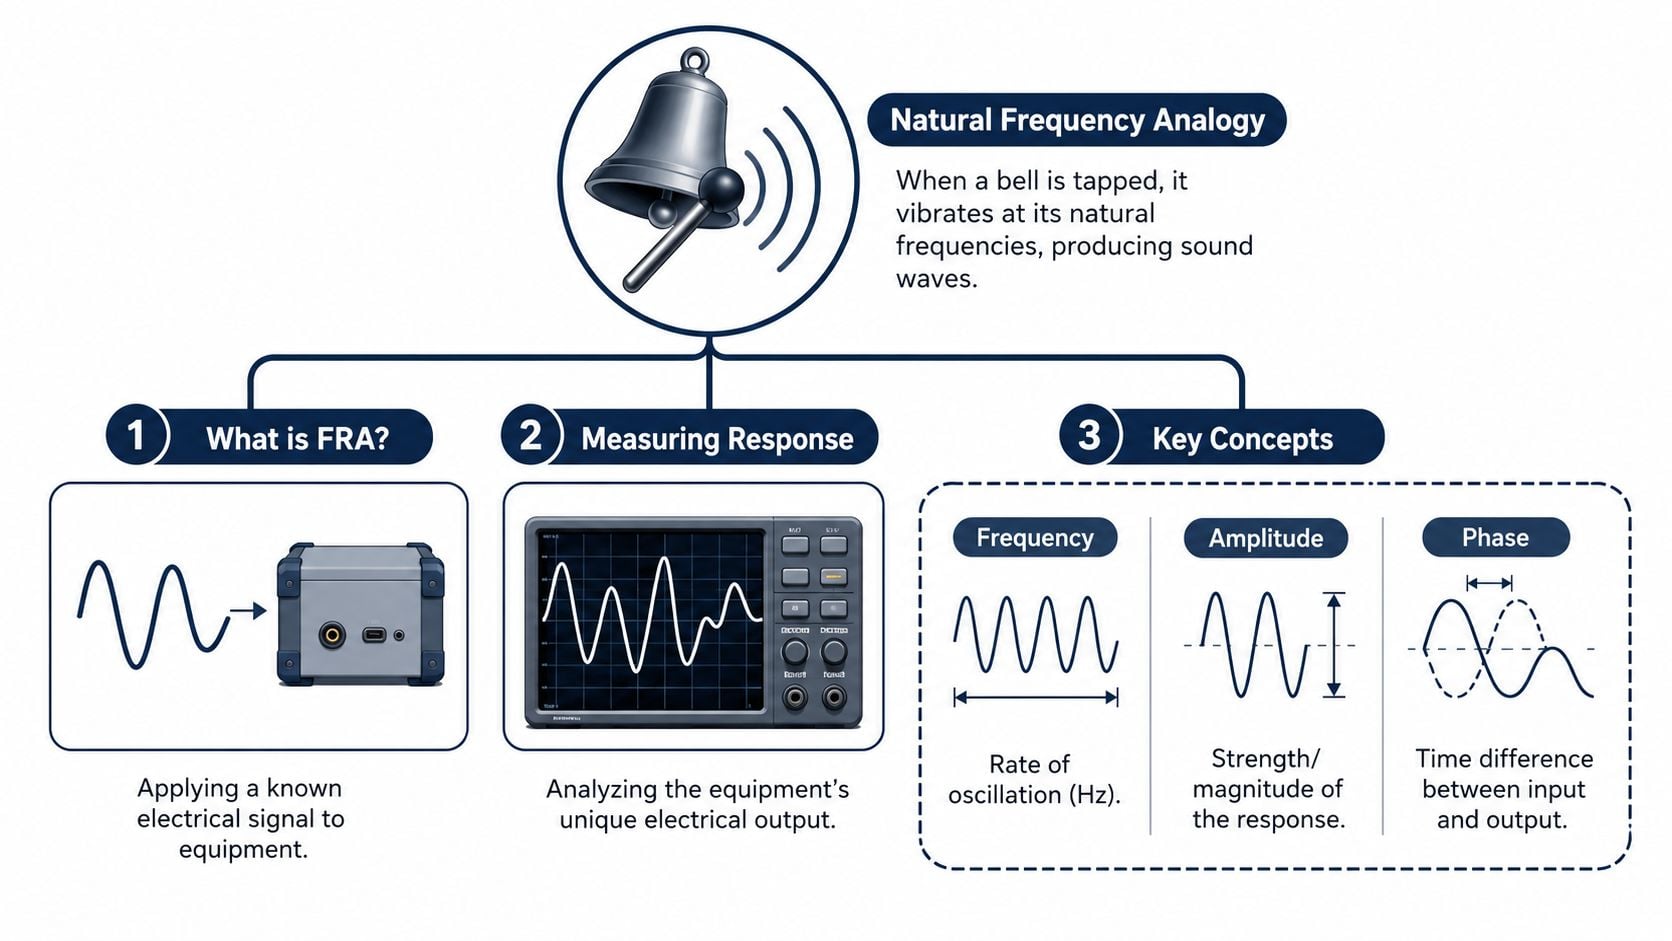
The simplest way to understand frequency response analysis is to think about a bell or a wine glass. Tap it lightly and it rings at a tone that belongs to its shape, mass, and stiffness. Industrial equipment does the same thing, except the “tap” can be a shaker, an impact hammer, a force pulse, or even operating excitation, and the response can be measured in terms that tell a plant engineer where the energy goes.
The FRF as a fingerprint
The core output is the frequency response function, or FRF. In frequency-response measurement practice, the FRF is defined as the dynamic response divided by the input force in the frequency domain, so it tells how much a system amplifies or attenuates excitation at each frequency (Portland State University thesis). That makes it a direct fingerprint for modal testing, because the response is normalized by force and resonances stand out clearly.
For a pump-motor base, that means the plot can show where the structure flexes, where a support frame amplifies motion, and where damping flattens a peak. For a transformer, the same idea helps compare a current trace to a baseline response and look for a shifted dynamic signature. The key point is simple, the FRF does not just say “vibration exists,” it shows how the asset reacts to specific frequency content.
A healthy asset usually has a repeatable pattern. When the pattern moves, stretches, or loses peaks, the structure or mechanical assembly has changed.
Bode plots and transfer functions
A Bode plot shows magnitude and phase versus frequency, which makes it useful for seeing both amplification and timing delay in one set of curves. Engineers use it because a system can respond at the same frequency as the input while still shifting phase due to damping and stiffness effects. That phase shift is often the clue that separates a simple vibration complaint from a resonance-driven reliability risk.
Transfer function is the broader concept behind the plot. In practical terms, it describes how input becomes output across frequency. On a conveyor drive frame, a motor support, or a transformer winding, that transfer behavior can reveal whether the asset is acting stiff, flexible, underdamped, or poorly constrained.
For engineers who need a broader modal context, the relationship between FRA and modal work is especially important, and the conceptual overlap is explained well in modal analysis fundamentals. That connection matters because FRA often becomes the measurement method that feeds the modal interpretation.
What the plot is really telling maintenance teams
A frequency plot is not just a graph for analysts. It answers practical questions the plant feels immediately, such as whether a peak is likely to be aggravated by startup speed, whether a support frame is too soft, or whether a change in damping has made the same machine less tolerant of operating variation. That is why a strong interpretation depends on knowing the equipment's duty cycle, not just the curve shape.
Maintenance leaders also need to know that FRA and condition review are different tools. A route-based team may see vibration levels rising, but FRA helps explain why. It is the difference between measuring a symptom and understanding the dynamic mechanism that created it.
The FRA Testing Process and Instrumentation
A solid FRA test begins with a practical question, what exact dynamic behavior is being measured. On a large pump-motor skid, that may mean checking whether the baseplate, grout, anchor pattern, or connected piping is changing the response near a suspicious operating band. The workflow matters because a clean excitation with poor sensor placement still gives a misleading answer.
A good test plan starts with the asset in its real installation state. Shop-floor data can be useful, but once the machine is bolted down, tied into piping, and exposed to process loads, the boundary conditions change and the response often changes with them.
Excite the right structure, not just any point
FRA typically uses a controlled input, such as a modal shaker or impact hammer, and the structure's response is captured with accelerometers and a data acquisition system. In structural analysis guidance, the method evaluates steady-state response in the frequency domain rather than marching through time, and practical sweeps scan a user-defined frequency range to find resonant amplification and load-sensitive behavior in equipment or structures.
For a pump skid, the excitation point is chosen so the dominant support and frame paths are loaded. A sensor on a flexible edge plate will tell a different story from a sensor on a bearing housing or a centerline mounting pad. If the machine has piping attached, the piping restraints may need attention too, because the system response often belongs to the whole assembly, not only the rotating element.
The basic field sequence usually looks like this:
- Define the question first. Decide whether the concern is resonance, a loosened mount, a foundation issue, or a comparison against a known baseline.
- Choose the excitation method. Use an impact hammer for quick field checks, or a shaker when the structure needs a more controlled sweep.
- Place response sensors carefully. Put accelerometers where the suspected mode shape is likely to show movement, not just where access is convenient.
- Set the sweep range around the operating concern. A broad sweep can be useful, but the range still needs to match the asset's likely dynamic behavior.
- Check signal quality before trusting the plot. Poor coupling, loose cables, or a bad trigger can make a clean-looking trace that means very little.
Instrumentation has to match the plant problem
For rotating equipment, FRF-style data is often most useful when the measurement path matches the structure that carries the load. That is why a drive motor, its base, the connected pump, and even the surrounding steel can all matter. The acquisition system has to keep the excitation and response synchronized, because the output is only useful if the phase relationship stays meaningful.
Plant teams that already rely on vibration work often pair FRA with broader inspection capability, and the practical tool selection logic overlaps with vibration analysis tools guidance. That kind of planning helps a team decide whether the question needs a route check, a detailed test, or a one-time field study.
Field confidence also depends on how well the setup mirrors the machine's actual load path. A test fixture can look correct on paper and still miss the boundary condition that matters in service. When that happens, the plot may be technically tidy but not useful for maintenance decisions.
Teams that build this skill internally also need repeatable interpretation habits. AI applications for training can help standardize how technicians review plots, compare baselines, and spot setup errors before the data gets used in a work order.
Interpreting FRA Signatures for Failure Diagnosis
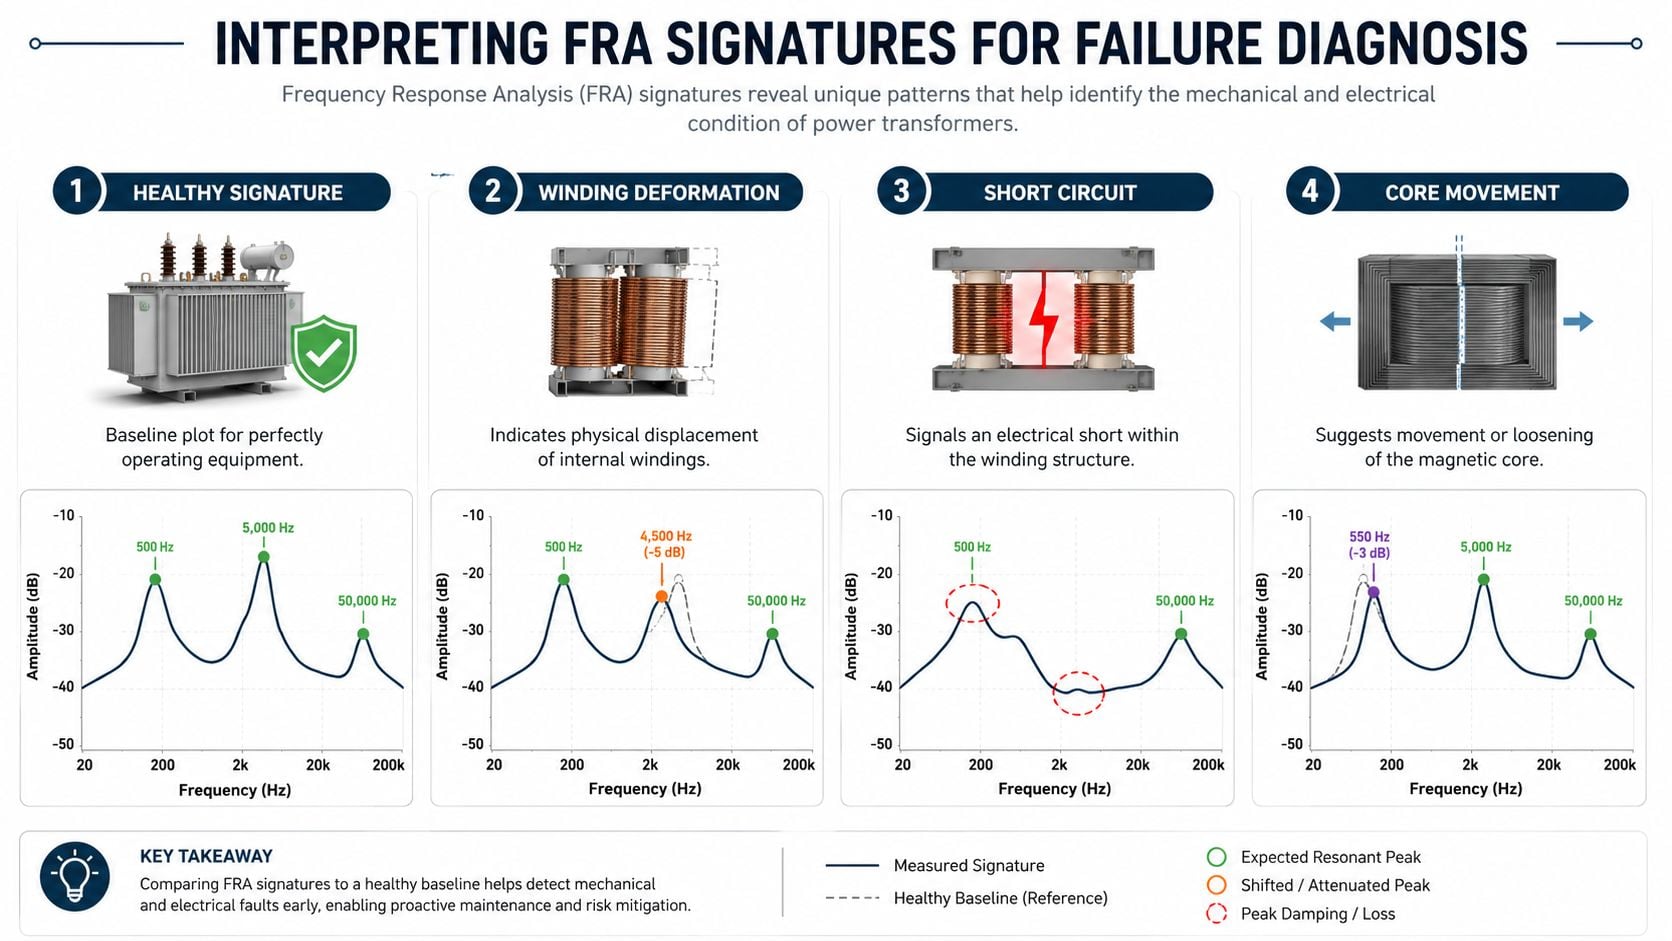
FRA becomes useful when the plot changes maintenance action. A peak that shifts, flattens, or disappears means the dynamic system has changed, and the repair should follow the signature rather than the alarm alone. For a reliability engineer, the task is to separate resonance, looseness, damage, and boundary-condition problems without calling the fault too early.
Structural resonance versus operating vibration
A resonance issue usually appears when a peak lines up with the machine's operating or excitation frequency, then rises far above the expected response. A rotating asset can run smoothly at idle and then shake violently in one speed band because the structure is being driven near its natural frequency. That is why an average building resonance near 2.4 Hz, another unidentified mode near 5 Hz, and a traffic-noise excitation peak near 10 Hz were enough to show how overlapping forcing and natural frequencies can lead to amplified vibration and fatigue-related damage (IITK case study).
For a process fan, that means the fan itself may be balanced, but the foundation can still be too flexible. The response curve may look acceptable outside one band and then spike when speed or load passes through the problem area. In that situation, the repair is often structural, not aerodynamic. If the vibration pattern suggests an electrical source instead of a mechanical one, a focused review of electrical fault detection can help separate motor-driven issues from support problems before the wrong component gets opened up.
Loose mounting, cracked frames, and boundary changes
A loose base or cracked frame often changes the lower-frequency response first. The curve may show a new low-frequency shift, a broader peak, or a loss of stiffness that was present in the baseline. On a pump-motor skid, that can point to anchor issues, grout failure, or a support beam that has opened up over time.
A simple before-and-after comparison is usually the most convincing:
| Condition | Typical FRA clue | What it means in the plant |
|---|---|---|
| Baseline healthy structure | Stable peak locations | The support path is behaving consistently |
| Loose mounting | Peak shift and broader response | The structure has lost stiffness |
| Cracked frame | New or distorted mode shape | Load is no longer transferring evenly |
| Foundation deterioration | Lower-frequency amplification | The entire support is becoming more compliant |
The diagnostic value is in the pattern change, not a single number. If the same operating point now excites a different structural response, the mount, frame, or foundation deserves inspection before the machine is blamed.
Bearing wear and hidden mechanical change
Bearing degradation can show up indirectly in FRA when the support stiffness or damping changes. The vibration team may already see symptoms in other measurements, but FRA adds context by showing how the structure transmits that disturbance. It is especially helpful when the issue is early or mixed with another fault, because the response pattern can show that the problem is moving from local wear into a broader support interaction.
The strongest clue is not always a huge peak. Sometimes it is a response that becomes less repeatable between tests, which suggests the system is behaving differently under load or temperature. For a senior technician, that inconsistency is often more useful than a single alarm crossing.
Transformer winding deformation and internal movement
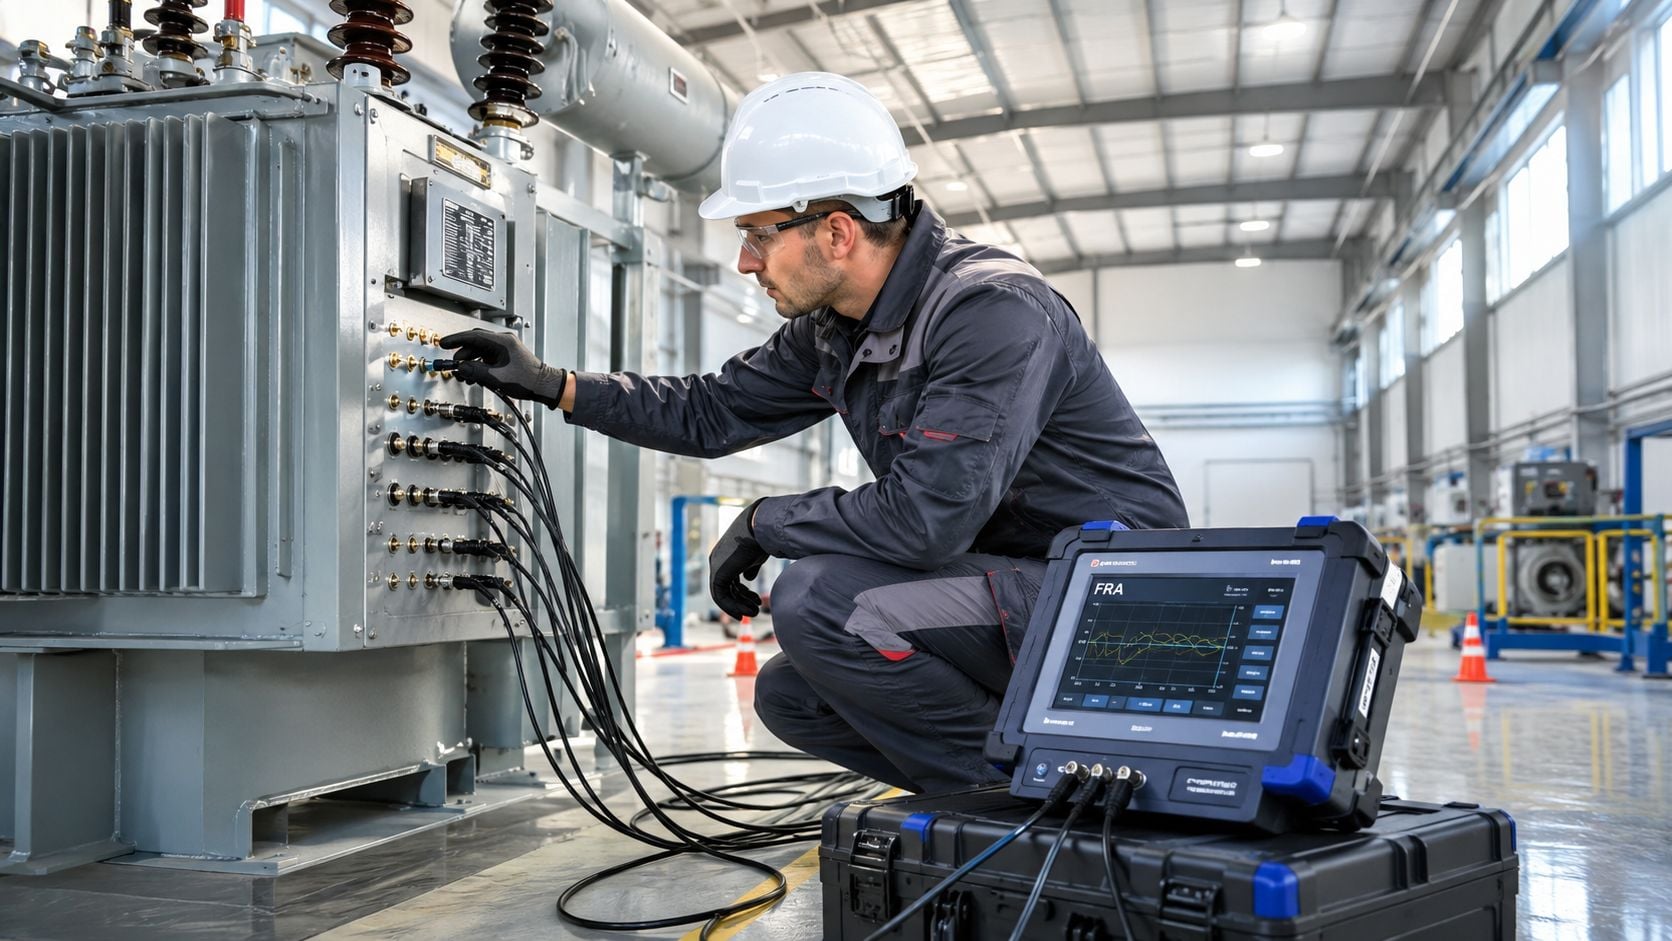
Transformer FRA is a specialized but powerful application. A variable-frequency signal is injected at one terminal and measured at another, then compared with a baseline fingerprint, and the diagnostic paper in the verified data notes that the method can detect damage in windings, core, leads, insulation, and tap changers. It also lists test ranges from 1 kHz to 1 MHz in one standard and up to 20 Hz to 2 MHz in IEC 60076-18 depending on voltage class (technical paper).
That matters because internal winding movement can shift higher-frequency peaks, while core movement tends to affect the lower-frequency range. A transformer that passes a routine visual check can still show a changed baseline that points to mechanical movement inside the tank. For a substation manager, that is the difference between continued service with confidence and a targeted intervention before an in-service fault develops.
The same reasoning applies in a training context. Intelligent triage tools can help operators recognize pattern changes faster, and AI applications for training are relevant here because the decision still depends on pattern recognition, not just data capture.
Real-World FRA Case Studies in Industrial Assets
A mezzanine that keeps cracking, or a fan that keeps looking “imbalanced,” can burn through manpower fast if the team keeps treating symptoms. FRA earns its value when it redirects the repair scope to the structure behind the complaint. Two common plant scenarios show how that plays out.
Mezzanine fatigue that kept returning
A support mezzanine in a processing area developed recurring fatigue damage near a welded joint. The first guess was local fabrication weakness, so the team repaired the joint and monitored it, but the damage returned. FRA on the support structure showed that the mezzanine had a resonant behavior that lined up with nearby machine excitation, so the structure was being driven into a damaging response whenever that equipment ran.
That changed the repair plan. Instead of repeating weld repairs, the team looked at stiffness, bracing, and load path changes. The outcome was a targeted structural correction that addressed the forcing mechanism, not just the visible crack.
A recurring crack is often a structural symptom, not a welding problem by itself.
Fan vibration that looked like imbalance
A large process fan started showing vibration behavior that looked like classic imbalance to the operations team. The rotor inspection did not reveal a convincing imbalance condition, so the maintenance group used FRA to look at the whole support system. The response curve pointed away from the fan wheel and toward the foundation and support structure, which were amplifying normal operating forces.
That distinction mattered. A balancing job would have treated the wrong variable, while the actual issue needed foundation and support attention. The benefit was not just a better diagnosis, it was avoiding repeat work, keeping the fan in service longer, and reducing the chance of a secondary failure tied to the support system.
The practical lesson is straightforward. When a rotating asset seems to fail in the same way more than once, the support structure deserves the same rigor as the rotor. For a plant team, that can mean the difference between a quick maintenance task and a deeper reliability action that keeps the asset stable.
For broader asset programs, the same logic fits transformer health monitoring too, and condition monitoring of transformer becomes a useful reference point when the concern is internal movement rather than visible wear.
Best Practices for High-Confidence FRA Results
Good FRA is not just about getting a plot on a screen. It is about knowing whether the plot really represents the machine, the structure, and the operating condition that matter in the plant. A clean measurement of the wrong boundary condition can lead to a repair that looks scientific and fails in service.
Damping can change the entire story
Damping is one of the biggest reasons FRA interpretations go wrong. Engineering guidance notes that damping levels can totally control response magnitude, and practical analysis sources stress the need to evaluate sensitivity across multiple damping levels and make sure the mode shapes, sampling density, and constraints are correct (Practical frequency response analysis). If the damping assumption is too optimistic, a peak can look harmless when it is not. If it is too conservative, the same peak can look like a crisis.
That matters on real equipment. A fan base, compressor skid, or transformer support may behave acceptably under one damping assumption and look unstable under another. The right response is not to pick the prettiest curve, but to ask which assumption best matches the actual installed asset.
Boundary conditions are not a detail
A shop-floor test and an installed test are not the same thing. Anchors, grout, piping, cable routing, guard mass, and nearby steel all change the boundary conditions that define the dynamic system. A model with the wrong constraints can suppress a mode or create one that does not exist in service.
This is why experienced teams question the setup before trusting the conclusion. If the machine is bolted to a different foundation than the model assumes, the result has to be treated as a clue, not a verdict.
Confidence comes from cross-checks
A strong field practice is to compare FRA findings with other evidence instead of forcing a single tool to explain everything. If a resonance peak appears, the team should check whether operating speed, temperature, load, or support condition changes can reproduce it. If a transformer baseline shifts, the test should be compared against prior fingerprints and any recent transport, maintenance, or fault event.
Useful decision habits include:
- Check repeatability. A real mode usually comes back with similar shape and location.
- Compare installed and expected boundary conditions. If the structure changed, the curve may have changed for reasons outside the machine.
- Treat uncertainty as part of the diagnosis. A peak with low confidence should trigger further inspection, not a rushed repair.
- Use the result to guide the next inspection. FRA is strongest when it narrows the search area for mechanical, structural, or electrical work.
For a plant manager, that level of discipline protects budget as well as uptime. For a reliability engineer, it turns FRA from a special test into a repeatable diagnostic method that can stand up in a maintenance review.
Integrating FRA into Your Predictive Maintenance Program
FRA delivers the most value when it becomes part of the asset record, not a one-time troubleshooting exercise. A baseline test can serve as a reference point for a critical asset, especially for large rotating machines, support structures, and transformers. When the response curve changes over time, the maintenance team can focus on the drift instead of waiting for the machine to fail in an obvious way.
That approach fits a broader condition-monitoring strategy. Periodic FRA can be paired with route-based vibration checks, inspections, and targeted follow-up work, while online or data-driven methods can show when behavior starts to shift in service. An application note on real-time frequency response estimation describes measured-data approaches that use multi-sine excitation and recursive Fourier or least-squares methods, which shows that FRA is no longer limited to offline design validation. That matters for rotating machinery and process assets where downtime is expensive and operating conditions change over time.
The practical payoff is better prioritization. A plant can decide which assets need support correction, which need closer monitoring, and which can stay on a standard inspection interval. FRA also helps the team document whether a repair changed the dynamic behavior, which improves follow-up decisions after a foundation rebuild, brace addition, or transformer intervention.
For teams building a larger monitoring architecture, the same logic fits condition monitoring systems, because the goal is not more data, it is better decisions about asset risk and repair timing.