A pump passes alignment. Bearings are replaced on schedule. Lubrication is clean. Yet the same machine keeps coming back on the bad actor list, usually after a speed change, a piping modification, or a rebuild that should have helped. That pattern is common in plants with rotating assets, and it often points to a structural vibration problem rather than a simple maintenance execution issue.
That's where modal analysis earns its place. For reliability engineers, maintenance managers, and plant leaders, the practical question behind “what is modal analysis” isn't academic. It's whether the team can prove why a pump, turbine, gearbox, or motor-supported structure is absorbing energy at the wrong frequency and deforming in a way that drives repeat failures.
Table of Contents
- Why Your 'Bad Actor' Equipment Might Have a Resonance Problem
- Understanding Structural DNA Natural Frequency Mode Shape and Damping
- The Modal Analysis Toolkit From Sensors to Software
- Experimental vs Operational Modal Analysis Which Is Right for Your Asset
- Interpreting Modal Data to Diagnose Equipment Failures
- Case Studies Modal Analysis in Action
- Integrating Modal Analysis into Your Reliability Program
Why Your 'Bad Actor' Equipment Might Have a Resonance Problem
A typical example is a process pump that keeps eating bearings even though the route shows no obvious surprise until vibration rises sharply. The team checks balance, confirms alignment, inspects lubrication practice, and tightens the maintenance procedure. The problem settles for a while, then returns.
That's usually the point where standard monitoring has done its job, but the plant still doesn't have the answer. General vibration analysis is excellent for tracking fault signatures such as imbalance, misalignment, looseness, and bearing defects. Modal analysis is different. It asks how the structure itself wants to vibrate and whether operating forces are exciting that behavior.
When the machine isn't the whole problem
A pump doesn't run by itself. It runs on a baseplate, over grout, through anchor bolts, against connected piping, and under process load. Any one of those can shift stiffness and create a condition where the asset responds violently at a particular frequency.
In industrial reliability, modal and resonance testing are essential diagnostic techniques because they identify natural frequencies and mode shapes before resonance allows even small vibrations to cause severe structural damage, particularly in rotating equipment such as turbine blades and other dynamically loaded components, as described in this overview of vibration testing methods.
Practical rule: If a machine fails repeatedly after competent maintenance work, the team should stop treating it as a routine defect and start treating it as a dynamic system problem.
A route can tell the team that vibration is high. It usually won't show whether the machine train, support steel, or piping arrangement has a resonance near running speed. That's why chronic bad actors often survive several rounds of corrective work.
What changes the decision
Plant teams often make a mistake here. They assume repeated failure means the component choice is wrong or the rebuild quality is poor. Sometimes that's true. But when the failure repeats across technicians, parts, and work orders, it's smarter to investigate structural response.
A good starting point is to tighten the basics of vibration monitoring route setup for industrial assets. Once those basics are stable, modal analysis becomes the right escalation path for equipment that still won't behave.
For a plant manager, the value is simple. Modal analysis converts a frustrating “bad pump” story into a solvable engineering question. Which frequency is being excited, what shape is the structure taking when it moves, and what physical change will stop it?
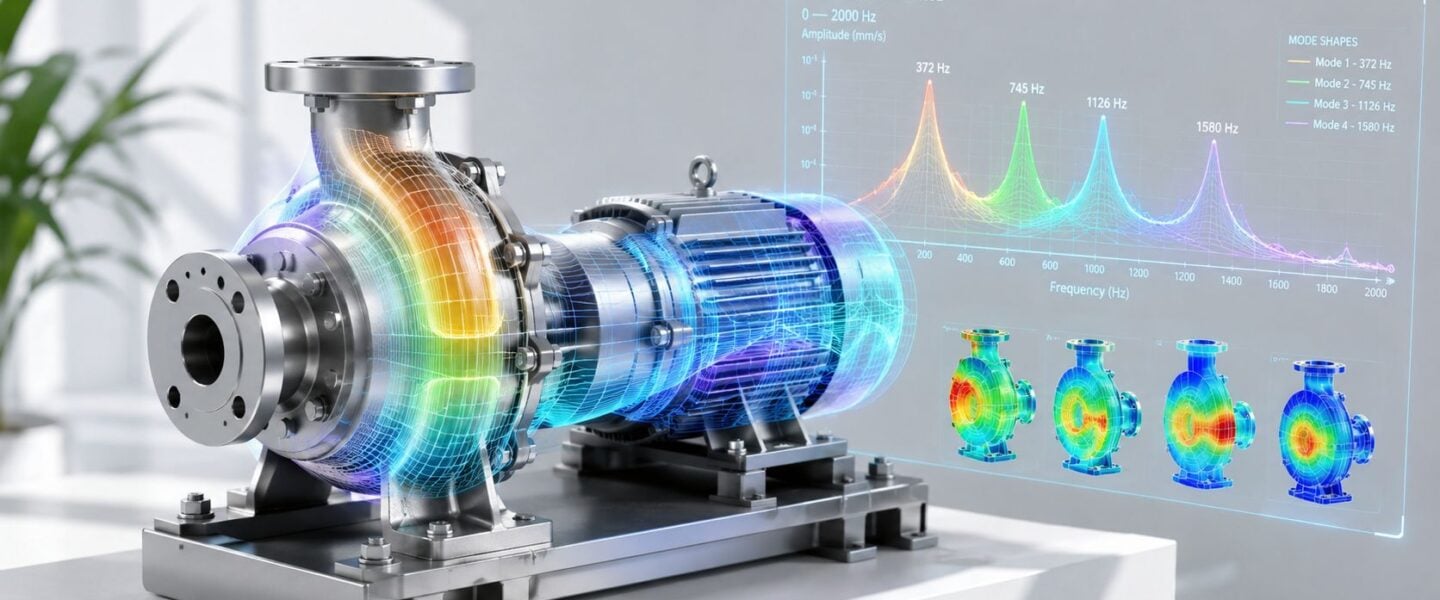
Understanding Structural DNA Natural Frequency Mode Shape and Damping
When engineers ask what is modal analysis, the shortest useful answer is this. It's a way to define a structure's dynamic fingerprint. That fingerprint comes from three parameters: natural frequency, mode shape, and damping.
Modal analysis identifies those three critical structural parameters and uses them to build a Modal Model. At resonance, even a 1% increase in input force can make response amplitude rise asymptotically, with displacement exceeding safe limits by 10–50x. Systems with a damping ratio of 0.01 can show 100x higher amplification than systems with 0.1 damping, as explained in this modal analysis reference.
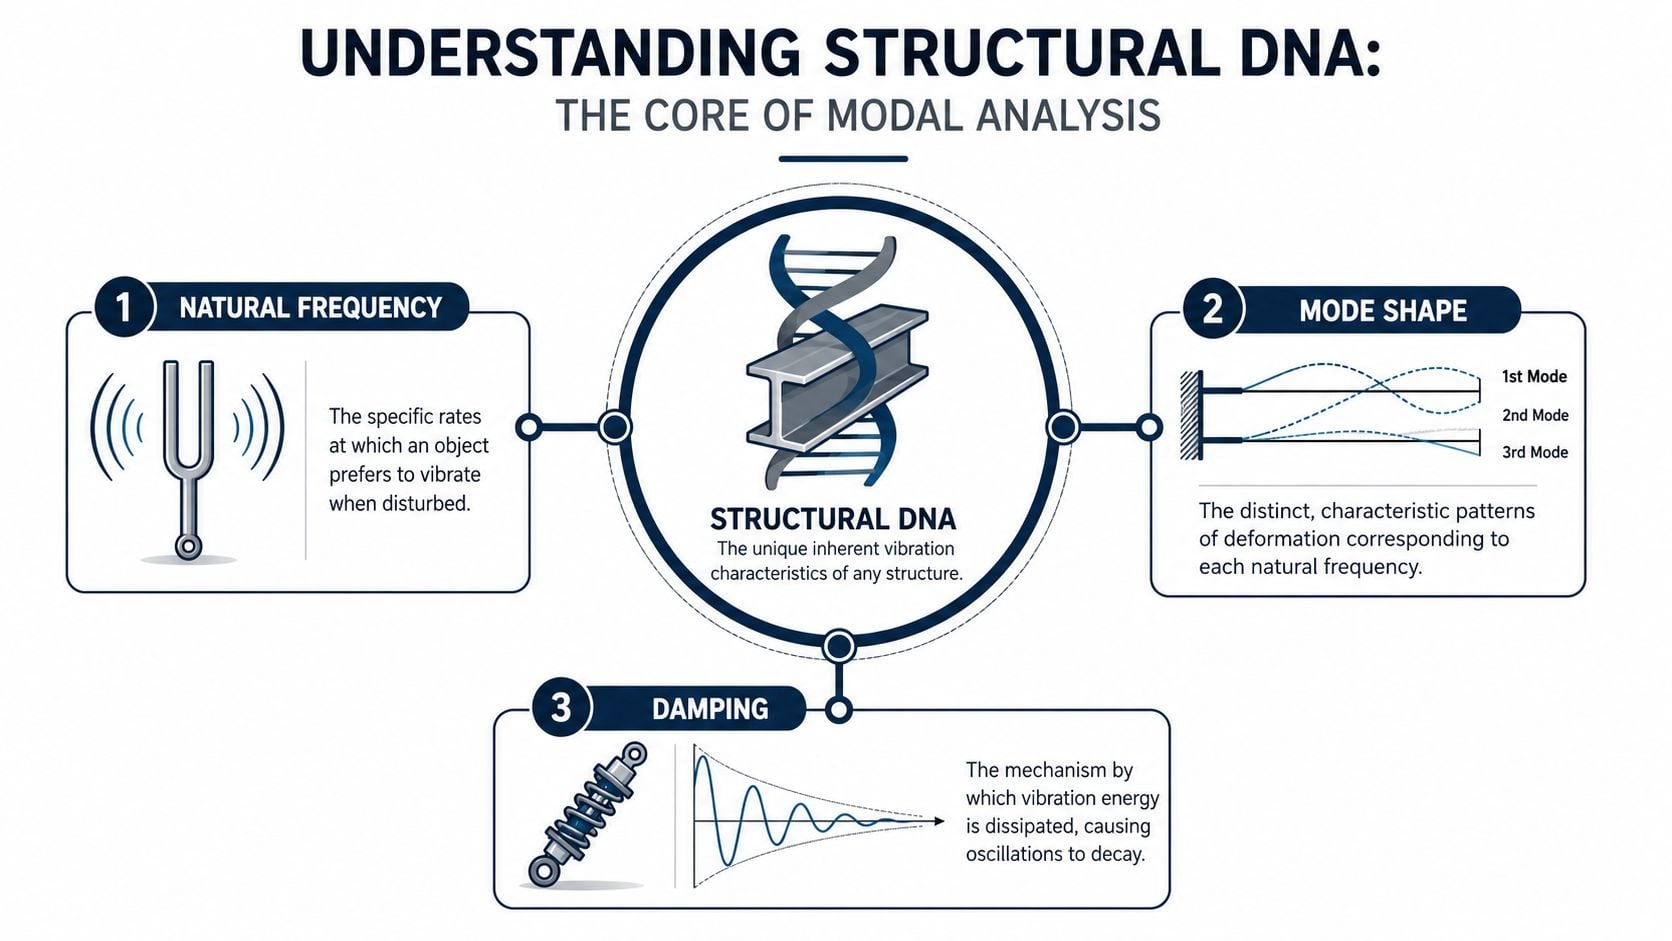
Natural frequency
Every structure has frequencies at which it prefers to vibrate. A pump skid, motor base, gearbox pedestal, or pipe rack all have them. If an operating force lines up with one of those frequencies, the response can spike.
A simple mental model helps. Strike a steel bracket and it rings at its own preferred rate. Increase stiffness and that preferred rate shifts. Add mass and it shifts again.
Mode shape
A mode shape is the deformation pattern at a specific natural frequency. This is what turns modal analysis from an abstract calculation into a practical diagnostic tool. The team doesn't just learn that a problem exists near a given frequency. The team sees whether the structure rocks, twists, bends, or moves locally at one corner.
For a motor-pump train, the mode shape might show the motor end lifting while the pump end stays relatively fixed. That points attention toward the base, hold-down condition, or connected strain rather than the rotor alone.
A frequency peak without a shape is only half an answer. The shape tells maintenance where to act.
Damping
Damping is the structure's ability to dissipate vibration energy. High damping suppresses response. Low damping allows vibration to build and persist.
This matters in steel-supported machinery because lightly damped systems can react sharply when they're excited near resonance. Two machines can have a similar forcing input, but the one with lower damping can behave far worse.
The FRF as the map
In practical testing, engineers often use a Frequency Response Function, usually shortened to FRF, to map how a structure responds across frequency. It links input energy to output motion and highlights where the system is sensitive.
The plant-level takeaway is straightforward:
- Natural frequency tells the team where the structure is vulnerable.
- Mode shape shows how it deforms at that vulnerable point.
- Damping indicates how aggressively the system will respond.
Teams that already use vibration analysis in manufacturing environments usually understand machine fault frequencies. Modal analysis adds the structural side of the picture, which is often what routine fault analysis misses on stubborn assets.
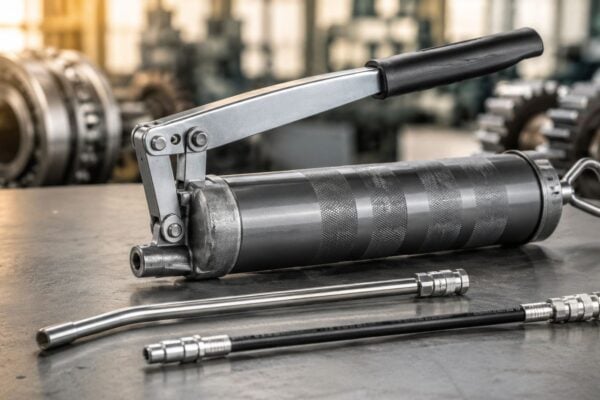
The Modal Analysis Toolkit From Sensors to Software
A modal test isn't mysterious. On the plant floor, it comes down to a controlled way of putting energy into a structure, measuring how it responds, and processing the signals so the response becomes visible.
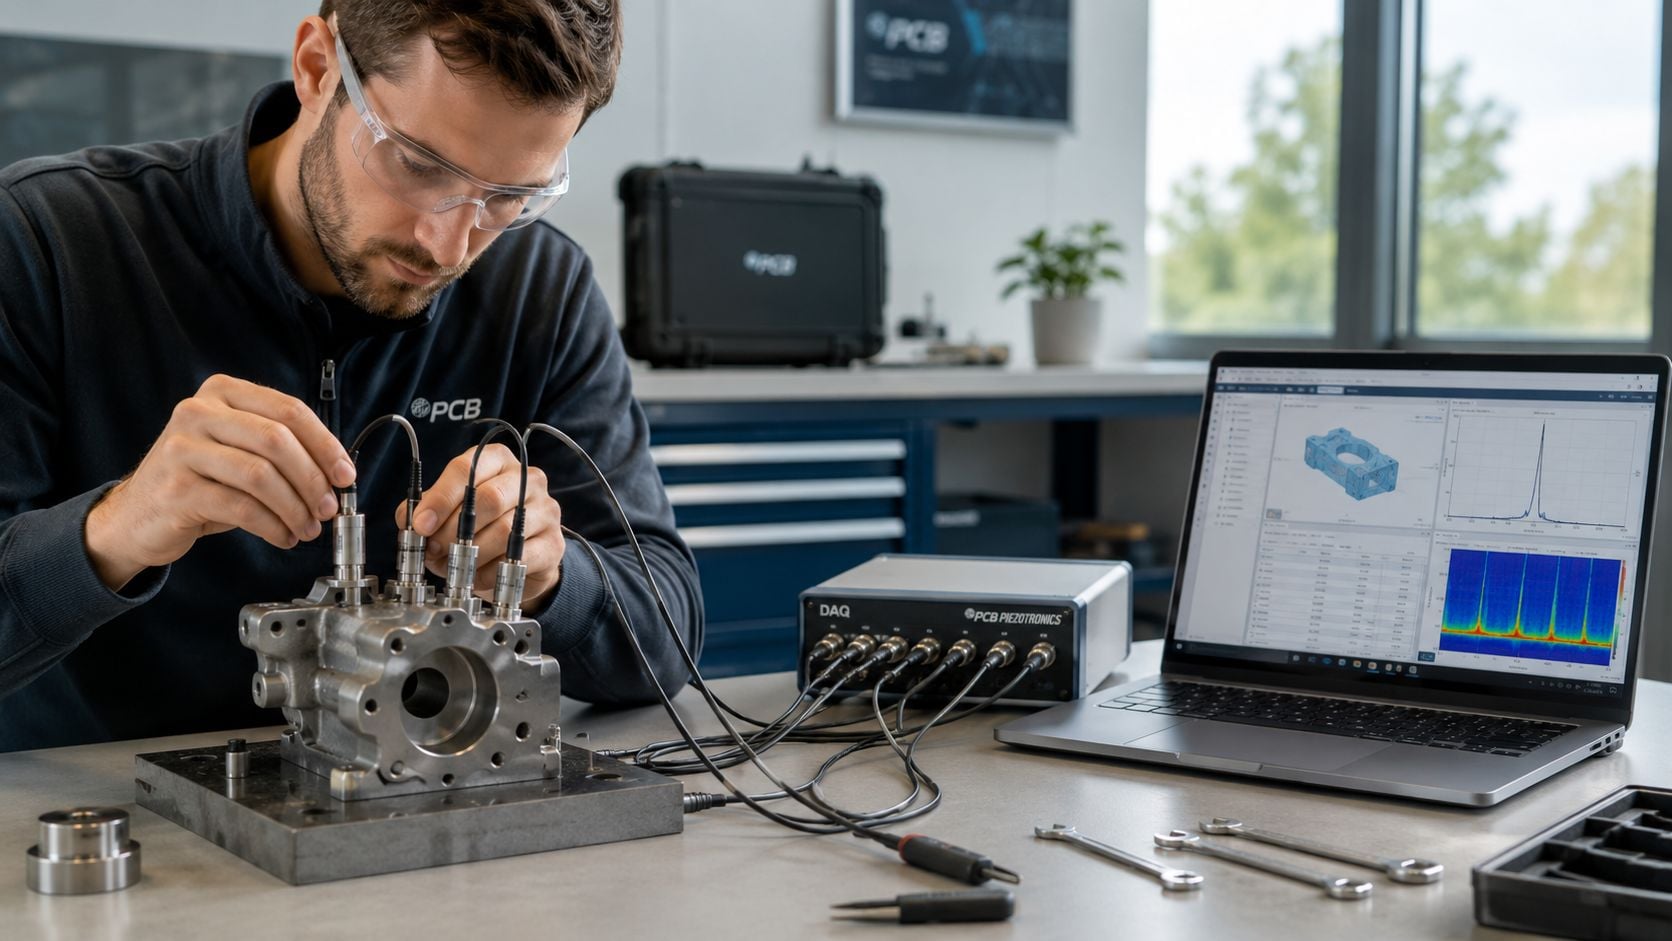
The core hardware
For a shutdown test, the basic toolkit usually includes:
- Impact source. A calibrated hammer introduces a measured input force into the structure. That matters because the analysis needs to know both what went in and what came out.
- Response sensors. Accelerometers measure motion at selected points. On complex pump casings, gearbox housings, or support frames, sensor placement decides whether the team captures the actual deformation pattern or misses it.
- Data acquisition system. The DAQ records force and response channels in sync. If timing is poor, the derived response functions won't be trustworthy.
- Analysis software. Software converts raw signals into FRFs, estimates modal parameters, and animates mode shapes so the structure's movement can be interpreted physically.
Why setup decisions matter
The tool choice isn't the hard part. The setup is. A poor test geometry can make a sound instrument package deliver weak conclusions.
For example:
- Single-axis sensors may be enough for a simple beam-like structure.
- Triaxial sensors are often better on machinery supports because motion doesn't stay in one direction.
- Sparse measurement points can hide local flexibility around feet, pedestals, or nozzle connections.
- Bad excitation locations can fail to energize the mode the team cares about.
Field note: The test should match the failure question. If the problem is casing motion near a compressor support, the geometry needs to resolve that local area, not just the machine as a whole.
Software doesn't rescue a weak test
Plants sometimes assume the analysis package will sort everything out later. It won't. Modal work still depends on clean force input, stable response measurements, and a geometry model that represents the actual asset.
That's one reason many facilities bring in specialists for difficult bad actors while keeping routine condition monitoring in house. For teams weighing when to escalate, professional vibration analysis support is most valuable when repeated failures suggest the issue sits in the structure, not just in the rotating element.
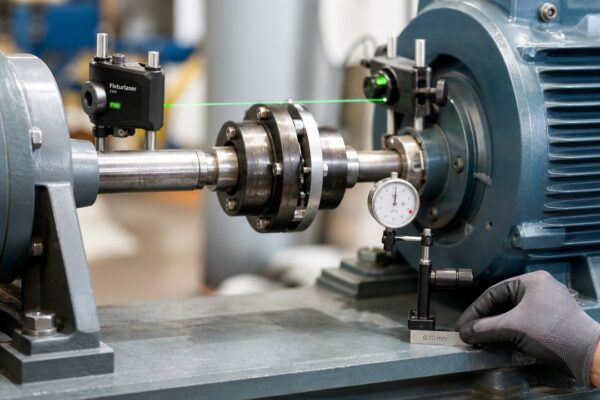
Experimental vs Operational Modal Analysis Which Is Right for Your Asset
A pump can run smoothly during a shutdown test, then start tearing up seals and cracking supports two hours after startup. That is usually not a contradiction. It is a test-condition problem.
Many explanations of modal analysis stay on the lab side of the subject. Reliability work in a plant needs a sharper distinction. Experimental Modal Analysis (EMA) and Operational Modal Analysis (OMA) answer different questions, and picking the wrong one can send a team toward the wrong fix.
EMA is the classic controlled test. The asset is shut down or isolated, a known force is applied, and the team measures both the input and the response. OMA uses the machine's own operating forces while it runs. The team does not directly measure the excitation force. Instead, analysts extract natural frequencies, damping, and mode shapes from vibration collected under actual load, temperature, and support conditions.
That difference matters on real machinery.
Where EMA works well
EMA works best when the goal is to understand the structure itself under controlled conditions. It is a good fit for outage troubleshooting, design validation, and checking whether a structural modification did what it was supposed to do.
Typical EMA applications include:
- Shutdown testing on a fan frame or motor base
- Validation of a new skid before startup
- Investigation of support steel, soleplates, or attached piping with the machine isolated
- Post-repair verification after grouting, stiffening, or base changes
EMA gives cleaner data and clearer force-response relationships. The trade-off is simple. A clean shutdown test can miss the way the machine behaves once heat, process forces, fluid loading, and bearing conditions come into play.
Where OMA becomes the better choice
OMA earns its value when the failure only shows up in service. Pumps, turbines, compressors, and gearboxes often change behavior as they reach operating temperature and load. Stiffness shifts. Support conditions change. Piping strain shows up. A structure that looked acceptable during a cold test can move into resonance at running speed or at a process-driven harmonic once the full machine-train-system is active.
That is the gap many guides miss. EMA describes the asset in isolation. OMA shows how the asset behaves in the plant.
For bad actors that only fail during production, OMA is often the more useful test because it captures the actual operating state, not a simplified version of it.
EMA vs OMA Comparison
| Criteria | Experimental Modal Analysis (EMA) | Operational Modal Analysis (OMA) |
|---|---|---|
| Asset condition | Usually shutdown or isolated | Running under normal operating conditions |
| Input measurement | Known input force is measured | Input force isn't directly measured |
| Best use | Design validation and outage troubleshooting | Predictive maintenance on equipment in service |
| Strength | Controlled excitation and cleaner test conditions | Captures real thermal, load, and support effects |
| Limitation | Can miss operational mode shifts | More dependent on good operating data and interpretation |
If the failure appears only at temperature and load, a cold hammer test may describe the structure accurately and still miss the root cause.
Choosing the right method for plant decisions
The practical choice is usually straightforward. If the team needs to verify a base, frame, or support design during an outage, start with EMA. If vibration, seal failures, looseness symptoms, or repeated cracks appear only while the machine is producing, OMA should move up the list quickly.
In some cases, the right answer is both. I have seen teams use EMA during an outage to identify the basic structural modes, then use OMA after startup to confirm which modes are being excited in service. That combination closes the gap between lab-style testing and reliability decisions on the plant floor.
The business question should drive the method. What condition creates the failure, and what is the cost of waiting for another outage to learn the answer? Plants already comparing predictive maintenance and preventive maintenance approaches should apply the same logic here. Use the test that matches the machine's actual failure state.
Interpreting Modal Data to Diagnose Equipment Failures
Collecting modal data is only the beginning. The value shows up when the team can move from a plot on a screen to a physical correction in the field.
A practical modal workflow starts with the response data, then narrows toward a structural cause. The engineer looks for frequencies where the system responds strongly, checks how the structure deforms at those points, and ties that motion to a known failure mechanism.
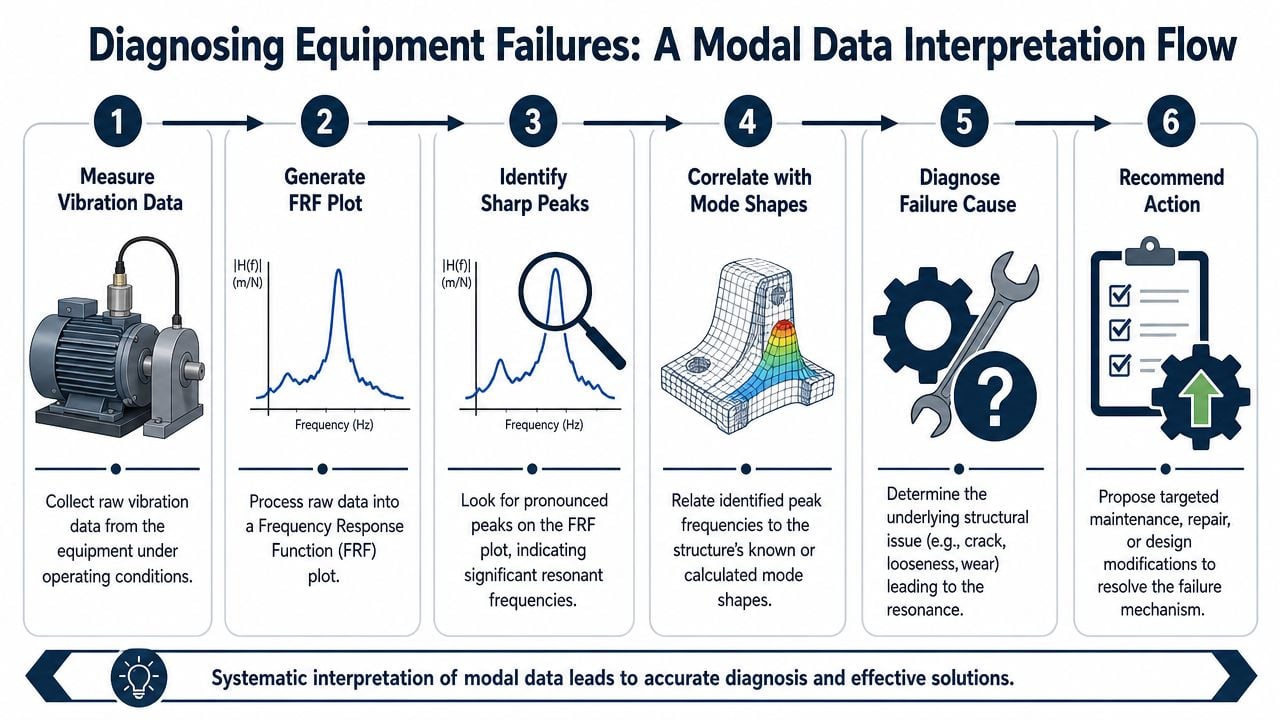
Reading the FRF and the shape together
The first clue is usually a sharp peak in the FRF. That peak suggests a frequency where the structure is absorbing energy efficiently. By itself, that's informative but incomplete.
The next step is the animated mode shape. Through this, maintenance teams often get their first clear explanation for a recurring problem. A base that twists, a motor that rocks diagonally, or a casing that flexes at one support point points the investigation in a very specific direction.
For example, if a compressor casing shows localized movement near a support foot, the team may inspect hold-down integrity, support stiffness, or piping strain before changing internals. If the shape shows broad frame motion, the correction may involve stiffening or support redesign.
The Zero-Hz mode check
One of the most useful and least discussed troubleshooting steps is looking for Zero-Hz modes, also called rigid body modes. In practice, these can reveal that the structure isn't constrained the way the model or the team assumed.
A 2025 analysis found that 40% of unplanned downtime in food and beverage processing plants stems from soft foot conditions where pumps and motors aren't rigidly mounted, creating false mode shape readings. The same analysis highlights low-frequency Zero-Hz modes as actionable indicators of mounting failures in assets such as pumps and motors, discussed in this structural engineering thread cited for the concept.
What failure modes modal data can separate
Modal interpretation helps distinguish problems that look similar in route data but require very different actions.
- Soft foot or poor mounting. The mode shape often shows rigid body rocking or twisting rather than elastic structural bending.
- Flexible base or support steel. Motion distributes through the support system, not only through the machine casing.
- Piping-induced distortion. The machine may deform asymmetrically because connected piping changes boundary conditions.
- True resonance near running frequency. A strong response aligns with operating excitation, making a structural change more effective than repeated component replacement.
If the mode shape points to a mounting problem, redesigning the machine is usually wasted effort. The faster win is often under the feet.
Turning interpretation into corrective action
Once the team identifies the shape and likely constraint issue, the action becomes practical. Re-shim the feet. Correct soft foot. Rework hold-downs. Stiffen a frame member. Change support geometry. Reduce transmitted forcing.
That's where modal analysis connects directly to root cause work. It doesn't just confirm that vibration is present. It explains why the structure accepts that vibration so readily. For teams trying to eliminate recurring failures rather than document them, a disciplined root cause analysis process for equipment failures is the right partner to modal findings.
Case Studies Modal Analysis in Action
The quickest way to understand what is modal analysis is to look at how it changes decisions on real equipment. The pattern is usually the same. A machine presents as a chronic vibration or reliability problem, normal fixes don't hold, and modal work identifies the structural reason.

In practical reliability work, modal analysis solves vibration-related issues by identifying the frequency where a structure absorbs maximum energy and by visualizing the deformation shape, which allows targeted structural changes on assemblies such as turbine blades or compressor casings, according to this practical modal analysis overview.
Vertical turbine pump with chronic bearing failures
A vertical turbine pump in a process service keeps returning with excessive vibration and bearing distress. Alignment is acceptable. The rotating assembly checks out. Operating data shows the problem is worst under normal production flow, not during light-load operation.
The plant uses operational modal analysis because the failure only appears when the machine is hot and loaded. The results show a structural resonance near the running condition, with the support assembly moving in a way that amplifies lateral response.
The fix isn't another bearing change. The team adds stiffness to the support structure and verifies that the response has shifted away from the operating excitation. The lesson is direct. If the mode exists in service, only an in-service test is likely to expose it.
Large industrial fan with frame flexibility
A large induced-draft fan shows severe vibration after maintenance, but balancing doesn't stabilize it. During a planned outage, the team performs experimental modal analysis on the fan support and surrounding structure.
The test reveals a flexible frame mode in the operating range of interest. The fan wasn't merely out of balance. The frame was responding like a spring. After reinforcing the frame, the machine returns to service with a much more stable structural response.
Some vibration problems look like rotor faults until the structure tells a different story.
Motor with an imbalance-like signature that wasn't imbalance
A motor on a pump skid presents a vibration pattern that repeatedly gets treated as imbalance. The machine is balanced, then vibrates again. The amplitude shifts after each reinstall, which is a clue that the support condition is changing.
Modal interpretation focuses on low-frequency rigid body behavior. The shape points to a mounting issue rather than a rotor issue. Inspection confirms soft foot. The team corrects the foot condition with proper shimming and mounting verification.
This kind of case matters because it prevents expensive wrong work. Without the modal perspective, a plant can lose time on repeat balancing, unnecessary redesign, or parts replacement when the actual issue sits between the machine foot and the baseplate.
Integrating Modal Analysis into Your Reliability Program
Modal analysis isn't an everyday route task. It's a high-level diagnostic tool for specific moments when standard condition monitoring has reached its limit.
The best programs deploy it at three trigger points. First, during commissioning of critical assets or structural modifications. Second, when a bad actor keeps failing after competent corrective work. Third, when the plant needs to verify that a major stiffness, support, or mounting change successfully removed the resonance risk.
Where plants get poor results
Most weak modal work traces back to one of a few avoidable mistakes:
- Testing the wrong condition. A shutdown test won't answer a hot-running failure.
- Using poor sensor placement. If the geometry misses the moving area, the mode shape won't be useful.
- Ignoring constraints. Loose feet, degraded grout, or piping strain can distort the whole result.
- Stopping at the plot. The value comes from linking the frequency and shape to a maintenance action.
What mature programs do differently
Strong reliability teams treat modal analysis as a decision tool, not a report generator. They use it when the business consequence of being wrong is high, such as repeated pump failures, turbine vibration concerns, gearbox support issues, or structural changes around critical process equipment.
That's why modal analysis belongs inside the broader reliability strategy. It helps plants avoid recurring downtime by solving the structural cause of vibration, not just the visible symptom.
If a plant has pumps, turbines, motors, or gearboxes that keep returning to the bad actor list, Forge Reliability can help determine whether resonance, soft foot, structural flexibility, or another hidden dynamic issue is driving the failures. Schedule a free reliability assessment to review the asset history, operating condition, and diagnostic path needed to eliminate repeat downtime.