Monday starts with three radios going at once. Operations wants the packaging line back up, the storeroom can't find the right bearing for a standby pump, and the planner is trying to reshuffle technician hours after two emergency jobs wiped out the weekly schedule. Most plants don't have a labor problem first. They have a prioritization problem, a data problem, and a rules problem.
That's why resource allocation optimization matters in maintenance. In a plant setting, it isn't about trimming headcount or driving every craftsperson to maximum utilization. It's the disciplined allocation of labor, spares, contractor support, monitoring technology, and planning attention to the assets and failure modes that matter most. When that discipline is missing, plants drift into reactive work, long delays, and expensive compromises. Resource optimization failures in industrial settings often stem from poor data management and weak decision structure, which drives inefficient processes and suboptimal utilization of resources according to this resource allocation analysis.
Plants that have already moved from firefighting to structured execution usually make the same shift. They stop treating every breakdown, every work order, and every spare part request as equal. A useful reference is this AI for Manufacturing case study, which shows how operational discipline and better maintenance systems can support the transition from reactive to predictive work. The same plant-floor logic shows up in strong operations and maintenance programs: define priorities, enforce rules, then improve the data feeding those rules.
Table of Contents
- From Reactive Chaos to Proactive Control
- Establishing Your Optimization Objectives and KPIs
- Prioritizing Assets with Criticality and FMEA
- Targeting Predictive Monitoring Resources
- Optimizing Spare Parts and Inventory Levels
- Aligning Your Workforce and Contractor Schedules
- Using Your CMMS for Governance and Improvement
- Take Control of Your Maintenance Resources
From Reactive Chaos to Proactive Control
Reactive maintenance has a recognizable pattern. A critical motor trips. The planner expedites a job without checking if the electrician assigned also owns a preventive route that day. A seal kit is missing, so a buyer calls three suppliers. Operators start pushing for temporary fixes because production pressure is immediate and maintenance capacity isn't.
That isn't just poor scheduling. It's failed resource allocation optimization.
What resource allocation optimization means on the plant floor
In maintenance, resources include more than technician hours. They include planners, contractors, vibration routes, infrared inspections, storeroom space, spare assemblies, production windows, and the quality of CMMS data used to make decisions. Optimization means assigning those limited resources where they produce the highest reliability value with the lowest operational disruption.
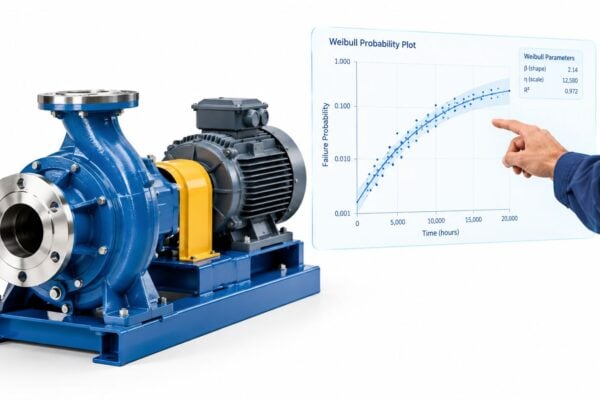
A chemical plant with several centrifugal pumps makes this easy to see. If maintenance treats a utility water pump, a redundant transfer pump, and a reactor feed pump as equal, technicians will spend time evenly instead of intelligently. The result is over-maintaining low-risk equipment while under-protecting the asset that can stop production or create a safety event.
Practical rule: Plants don't get proactive because they buy more tools. They get proactive when they establish rules for who gets time, parts, and attention first.
What usually breaks first in the process
The failure point is often decision quality. Poor asset data, weak failure coding, duplicate equipment records, and missing bills of material leave planners guessing. Once guessing starts, urgency replaces priority. Then every day becomes a contest between the loudest production call and the last failure that happened.
A workable control model has a few basic features:
- Clear priority logic: Critical assets and severe failure modes move to the front of the queue.
- Defined maintenance pathways: Not every asset needs the same mix of preventive, predictive, and corrective work.
- Inventory rules: Storeroom strategy supports risk exposure, not habit buying.
- Governance: The plant reviews resource conflicts routinely and adjusts before the backlog turns into emergency work.
A structured maintenance program connects reliability analysis to daily execution. That's where the rest of the system has to go.
Establishing Your Optimization Objectives and KPIs
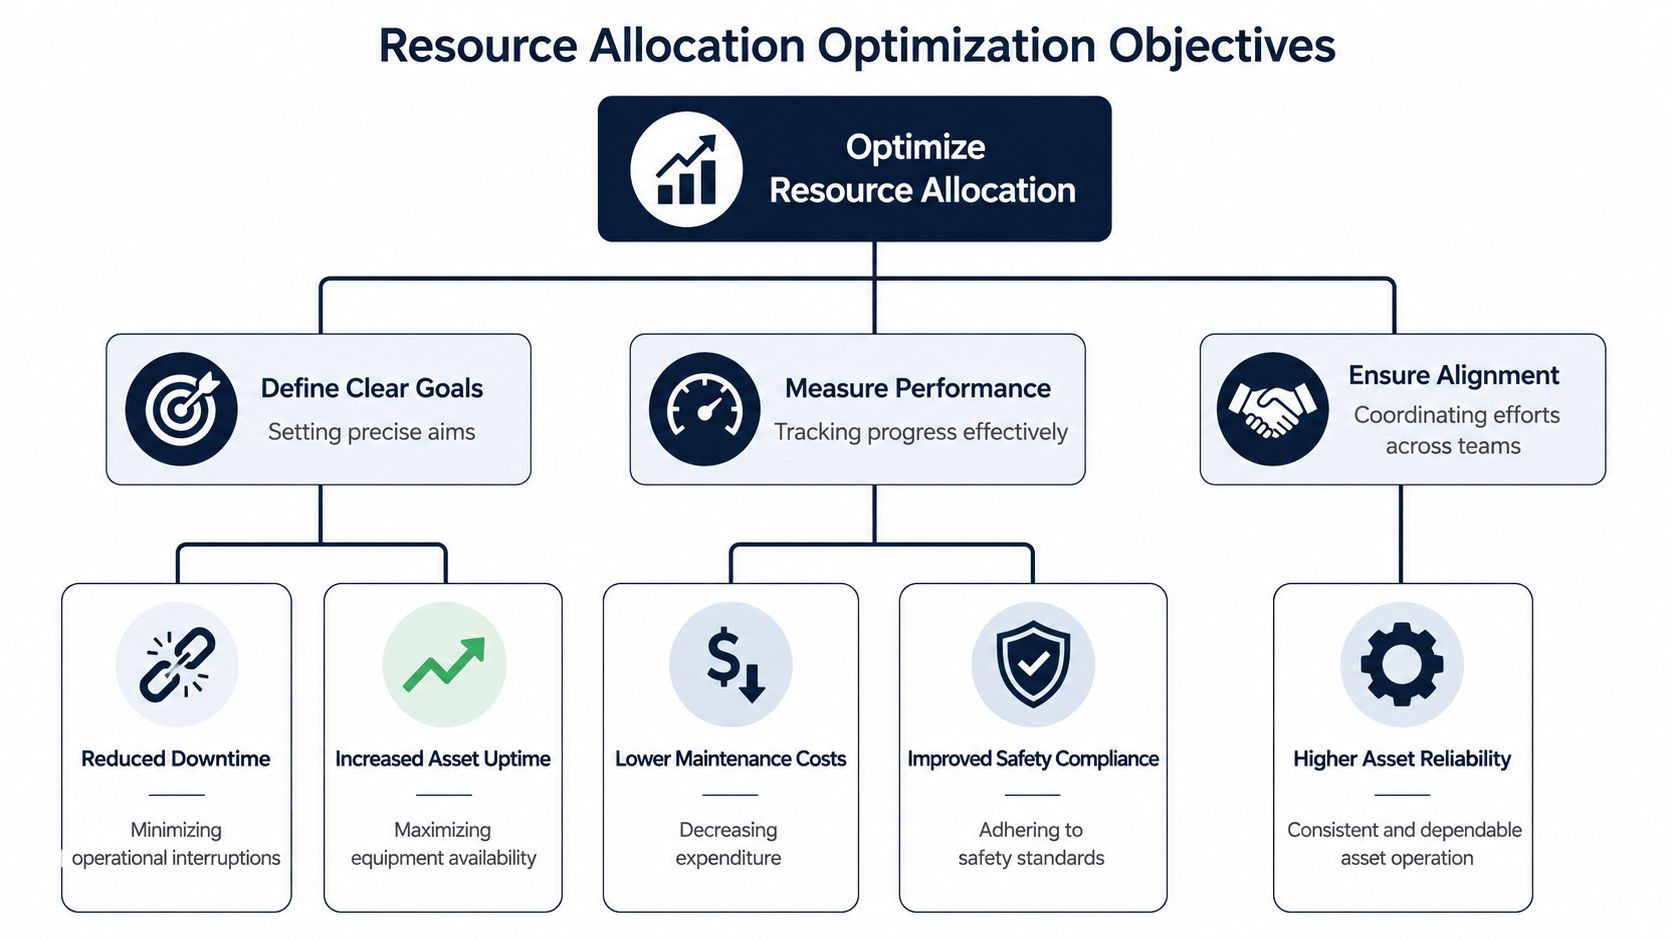
A plant manager usually sees the problem by 9:00 a.m. The scheduler is trying to protect this week's PM plan, production is asking for three urgent callouts, and the storeroom is short a motor that someone assumed was on the shelf. If the only objective on the wall says “improve reliability,” none of those decisions gets easier. Resource allocation improves when the plant defines what result matters, where it matters, and which maintenance choices support it.
A food and beverage line makes this concrete. If throughput is falling on the bottling train, the maintenance objective should not sit at the plant level as a broad reliability statement. It should name the equipment group causing lost hours, the failure patterns behind those losses, and the execution behaviors expected from planning and scheduling. That is how reliability engineering starts influencing the daily schedule instead of living in a separate report.
Start with business exposure, then set maintenance objectives
Good objectives begin with the consequence the plant is trying to control. A packaging line losing saleable output because of nuisance stops needs one resource plan. A boiler system with stable performance but rising contractor spend needs another. The maintenance department should not measure both situations with the same KPI stack.
Use both leading and lagging indicators, but assign each one a job. Leading KPIs show whether the plant is creating the conditions for reliable execution. Lagging KPIs show whether those choices reduced downtime, repeat failures, or cost exposure. For plants refining that scorecard, this guide to reliability metrics including MTBF, MTTR, and OEE is a useful reference.
| KPI type | What it answers | Plant-floor example |
|---|---|---|
| Leading KPI | Is the team preparing and executing the right work? | Schedule compliance, PM route completion, backlog age by priority, planned work ratio |
| Lagging KPI | Did the plant get the operational result it needed? | Downtime by asset group, availability, repeat failures, maintenance cost tied to lost production |
Build a goal-to-execution chain that crews can use
The plants that get traction keep each layer separate and connected.
- Business goal: Increase output from the bottling hall without adding another line.
- Maintenance objective: Cut unplanned stoppages on the filler, capper, labeler, and conveyor train.
- Reliability focus: Address contamination-driven bearing failures, motor overheating, chain tracking problems, and poor lubrication control.
- Execution rules: Reserve planner time for recurring defects, protect the weekly schedule on constrained assets, and stock parts that support the known failure modes.
- KPIs: Planned work ratio, repeat failure count, downtime by asset class, schedule compliance, and PM completion on the constrained line.
That last layer matters because it ties analysis to action. If FMEA or RCM work identifies bearing contamination as a dominant failure mode, the KPI set should track whether inspection routes, lubrication tasks, and seal-related parts support that finding. Otherwise the plant does the analysis once, files it away, and continues scheduling by urgency.
One more point gets missed often. Ownership has to be explicit. Operations owns access to equipment, operating discipline, and startup quality. Maintenance owns planning quality, schedule execution, and repair quality. Reliability engineering owns failure analysis, maintenance strategy selection, and the logic behind task intervals and asset priorities.
A KPI without an owner is just a chart.
This same discipline shows up outside plant maintenance as well. Teams trying to reduce waste with IT asset management face the same basic problem. Resources get consumed faster when priorities, ownership, and replenishment rules are unclear. On the plant floor, the consequences are more severe because bad allocation decisions turn into missed production, expedited parts, and avoidable emergency work.
Prioritizing Assets with Criticality and FMEA
Every plant says safety comes first and production is critical. That still doesn't tell the scheduler whether a leaking process pump deserves more attention than a hot motor on a wastewater blower. Asset criticality analysis creates that order.
In a chemical processing plant, consider a multi-stage centrifugal pump moving feedstock to a reactor. If that pump loses discharge pressure because of impeller wear, seal failure, bearing damage, or suction recirculation, the problem can spread fast. Production loss is only one consequence. There may also be contamination, environmental exposure, safety risk, and expensive restart procedures. That asset should never compete for attention using the same rules as a non-critical utility pump.
Score assets the way the plant actually feels failure
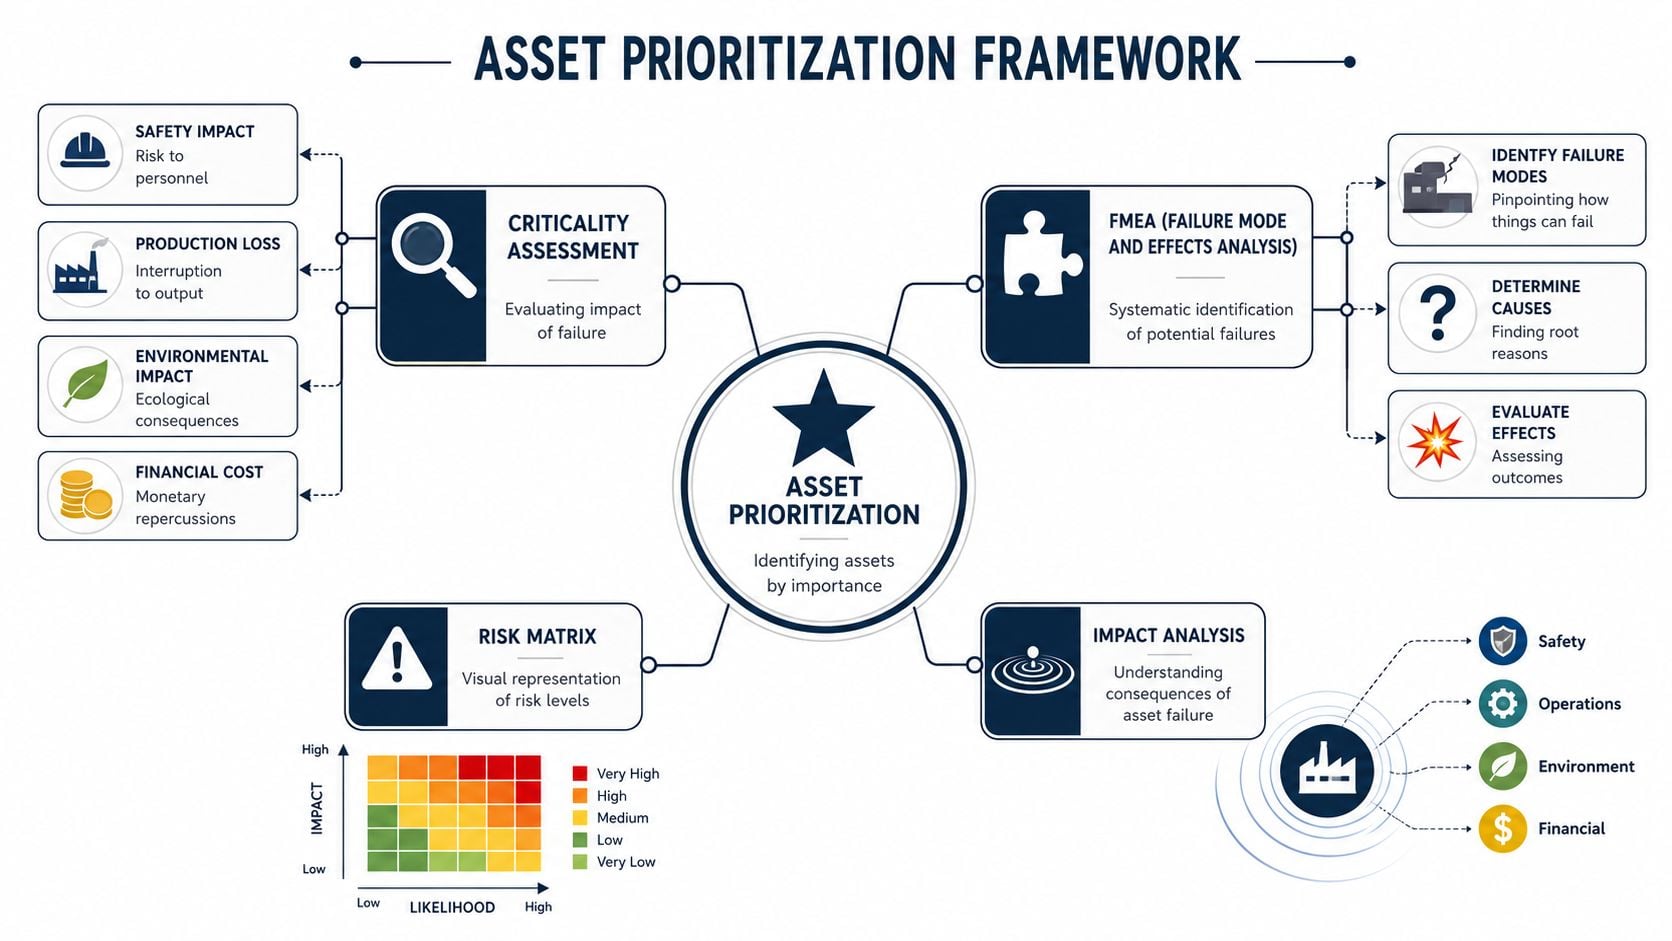
A usable criticality process doesn't need to be complicated, but it does need consistency. Most plants get better results when they score assets against several consequence categories rather than a single production score.
A practical scoring frame includes:
- Safety impact: Could failure expose people to rotating hazards, hot surfaces, pressure release, or chemicals?
- Production loss: Does failure stop the line, reduce rate, or only create inconvenience?
- Quality impact: Could failure create scrap, contamination, or process drift?
- Environmental impact: Could a leak, spill, or venting event follow?
- Maintenance burden: Is repair long, specialized, or dependent on scarce parts?
For the multi-stage pump example, probability of failure should be grounded in observed condition and failure history. Repeated seal leakage, increased bearing temperature, increasing vibration at running speed, and low suction margin all increase probability. Consequence of failure comes from what happens if the pump degrades or trips while in service. The product of those judgments determines where the asset sits in the queue.
Standard utilization advice often misses this reliability context. Broad planning guidance may suggest 75–85% utilization, but that fails for critical industrial assets that need 10–15% reserved buffer capacity for unexpected failures, as discussed in this analysis of the equity-efficiency trade-off and industrial capacity buffering.
Use FMEA to connect ranking to action
Criticality tells the plant what matters most. Failure Modes and Effects Analysis (FMEA) tells the plant why it fails and what to do about it. For the pump above, FMEA may identify several dominant failure modes:
| Failure mode | Likely cause | Detection method | Maintenance response |
|---|---|---|---|
| Mechanical seal leakage | Dry running, flush problems, misalignment | Visual checks, temperature, leakage trends | Correct flush reliability, alignment, seal installation practice |
| Bearing damage | Lubrication contamination, overload, shaft issues | Vibration analysis, ultrasound, temperature | Improve lubrication control, inspect fit and alignment |
| Impeller degradation | Erosion, corrosion, solids handling | Performance trending, inspection during outage | Material review, process control, overhaul planning |
| Cavitation damage | Poor suction conditions, vapor formation | Noise, vibration pattern, process review | Correct NPSH conditions, review system hydraulics |
High criticality without FMEA leads to blanket PMs. FMEA without criticality leads to over-analysis on the wrong equipment.
When plants carry these rankings into asset records, PM templates, and parts strategy, resource allocation optimization becomes much more disciplined. The same logic also supports lifecycle decisions. Teams working through capital repair-versus-replace questions can use an asset lifecycle management framework to keep maintenance spend tied to asset importance. Similar control principles also appear outside maintenance. Data-heavy environments use structured classification to reduce waste with IT asset management for the same reason. Inventory, ownership, and consequence have to be visible before resources can be assigned well.
Targeting Predictive Monitoring Resources
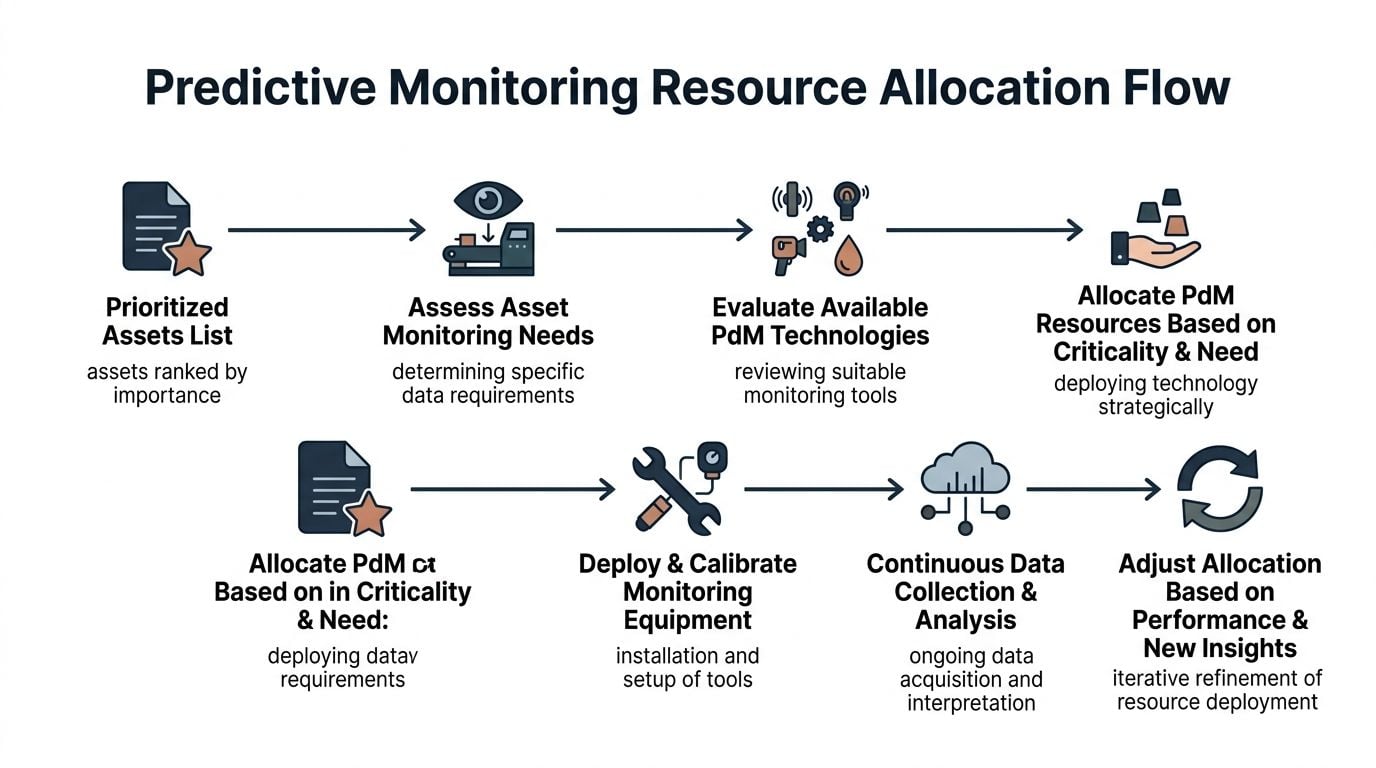
Most plants can't put every asset on continuous monitoring, and most sites don't have unlimited analyst time. That creates the practical question many managers face: how to assign scarce predictive maintenance resources across many assets, often across several sites, without relying on fixed routes that ignore current risk.
A pulp and paper mill with one unspared paper machine gearbox illustrates the point. That gearbox may justify continuous online vibration monitoring because a bearing defect, lubrication failure, or gear mesh problem can quickly threaten throughput. A less critical condensate pump in the same mill may only justify route-based vibration and periodic ultrasound. A redundant sump pump may get operator rounds and basic corrective maintenance only.
Match monitoring intensity to failure exposure
The monitoring method should fit the failure mode, not the enthusiasm for technology.
For common rotating equipment, the alignment looks like this:
- Rolling element bearings: Vibration analysis and ultrasound are typically the best early-warning choices.
- Gearboxes: Vibration, oil analysis, and temperature trends help identify wear, contamination, and load-related distress.
- Electric motors: Vibration, thermography, and motor current review can reveal imbalance, looseness, insulation stress, or electrical defects.
- Process pumps: Monitoring should include condition data plus process variables such as suction conditions, flow behavior, and seal environment.
The same machine may need different coverage depending on consequence. A gearbox on a critical line gets tighter observation than the same gearbox in a non-critical duty.
Allocate analysts by risk, not route habit
The hard part isn't choosing the technology. It's choosing who gets analyst time this week. A frequently asked question in industry is how to allocate scarce predictive maintenance resources such as vibration analysts across multiple sites with conflicting failure modes, while most existing guidance remains generic and lacks specific data on prioritizing by failure probability versus consequence of failure, as noted in this resource allocation discussion.
A practical decision queue for analyst time usually includes:
- Active alarms on critical assets
- Assets with fast-moving failure modes
- Unspared equipment with poor recent condition trends
- Chronic bad actors with repeat work order history
- Routine route points with stable condition
That approach is stronger than a calendar-only route system because it reflects actual exposure. A monthly route might be enough for a stable blower motor. It isn't enough for a reactor agitator gearbox that just showed rising vibration, increased temperature, and oil debris after a load change.
Teams building this into their condition monitoring program often need the analysis workflow, alarm handling, and model design to support the same prioritization logic. In such cases, predictive maintenance and machine learning methods become useful, especially when several signals need to be interpreted together.
Optimizing Spare Parts and Inventory Levels
Storerooms are full of mixed signals. Some shelves hold expensive parts that haven't moved in years. Other parts that fail regularly are missing the week they're needed. That isn't just an inventory issue. It's a resource allocation issue because spare parts are tied directly to downtime exposure.
A power generation facility offers a clear example. A spare gas turbine blade set can tie up a large amount of capital, but not having critical components available during a forced outage can stretch downtime far beyond what operations can tolerate. The right answer isn't “stock everything” or “cut inventory.” The right answer depends on asset criticality, failure mode, lead time, and the operational consequence of waiting.
Stock by consequence, not by fear
Plants that manage spares well usually separate items into a few decision groups:
- Critical insurance spares: Long lead time items tied to high-consequence assets. These are often stocked because waiting isn't acceptable.
- Operational spares: Parts with regular demand and manageable carrying cost, such as seals, bearings, and common instrumentation components.
- Vendor-managed or shared spares: Items for redundant or lower-risk assets where local stocking doesn't make economic sense.
- Obsolete or low-value clutter: Parts with no valid equipment linkage or no practical future use.
A compressor train example makes the difference clear. Keeping a complete spare motor for a production-critical air compressor may be justified if failure would limit plant output and replacement lead time is long. Holding multiple versions of non-standard coupling inserts for retired equipment isn't inventory strategy. It's warehouse drag.
Storerooms shouldn't answer the question “what might break someday?” They should answer “what failure can't the plant afford to wait on?”
Turn planned work into faster execution
Inventory optimization also supports planned work quality. If a planned overhaul on a boiler feed pump requires bearings, gaskets, shims, seal components, and alignment hardware, those parts should be kitted before the job starts. Kitting reduces travel, search time, and partial starts. It also exposes gaps early enough to act before the outage window opens.
The best inventory rules tie directly back to the asset ranking and maintenance strategy. For example:
| Asset condition | Parts strategy |
|---|---|
| Critical and unspared | Keep high-risk spares on site and tie them to a specific bill of material |
| Critical but redundant | Stock common wear parts locally, source major assemblies through an expedited agreement |
| Non-critical | Use reorder planning and supplier lead times, avoid excessive local stock |
| Obsolete or low-demand | Review for disposal, transfer, or deactivation from the CMMS |
Plants that want inventory discipline to hold up under budget pressure also need maintenance planning tied to financial logic. A reliability-led maintenance budgeting approach helps keep spare decisions aligned with failure consequence instead of quarter-end cuts or panic buying after an outage.
Aligning Your Workforce and Contractor Schedules
Labor usually becomes the bottleneck long before the backlog report says it does. The problem isn't always crew size. It's often poor matching between skill, task complexity, and schedule discipline.
A complex shutdown in a plastics plant shows how quickly this becomes visible. The scope includes extruder gearbox inspections, motor testing, infrared checks on switchgear, replacement of degraded coupling elements, lubrication route cleanup, and a planned overhaul on a pelletizer drive. If the planner assigns work in simple first-in, first-out order, the shutdown will look staffed on paper but fail in execution. The wrong technicians end up on precision tasks, senior specialists get pulled into routine work, and contractor hours expand because the internal team wasn't structured around competence.
Use the shutdown to expose scheduling weaknesses
The shutdown schedule should answer three questions for every job:
- What skill is required?
- What level of supervision is needed?
- What happens if this job slips?
A skills matrix becomes practical rather than administrative. If one technician is strong in precision alignment, another in motor diagnostics, and another in gearbox rebuilds, the schedule should reflect that. Competence-based planning methodologies such as CMBP integrate technician competence directly into scheduling logic and can reduce bottlenecks by up to 25%, according to this competence-based planning research.
A simple matrix often includes:
- Certified or expert: Can lead the task independently
- Qualified: Can execute with standard oversight
- Developing: Can assist and build experience
- Not qualified: Should not be assigned
That structure helps maintenance leaders protect scarce experts. A senior vibration technician shouldn't spend half a shutdown chasing general work orders if there are high-risk assets waiting for condition validation before restart.
Protect proactive work from daily interruption
Plants lose proactive work in small pieces. A PM route gets postponed for an urgent leak. A planner reassigns a technician from bearing inspections to a breakdown. Then another emergency job lands. By the end of the week, the schedule looks busy but not strategic.
A stronger model separates work into protected categories:
| Work type | Scheduling rule |
|---|---|
| Critical proactive work | Protected unless plant leadership approves displacement |
| Shutdown and outage scope | Frozen once materials, labor, and access are confirmed |
| Reactive work | Triage by criticality and consequence |
| Improvement work | Slot into planned windows after core reliability tasks are secured |
Contractors fit into this model when the plant needs surge capacity, specialty work, or non-core support. Turbine overhauls, specialized inspections, or shutdown labor peaks are common examples. Outsourcing low-value facility tasks can also free internal technicians to focus on process-critical assets.
For teams considering how digital scheduling can support that discipline, it's worth exploring AI workforce management concepts that map skills, availability, and workload. The principle still matters most on the plant floor: availability alone isn't a qualification.
Using Your CMMS for Governance and Improvement
At 6:30 on Monday morning, the maintenance meeting starts with the usual pressure. Operations wants a line back up. A supervisor wants a rush part issued. The planner is staring at a backlog that mixes real risk with noise. In that moment, resource allocation is not an abstract planning exercise. It comes down to whether the CMMS has clear rules already built in, or whether the plant falls back on whoever argues the loudest.
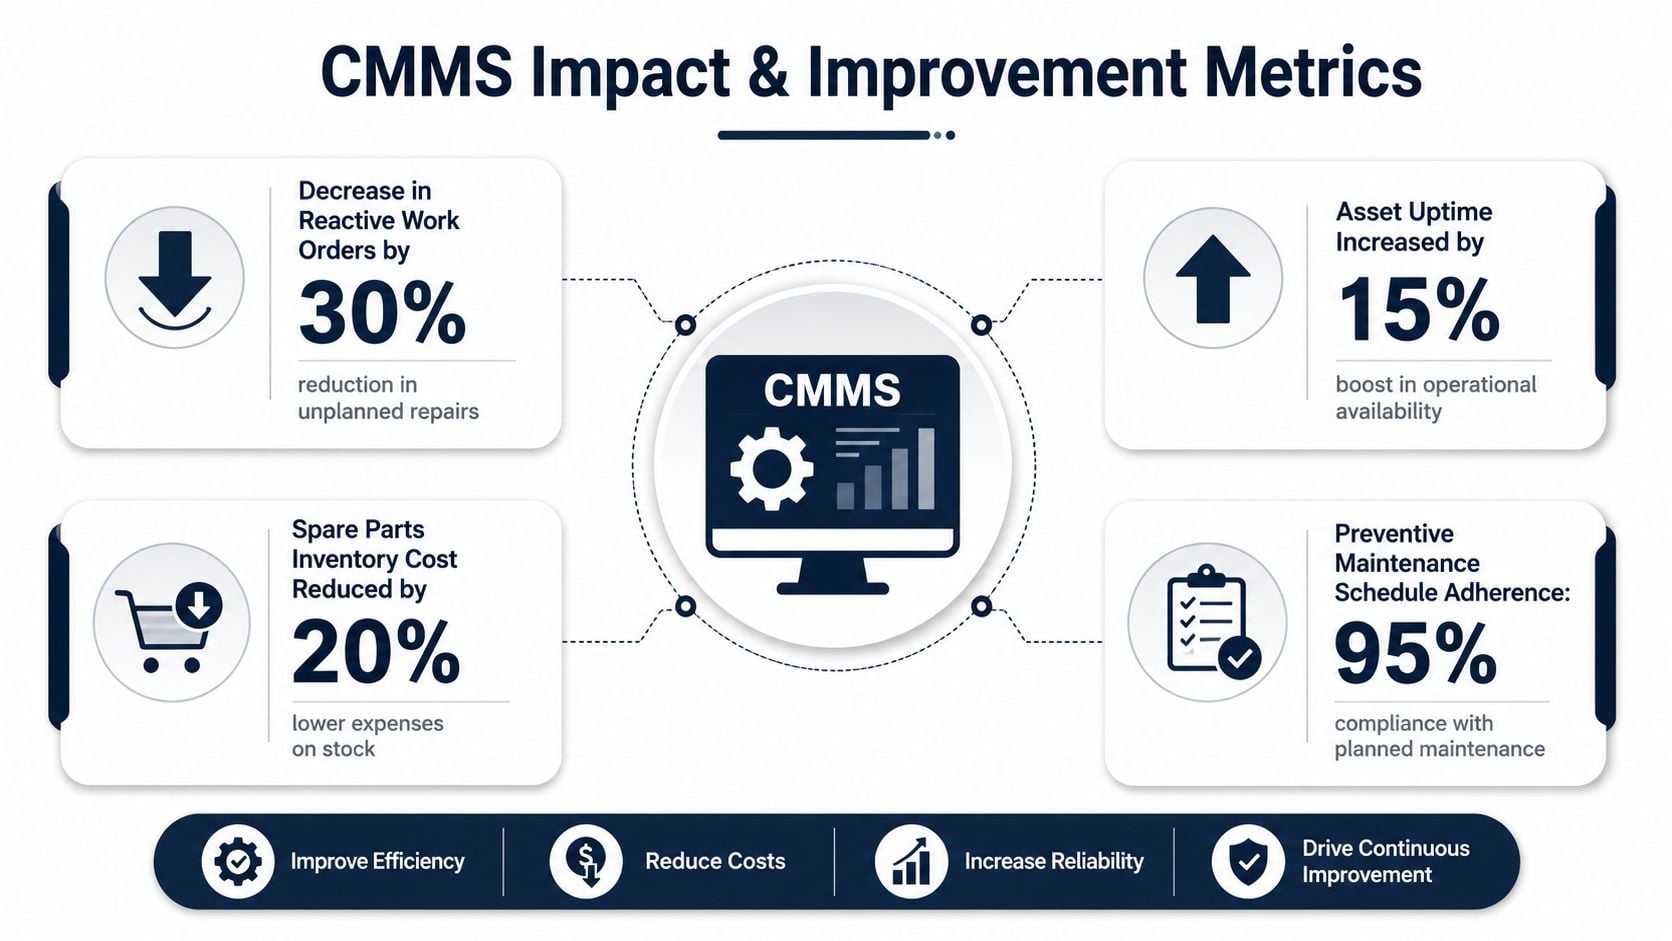
Plants get better results when the CMMS carries the logic from criticality reviews, FMEA, and RCM into daily execution. The system should decide how work is coded, how it is prioritized, what parts are tied to the asset, and what planning steps must be completed before a job is scheduled. Without that connection, reliability analysis stays in reports while the schedule drifts back toward reactive work.
A packaging plant with recurring conveyor and motor failures is a good example. The filler drive should not be managed the same way as a low-consequence utility fan. In a disciplined CMMS setup, the filler drive gets a criticality code, failure codes tied to known failure modes, a defined PM or condition-monitoring task list, linked spare parts, and escalation rules for overdue corrective work. The fan gets lighter controls because the consequence is lower. That is how engineering analysis turns into repeatable plant-floor behavior.
Configure the system to enforce plant rules
The CMMS needs a few core controls if it is going to govern resource use instead of just recording history:
- Criticality codes on each managed asset
- Failure codes that match the plant's actual failure modes
- Bills of material connected to asset records
- PM and inspection templates based on the selected maintenance strategy
- Priority rules based on consequence and production risk
- Required planning fields before a job can move into the weekly schedule
Those settings matter because they shape daily decisions. If a gearbox keeps failing from contamination, the work order history should show contamination, not a vague closeout note like "mechanical issue." If planners can see labor hours, delay codes, and repeat failures by asset, they can separate three different problems that often get blurred together: bad planning, bad execution, and a maintenance strategy that no longer fits the failure mode.
I have seen plants improve quickly just by tightening work order closure rules. Technicians had to select a real failure code, confirm the action taken, and note whether the job was found by PM, PdM, or operator inspection. Within a few months, the reliability engineer could identify which PM tasks were catching defects early and which ones were consuming hours without changing failure behavior. That is the point of governance. The CMMS should make weak assumptions visible.
A useful CMMS tells the planner what must happen next and shows leaders where the process is breaking down.
Use PMP as a control signal
Planned Maintenance Percentage is one of the clearest indicators of whether the plant is following its maintenance strategy. The exact target depends on the site, but the trend matters more than a single weekly number. If PMP keeps dropping, planned work is losing ground to breakdown response, schedule churn, or poor job readiness.
Maintenance and reliability guidance from SMRP uses planned work percentage as a core measure of planning and scheduling performance, and many plants use it to check whether labor is being consumed by preventable reactive work instead of scheduled tasks. See the SMRP Best Practices metrics overview.
When PMP slides, review the causes in the CMMS, not just the headline metric:
- A small group of assets generating repeated emergency work
- Weekly schedules released without labor hours, parts, or permits confirmed
- Storeroom shortages forcing planned jobs to wait
- Poor work order coding that hides true reactive demand
- Specialist labor assigned to low-consequence work because no rule blocks it
That review should trigger action. Reliability engineers update task lists or intervals. Planners fix job plans and material staging. Storeroom teams adjust reorder points for parts tied to critical failure modes. Supervisors clean up closeout quality and labor reporting.
Done well, the CMMS becomes the operating discipline that holds the whole resource optimization program together. It connects the FMEA and RCM work done upstream to the schedule, the storeroom, and the backlog decisions made every day on the plant floor.
Take Control of Your Maintenance Resources
Resource allocation optimization works when plants connect reliability analysis to execution rules. Criticality ranking decides what matters most. FMEA and RCM define the failure modes that deserve attention. Predictive monitoring focuses on the assets and conditions that threaten uptime. Inventory strategy supports consequence, not fear. Scheduling matches skill to task. The CMMS enforces the rules and shows when the system is slipping back into reactive behavior.
For reliability engineers, maintenance managers, and plant leaders, the main decision isn't whether optimization matters. It's whether the plant will keep improvising or put a repeatable framework in place. The facilities that improve fastest usually stop treating maintenance as a stream of isolated work orders and start managing it as a coordinated system built around risk, failure modes, and execution discipline.
A plant doesn't need more firefighting. It needs better rules, cleaner data, and a reliability strategy that holds up under real operating pressure. If that work needs an outside view, Forge Reliability offers a free reliability assessment to identify the biggest gaps in asset criticality, predictive maintenance, CMMS governance, and maintenance execution.