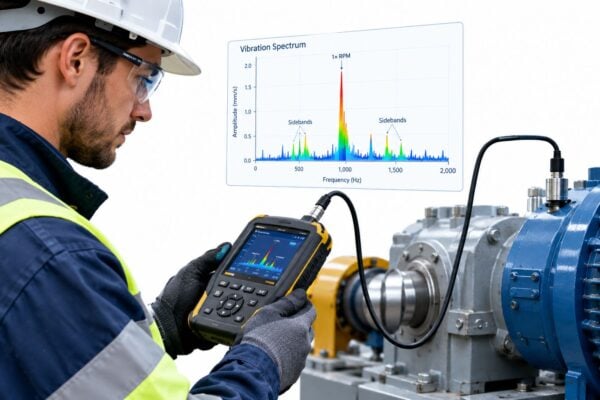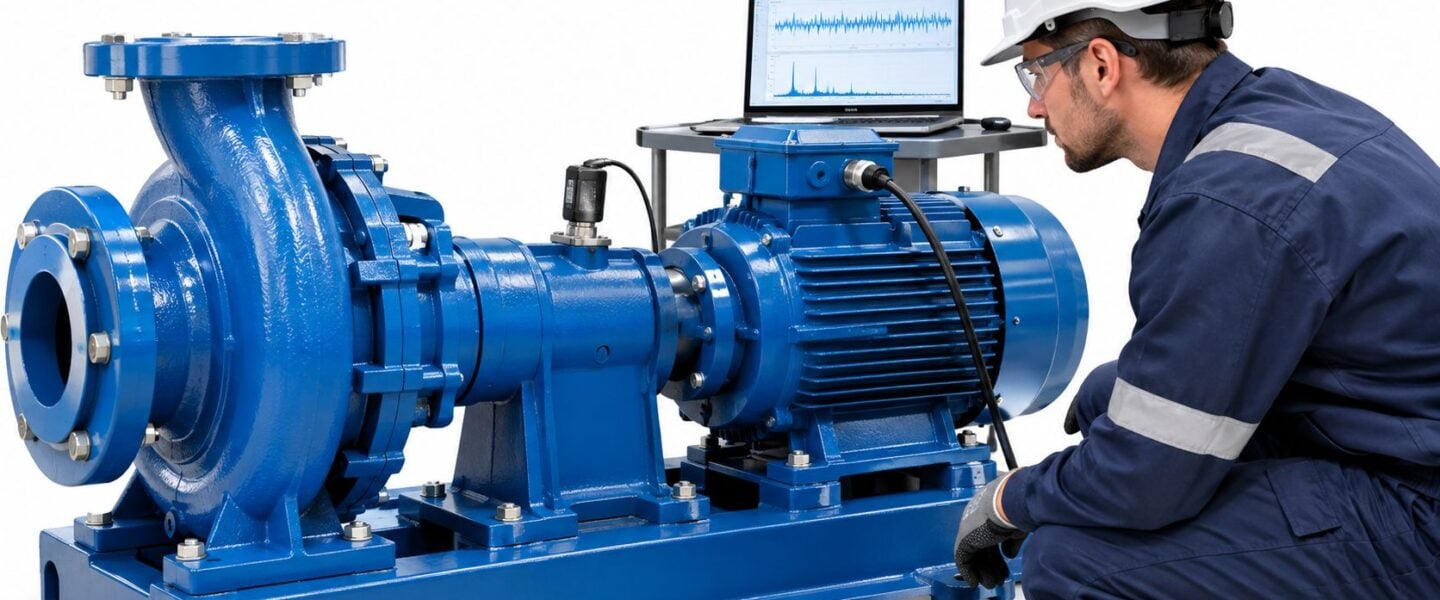
A critical process pump trips during the night shift. Operators had noticed a warmer bearing housing for weeks, but there's no vibration baseline, no comparable spectrum, and no clear record of whether the temperature changed with production load. Maintenance now has to diagnose the machine while operations waits for an answer.
A predictive maintenance vibration sensor should help prevent that uncertainty. The purchase decision, however, extends beyond the sensor: the plant needs a dependable measurement chain and a clear route from abnormal data to verified maintenance work.
Table of Contents
- Why Vibration Sensors Catch Failures Early
- How Vibration Sensors Turn Motion Into Fault Evidence
- Choosing Sensor Type, Sensitivity, and Frequency Range
- Mounting and Signal Conditioning That Protect Data Quality
- Route-Based Versus Continuous Data Acquisition
- Integrating Sensor Alarms With CMMS Work Orders
- Real Failure Cases from Pumps and Gearboxes
- Starting Your Vibration Monitoring Program This Quarter
Why Vibration Sensors Catch Failures Early
The night-shift pump problem starts before the trip. A developing mechanical defect changes how forces travel through the shaft, bearings, housing, and foundation. Measuring those changes can give maintenance personnel evidence to investigate while the machine still operates.
That evidence matters only when someone can interpret it. A rising trend might justify checking alignment, bearing condition, or foundation integrity, but it doesn't automatically identify the failed component or establish how long the machine can continue running.
Early warning needs an operational response
NIST identified vibration as a condition indicator for predictive decisions and reported 15% less downtime at facilities primarily using preventive and predictive approaches than at comparable facilities relying more heavily on reactive maintenance, according to this summary of NIST maintenance economics research. That's evidence for a maintenance strategy, not proof that installing sensors alone produces the improvement.
For a process pump, the useful outcome isn't an alarm notification. It's a defensible decision about inspection, parts procurement, operating restrictions, or planned repair.
Practical rule: Buy monitoring capability against a maintenance decision, not against the number of machines that can appear on a dashboard.
Before specifying hardware, the reliability team should establish:
- Target faults: Identify the bearing, coupling, rotor, or structural conditions the program must detect.
- Required evidence: Decide whether overall severity screening is sufficient or whether diagnostic recordings are necessary.
- Response ownership: Assign responsibility for reviewing alerts and approving maintenance actions.
- Decision criteria: Establish how the plant will apply ISO vibration standards without treating every machine alike.
These decisions determine sensor type, frequency range, mounting method, acquisition format, and integration with the maintenance system. Without them, the plant may collect more readings while leaving the original uncertainty unresolved.
How Vibration Sensors Turn Motion Into Fault Evidence
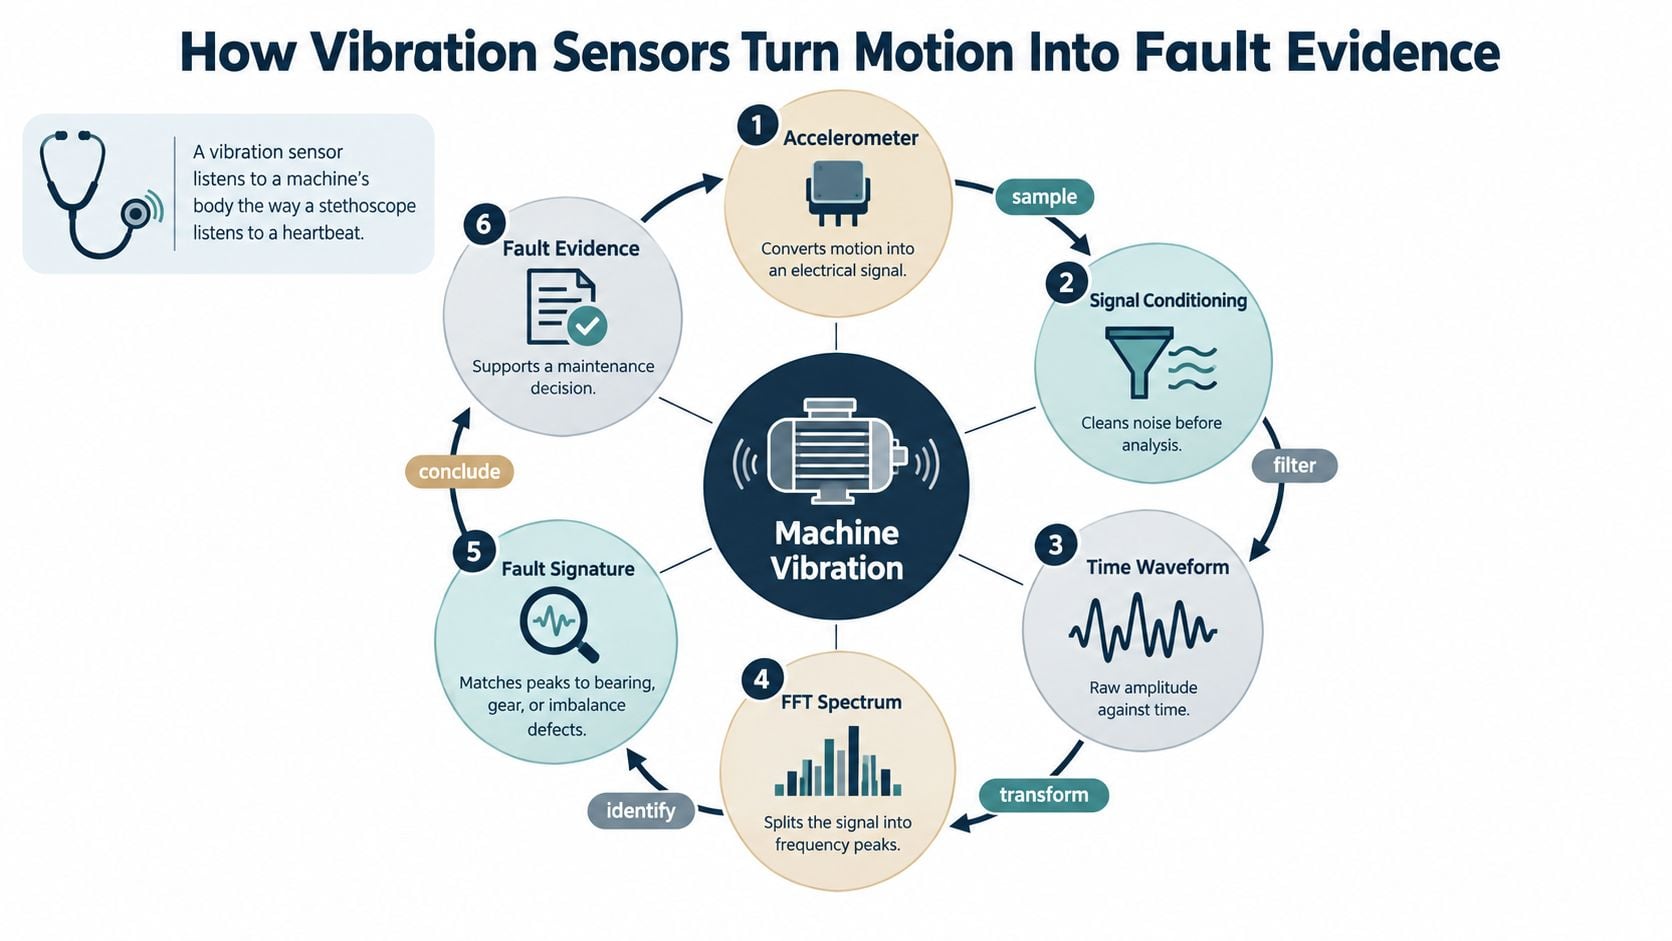
A vibration sensor works like a stethoscope on a machine. It converts mechanical motion into an electrical signal, but the signal still needs interpretation. Listening alone doesn't establish a diagnosis.
NASA describes vibration analysis as a nondestructive diagnostic method, meaning it evaluates machinery without damaging it, that can identify imbalance, shaft misalignment, and worn components. Its reliability guidance on vibration analysis also connects the technique to corrective-action selection and maintenance timing based on measured condition.
Different quantities answer different questions
Displacement describes how far a component moves. Velocity describes how quickly its position changes. Acceleration describes how quickly velocity changes.
These quantities emphasize different parts of the same motion. Displacement is useful when shaft movement is the concern; velocity supports overall rotating-machine severity assessment; acceleration is useful for examining rapid impacts associated with bearing and gear damage.
| Data view | What the analyst sees | Maintenance use |
|---|---|---|
| Overall RMS | A combined vibration level over a defined frequency band | Screen machine severity |
| Frequency spectrum | Amplitude distributed across frequencies | Investigate likely fault mechanisms |
| Time waveform | Amplitude plotted against time | Examine impacts, repetition, and transient events |
RMS, or root mean square, expresses the effective magnitude of vibration across the selected band. It's convenient for trending, but it compresses a complex signal into a single value.
A peak is a clue, not a verdict
An FFT, or fast Fourier transform, separates a recorded signal into frequency components. A peak indicates concentrated vibration at a particular frequency; interpreting it requires comparison with shaft speed, bearing geometry, gear relationships, and operating conditions.
A time waveform preserves the sequence of events. Repeated impacts may be clearer there than in an overall number, especially when brief events contribute little to the total vibration level.
On a pump, the analyst should therefore ask both whether vibration increased and what changed within the signal. A consistent vibration measurement method makes that comparison meaningful instead of forcing the analyst to compare unlike readings.
Choosing Sensor Type, Sensitivity, and Frequency Range
Sensor selection should start with the failure mechanism. A device suitable for screening motor severity may not provide enough diagnostic detail for an emerging gearbox bearing defect.
Bandwidth is the frequency range over which the measurement remains useful. Sensitivity describes how much output the sensor produces for a given vibration input. Neither specification should be evaluated separately from the acquisition system and mounting arrangement.
Vibration Sensor Families and Where Each Fits
| Sensor Type | Typical Application | Frequency Suitability | Main Limitation |
|---|---|---|---|
| Piezoelectric accelerometer | Rolling-element bearings and gearbox diagnostics | Broad response, including high-frequency impacts when correctly specified | Requires compatible electronics and a suitable mechanical installation |
| Velocity transducer | Overall severity screening on pumps, motors, and fans | Useful across the specified machine-severity band | Doesn't necessarily preserve early impact evidence |
| Proximity probe | Shaft-relative motion on sleeve-bearing machines | Suited to shaft displacement measurements | Requires an engineered probe location and target surface |
| MEMS accelerometer | Fleet screening and compact wireless installations | Depends strongly on device bandwidth and noise performance | Some devices lack the response needed for detailed diagnosis |
A piezoelectric accelerometer uses a sensing material that generates an electrical response under mechanical loading. A MEMS accelerometer, built using microelectromechanical structures, offers a different implementation whose suitability depends on its actual specifications, not its label.
A turbomachinery study evaluating MEMS accelerometers supports their use for basic condition monitoring. That doesn't establish that every compact wireless device can replace a diagnostic measurement system.
Specify the complete measurement requirement
For industrial bearing-housing measurements, ISO 20816-3 requires a flat broadband response of at least 10–1,000 Hz, as described in the ISO 20816-3 measurement requirements. A flat response means the system doesn't substantially distort vibration amplitude across the required band.
That requirement supports severity assessment. Bearing-impact diagnosis may require useful response extending into the kilohertz range, so a compliant severity reading isn't automatically a complete diagnostic measurement.
- Sensitivity and noise: Confirm that small signals remain distinguishable from the system's background noise.
- Measurement range: Ensure expected impacts won't exceed the measurable amplitude and clip the recording.
- Diagnostic access: Check whether the device provides usable waveforms and spectra, rather than only a processed health score.
- Environmental suitability: Verify temperature limits, ingress protection, hazardous-area approval where required, and compatibility with cleaning practices.
A sensor should be shortlisted only after its usable measurement range covers the fault evidence the maintenance team needs.
For accessible pump motors, economical screening may be appropriate. For a critical gearbox with costly secondary damage, retaining diagnostic data deserves more weight than minimizing sensor price.
Mounting and Signal Conditioning That Protect Data Quality
A correctly specified accelerometer can still produce misleading data when its attachment moves independently of the bearing housing. The installed measurement system, not the catalog specification, determines what reaches the analyst.
A painted, uneven, or loose contact surface can alter the mechanical response. The resulting peaks may belong partly to the installation rather than the machine.
Make the mechanical connection repeatable
| Mounting method | Practical advantage | Main caution |
|---|---|---|
| Stud mounting | Rigid, repeatable permanent connection | Requires an approved prepared mounting location |
| Adhesive pad | Permanent reference point without directly drilling the housing | Bond quality and temperature compatibility matter |
| Magnetic base | Convenient portable-route attachment | Surface condition and positioning affect repeatability |
| Handheld probe | Useful for quick checks where attachment is difficult | Contact pressure and angle vary between readings |
For high-frequency diagnostics, favor a rigid installation with a clear mechanical path from the bearing to the sensor. Avoid convenient mounting locations on guards or thin covers when the objective is bearing-housing motion.
Hot or hazardous equipment adds constraints. The sensor, cable, connector, attachment materials, and collection method must all suit the location; changing the mounting method doesn't make unsuitable equipment acceptable.
Control what the analyzer receives
Signal conditioning prepares the electrical signal for measurement. Anti-aliasing filtering removes frequency content that the acquisition system cannot represent correctly, preventing that content from appearing at misleading frequencies.
The acquisition checklist should include:
- Sampling configuration: Match the sampling rate and anti-aliasing filter to the highest frequency of interest.
- Quantity conversion: When acceleration is mathematically integrated into velocity, confirm the processing settings match the intended severity measurement.
- Speed context: Record shaft speed, using a tachometer or dependable operating signal where appropriate.
- Measurement directions: Define horizontal, vertical, and axial points at each accessible bearing.
- Operating state: Record load, process condition, and whether the equipment was running steadily or changing speed.
- Installation record: Store the mounting method, orientation, point photograph, and configuration with the asset record.
The ISO measurement guidance already discussed supports comparable bearing locations and repeatable operating conditions. Those conventions should become technician instructions, not informal knowledge held by the route specialist.
A technician replacing a sensor should also preserve its identity in the database. Otherwise, a configuration change can appear as a sudden improvement or deterioration in machine condition.
Route-Based Versus Continuous Data Acquisition
A pump that can develop a damaging fault between scheduled inspections needs a different measurement schedule from a pump whose condition changes slowly. Choose the acquisition method around fault development, access, and the time available to review evidence and act.
Route-based collection uses a portable analyzer during scheduled visits. Continuous monitoring uses installed sensors to collect data automatically, with recording and transmission intervals set by the system configuration.
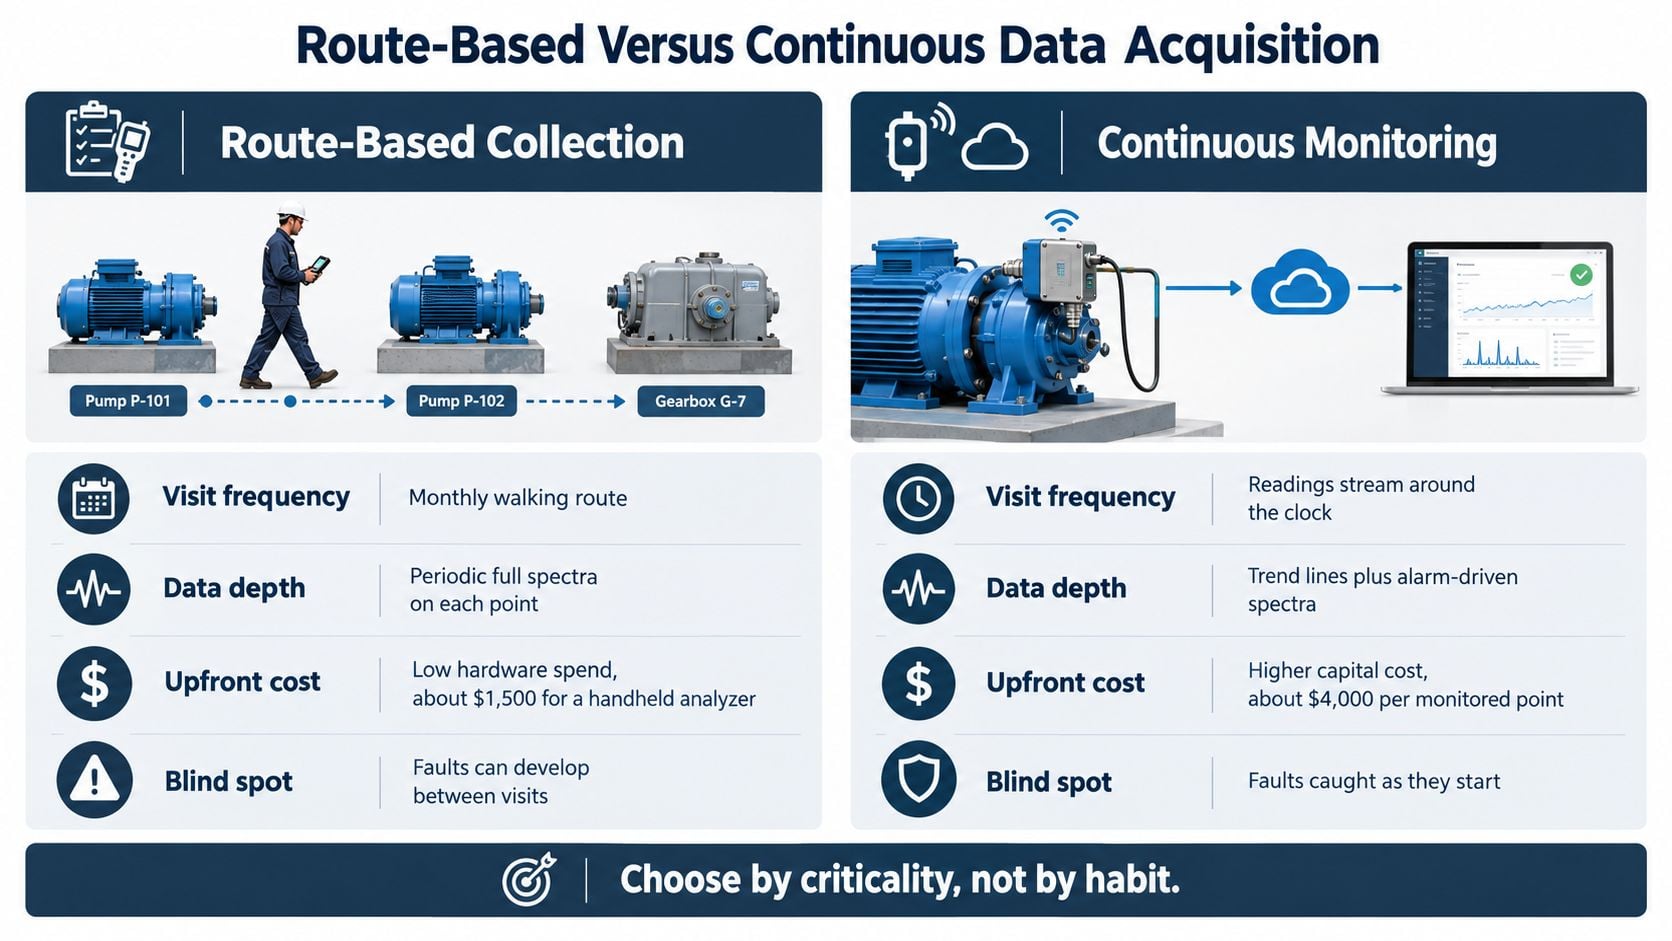
The illustration compares typical coverage and trade-offs. Set actual schedules and alarm criteria from the asset's operating conditions and the evidence the system can retain.
Compare coverage rather than convenience
| Decision factor | Route-based collection | Continuous monitoring |
|---|---|---|
| Failure development | Works when scheduled readings can provide useful warning | Suits faults that may progress between visits |
| Technician access | Requires safe, repeatable access for each reading | Reduces routine visits to difficult measurement points |
| Diagnostic flexibility | The analyst can check nearby points during the same visit | Depends on installed channels and retained data |
| Ongoing workload | Technicians collect readings, and analysts review them | Staff monitor sensor health, communications, and exceptions |
| Equipment consequence | Often fits assets with lower consequences of failure | Better justified when interruption has severe consequences |
On a route, an analyst can change the setup, recheck an abnormal point, and inspect nearby bearings or connected equipment. That flexibility depends on technician access and the quality of the measurement procedure. Repeatable locations and mounting matter: a change in sensor position can look like a change in machine condition.
Continuous systems add measurements between visits. Continuous collection only creates value when someone reviews exceptions and recognizes missing evidence. A sensor can flag a change, but the reading alone may not establish the fault or show whether the alarm reflects operating conditions, installation, or a developing defect.
Build the financial case around consequences
Compare the cost of monitoring with the consequences the program is meant to reduce: production loss, emergency labor, expedited parts, and secondary damage. Include hardware, installation, analysis, communications, and ongoing maintenance. A low-cost measurement point has little value if it cannot capture evidence of the failure the plant needs to detect.
A hybrid program can allocate coverage by asset consequence. Install sensors where fault speed, access constraints, or interruption risk make scheduled readings inadequate, and use technician routes for other equipment. Select vibration analysis tools around the measurements and review process required, rather than applying one hardware setup across the plant.
Decision rule: Use continuous acquisition when the fault's development and potential consequences justify coverage between scheduled visits. Plan who reviews exceptions and how findings lead to a maintenance decision.
Integrating Sensor Alarms With CMMS Work Orders
An alarm should initiate a controlled decision, not automatically authorize a component replacement. The CMMS, or computerized maintenance management system, should preserve the evidence, assign ownership, and record what technicians found.
ISO severity zones provide a starting framework, but their limits depend on machine group and support stiffness. They aren't universal pump or motor thresholds.
Apply machine-specific limits
For rigidly supported machines, the published machine-group vibration boundaries are:
| Machine group | A/B boundary | B/C boundary | C/D boundary |
|---|---|---|---|
| Group 1, above 300 kW | 2.3 mm/s RMS | 4.5 mm/s RMS | 7.1 mm/s RMS |
| Group 2, 15–300 kW | 1.4 mm/s RMS | 2.8 mm/s RMS | 4.5 mm/s RMS |
All numerical limits in this table come from the linked machine-group guidance.
Zone C indicates vibration unsuitable for unrestricted long-term operation. Zone D indicates severity likely to cause damage. Crossing the applicable B/C boundary should trigger engineering review; approaching or exceeding C/D warrants urgent assessment under the plant's operating and safety procedures.
A rate-of-change alarm detects a meaningful increase relative to the established condition, even before an absolute severity boundary is reached. It complements the machine-class limits rather than replacing them.
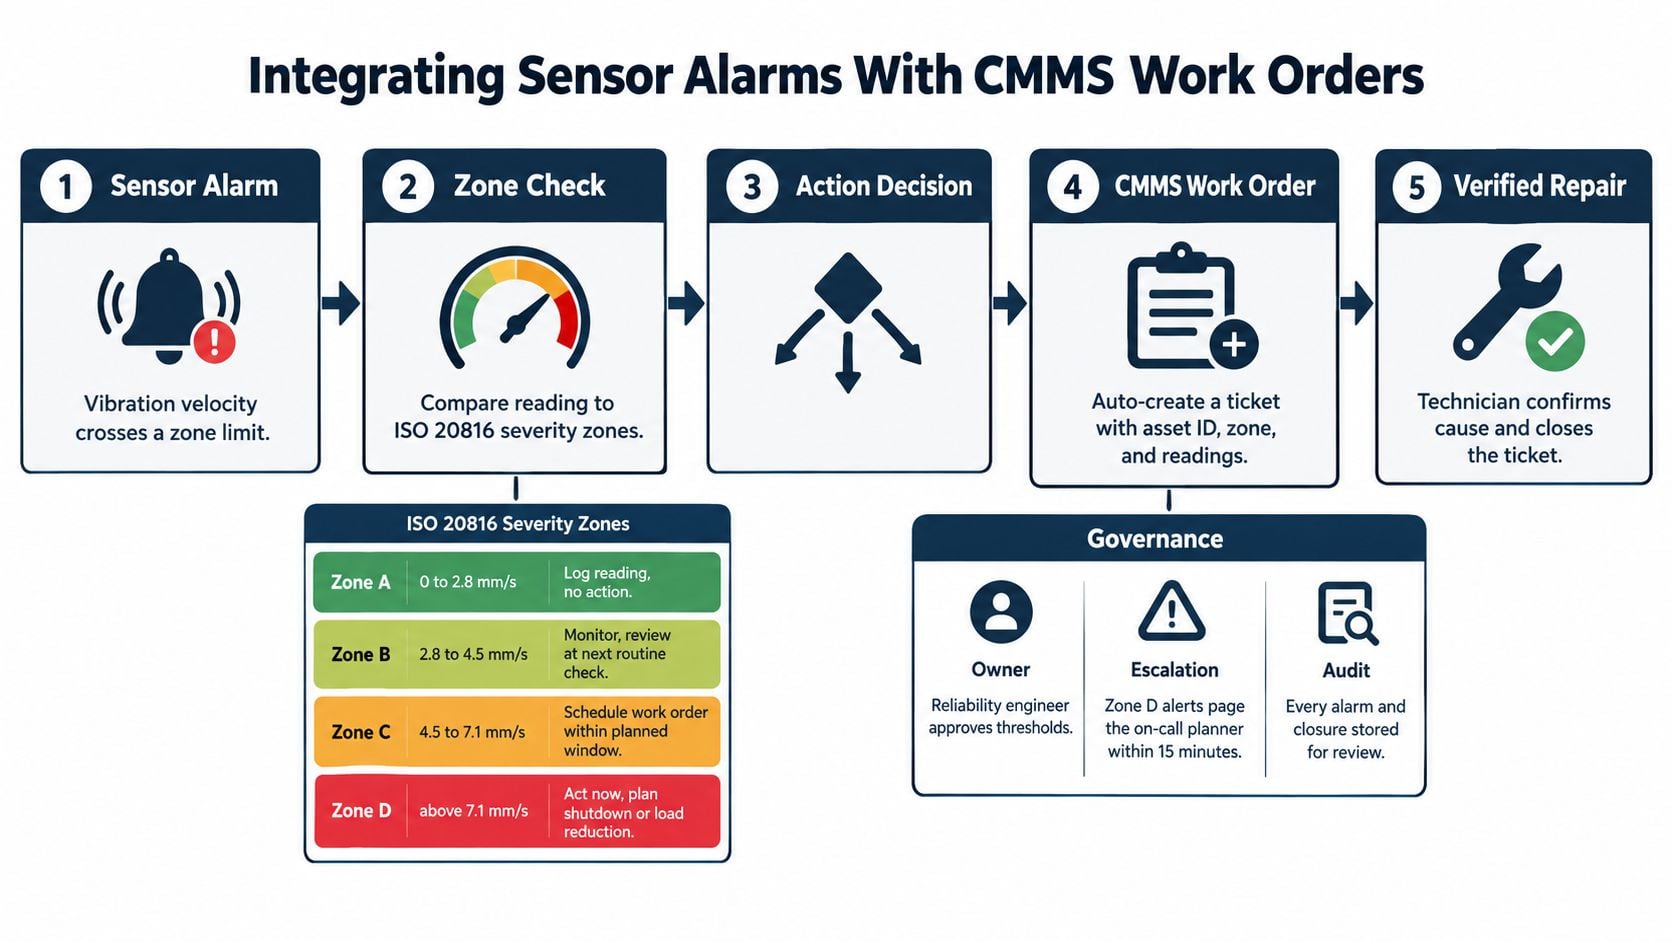
Use the machine-specific table above, not the illustration's simplified zone scale. Escalation timing must follow site-approved requirements.
Validate, assign, and verify
- Check measurement validity: Confirm attachment, sensor health, cable condition, timestamps, and operating state before treating an isolated change as a mechanical fault.
- Resolve uncertainty: Compare an equivalent operating condition or obtain route-based confirmation when the installed data are incomplete.
- Create actionable work: Include asset identity, measurement location, trend, supporting recordings, suspected mechanism, required inspection, and responsible owner.
- Record physical findings: Capture alignment results, looseness, bearing condition, lubrication observations, and the actual repair.
- Verify the result: Collect comparable post-maintenance measurements and update failure codes and baseline status.
A review of predictive-maintenance implementation challenges identifies missing data, sensor failures, inconsistent measurements, and changing operating conditions as barriers. A lost transmission must therefore appear as a monitoring coverage problem, not as evidence that vibration has returned to normal.
Governance checkpoint: Close the maintenance loop only when the finding and post-repair evidence support the work performed.
Effective work-order management also prevents duplicate tickets from repeated alerts. The existing investigation should retain subsequent evidence until the responsible engineer changes its priority or closes it.
Real Failure Cases from Pumps and Gearboxes
A rising vibration trend only becomes useful when the team connects it to operating conditions, diagnostic evidence, and a practical inspection decision. The scenarios below illustrate maintenance reasoning; they are not documented customer outcomes or savings claims.
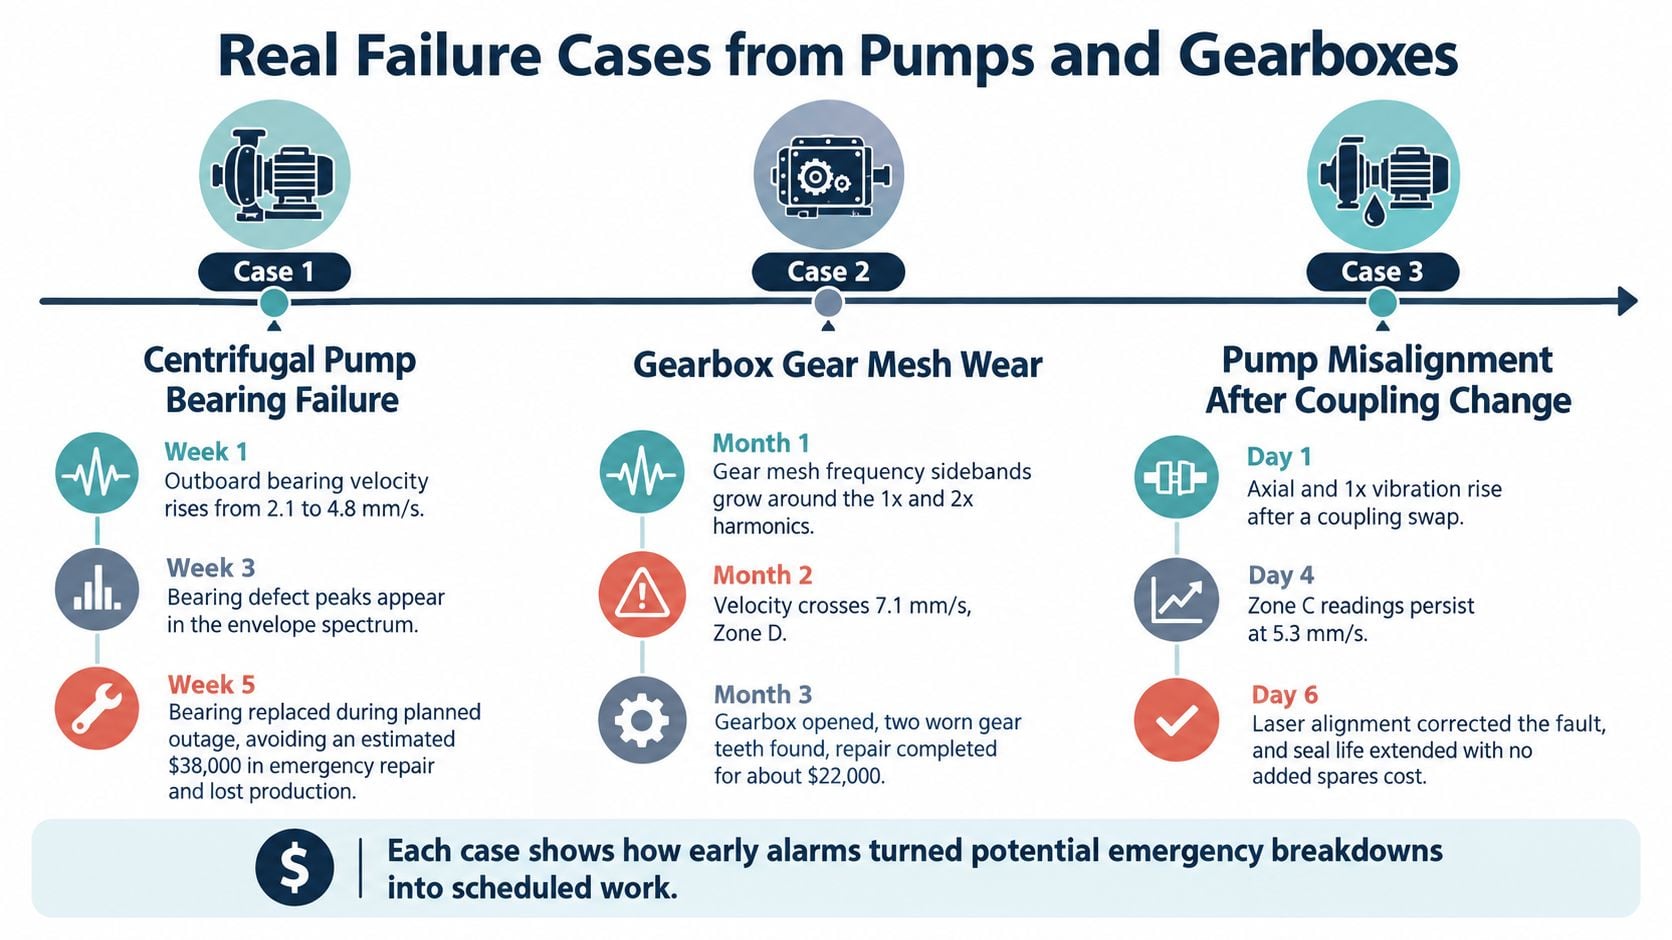
Centrifugal pump with rising housing vibration
A process pump develops a rising bearing-housing trend. Before calling for bearing replacement, the maintenance team checks coupling alignment, soft foot, meaning uneven support beneath the machine feet, foundation condition, and impeller balance.
The diagnostic choice depends on vibration direction, operating state, and spectral content. If axial vibration dominates after coupling work, investigate alignment. If the structure moves, inspect the support and foundation. Replacing a bearing without addressing the initiating condition can leave the source of vibration in place.
Set the inspection scope around the evidence. Confirm sensor location and comparable operating conditions so the trend reflects machine behavior rather than a measurement change.
Steel mill gearbox with stable overall velocity
A gearbox output bearing produces increasing impact evidence while overall velocity remains stable. The analyst examines bearing characteristic frequencies, calculated frequencies associated with bearing geometry and speed, and an envelope spectrum, a processed view used to reveal repetitive impacts.
A peer-reviewed evaluation of early bearing-fault detection found that the lowest-frequency velocity-RMS method warned only very late in the experiment. A stable overall value therefore does not establish that the bearing is healthy.
Confirm the impact pattern, check lubrication and load, and prepare corrective work before advanced surface flaking, or spalling, spreads debris through the gearbox. Use gearbox vibration troubleshooting guidance to distinguish bearing evidence from gear-mesh excitation. The alarm should support an inspection decision, with the suspected mechanism and supporting recording available to the person assigned to act.
Food-processing conveyor with an outer-race defect
A conveyor gearbox shows repeatable spectral peaks consistent with an outer-race defect. Early planning can focus on confirming the pattern, checking replacement-part availability, arranging sanitation access, and selecting a production window.
A University of North Dakota thesis on bearing deterioration describes progression from identifiable defect-frequency peaks to late-stage random noise concentrated around 2–5 kHz. Disappearing discrete peaks can indicate advanced deterioration rather than recovery.
When evidence points to advanced damage, planners should weigh the combined measurements and failure consequence, then consider load reduction or controlled shutdown under site procedures. Record the physical finding against the alarm so future decisions can be checked against what inspection revealed.
Starting Your Vibration Monitoring Program This Quarter
A focused pilot is easier to evaluate than a plant-wide installation with uncertain objectives. Select a manageable group of critical assets whose failure mechanisms, operating states, and maintenance histories are understood well enough to test the complete decision loop.
The pilot should include equipment that exposes meaningful differences: a steady-duty process pump, a variable-load gearbox, and a motor whose measurement points are difficult to access. That provides a stronger acceptance test than instrumenting only convenient machines.
Define acceptance before scaling
- Coverage: Confirm that the installed measurements can detect the intended failure mechanisms.
- Repeatability: Demonstrate comparable readings under equivalent operating conditions.
- Continuity: Make missing data and failed sensors visible to the monitoring owner.
- Actionability: Test whether an alert reaches the right person with enough evidence to make a decision.
- Feedback: Confirm that inspection findings and post-repair measurements return to the asset record.
Establish baselines before finalizing normal-condition alarms. Review the pilot after a complete planned-outage cycle so the team can compare diagnostic recommendations with physical findings and maintenance execution.
Scaling should depend on that evidence, not on how quickly technicians can attach more sensors. A deployment that generates alerts without verified findings needs process correction before wider rollout.
This week's practical action is to assemble the critical-asset list, existing sensor inventory, available vibration history, and recurring-failure work orders. Those records give an assessment team a concrete starting point for identifying diagnostic gaps, unreliable measurements, and assets that warrant instrumentation first.
Forge Reliability offers a free reliability assessment to map critical assets, existing vibration coverage, data-quality risks, and the route from alarms to maintenance work. Visit Forge Reliability to request the assessment and identify which assets should be instrumented first.