
A pump trips in the middle of the night. Operations sees high vibration on the screen, maintenance swaps a bearing, and the machine still shakes on restart. That cycle is common in plants that measure vibration without a clear decision process behind the measurement.
Reliable vibration work starts earlier than the test point. It starts with a simple question: what failure mode is this machine most likely to show, and what signal will expose it? A cooling tower fan with looseness, a gearbox with tooth damage, and a process pump with cavitation won't reward the same measurement setup.
Teams that want fewer surprises need more than a handheld reading. They need a method that connects machine type, sensor choice, measurement location, data capture, and interpretation. That's the difference between reactive work and a condition-based program built around asset risk, not guesswork. Plants making that shift often begin by clarifying the difference between predictive vs preventive maintenance, then tightening the way field data is collected and acted on.
Table of Contents
- Introduction From Reactive Chaos to Predictive Control
- Matching the Sensor and Metric to the Machine
- Establishing Repeatable Measurement Points and Mounting
- Configuring Data Acquisition for Diagnostic Clarity
- From Raw Data to Specific Fault Diagnosis
- Documenting Results and Troubleshooting Complex Issues
- Turn Your Data Into a Downtime Prevention Plan
Introduction From Reactive Chaos to Predictive Control
Plants rarely struggle because they don't own a vibration meter. They struggle because the readings don't consistently answer the question that matters. What is failing, how confident is the diagnosis, and what action should happen next?
That gap shows up every day on critical assets. A motor-pump set gets flagged for high vibration, but the route only collects one overall value. A gearbox sounds rough, but the data doesn't include enough spectral detail to separate gear mesh from bearing activity. A fan foundation vibrates hard enough to trigger alarms, yet the rotor is not the root cause.
High vibration by itself is not a diagnosis. It's only a prompt to ask better questions.
Learning how to measure vibrations properly means building a repeatable chain from machine scope to final recommendation. The chain starts with the asset and its likely failure modes. It continues through sensor selection, mounting, orientation, and analyzer settings. It ends with documentation that maintenance can turn into a planned correction rather than an emergency repair.
A food processing facility offers a simple example. A belt-driven fan serving a packaging line may show a strong running-speed vibration in one direction and relatively little in another. If the team doesn't capture horizontal, vertical, and axial data from repeatable points, it may confuse soft foot, imbalance, belt issues, or structural amplification. The machine hasn't changed. The measurement method has.
Matching the Sensor and Metric to the Machine
Choosing the right sensor is where most vibration programs either gain clarity or lose it. The wrong transducer can still produce a clean reading and still lead the team to the wrong conclusion.
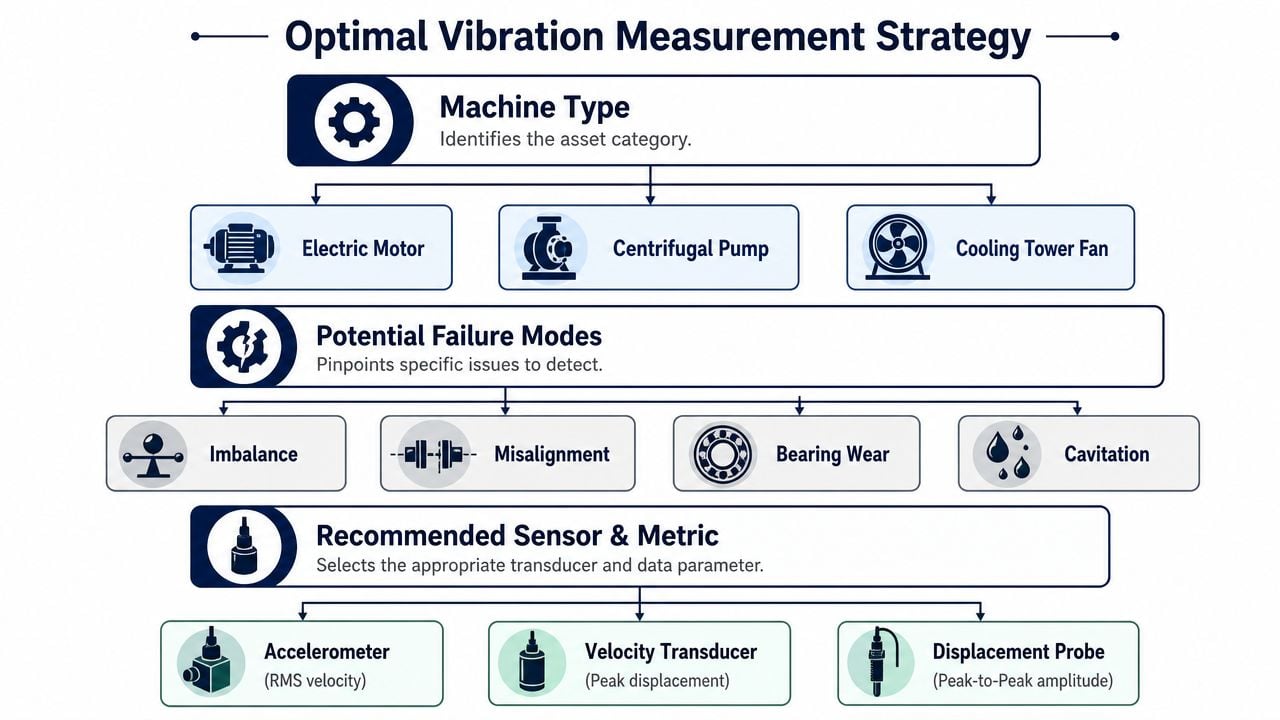
Start with the failure mode, not the instrument
For industrial assets, the setup depends on the machine and the frequency band of interest. Neutral technical guidance separates the job this way: displacement suits low-frequency shaft vibration, velocity suits overall machine condition and severity, and acceleration suits high-frequency bearing and impact faults, as outlined in this technical overview of vibration measurement methods.
That distinction matters because different machines fail in different ways:
- Large sleeve-bearing machines: Shaft motion is often the first issue to watch. Proximity probes that measure displacement are the right fit when the concern is shaft vibration relative to the bearing.
- General rotating equipment: Motors, fans, and many pump trains benefit from velocity for overall condition. It's practical for severity checks and trending.
- Rolling-element bearing and impact faults: Accelerometers are the workhorse when the target is early bearing damage, impacting, or high-frequency energy.
A team building or refining a vibration monitoring program for plant equipment should map each critical asset to likely failure modes before it standardizes routes, alarms, or channel counts.
A pump example that shows the trade-off
Consider a multistage centrifugal pump in chemical service. If the route collects only an overall velocity value, the team may get a decent indication of general severity while missing early signs of bearing distress or hydraulic problems. That's the trap.
A pump can have acceptable-looking overall condition and still generate high-frequency activity associated with cavitation, turbulence, or early bearing damage. In that case, acceleration is often more revealing than a broad overall velocity number.
Practical rule: Don't ask one metric to do every job. Overall velocity is useful for machine severity. It can also be blind to the fault that matters most.
A short comparison makes the choice clearer:
| Sensor or metric | Best fit | What it can miss if misused |
|---|---|---|
| Displacement | Shaft vibration on machines where shaft motion is the concern | High-frequency bearing activity |
| Velocity | Overall machine condition and severity trending | Early bearing and impact-related faults |
| Acceleration | Bearing wear, impacts, cavitation, turbulence | Shaft-relative motion on machines that require displacement measurement |
The practical lesson is simple. Don't start with “how is vibration measured?” Start with “what is this asset likely to do when it begins to fail?”
Establishing Repeatable Measurement Points and Mounting
Bad mounting and inconsistent test points can ruin an otherwise solid program. If the sensor sits in a different place, at a different angle, or with a different connection every month, the trend won't mean much.
Where to place the sensor on a real machine
Take a motor-fan unit as the example. Standard field practice is to establish repeatable points on each bearing housing in horizontal, vertical, and axial directions. Each orientation tells a different part of the story.
- Horizontal readings: Often reveal issues tied to looseness, balance response, and structural flexibility.
- Vertical readings: Often show how the machine reacts through its support and base.
- Axial readings: Frequently help expose coupling problems and misalignment patterns.
The key isn't just taking readings in three directions. The key is taking them at the same marked points, with the same orientation, under comparable operating condition every time. A route that changes points from month to month creates artificial variation that looks like machine behavior.
For plants formalizing routes, a structured vibration monitoring route setup guide helps keep locations, directions, and naming conventions consistent across technicians.
Mounting quality decides data quality
Sensor application is a major source of error. Technical guidance notes that the mass of an accelerometer should be no more than 10% of the test structure's mass, and that poor mounting methods such as a weak magnet or long stinger can degrade the sensor's usable frequency range and distort signatures tied to unbalance, misalignment, and resonance, as described in this accelerometer application reference.
That has direct field consequences. On a small sheet-metal guard or a light bracket, a heavy sensor can alter the response of the very structure being measured. On a gearbox or motor housing, a rocking magnet can suppress or smear high-frequency content.
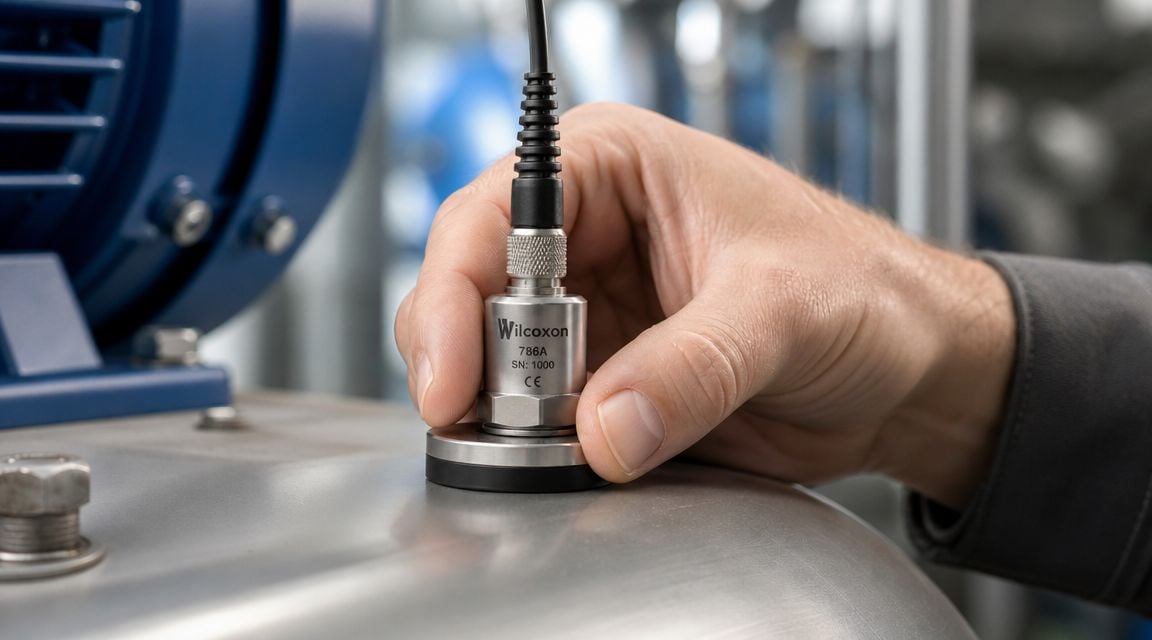
A practical mounting hierarchy usually looks like this:
- Stud mount when accuracy matters most. This gives the best mechanical connection and the strongest high-frequency fidelity.
- Use a clean magnetic base when route speed matters. It's common in industrial rounds, but only when the surface is clean, flat, and stable.
- Avoid casual hand-held contact for diagnostic work. It may be acceptable for a quick screening check, but not for trending or fault confirmation.
Clean, bare, flat metal is not a nice-to-have. It's part of the measurement system.
Before recording, the technician should also check for paint buildup, curved surfaces, weak magnetic hold, and cable movement that can contaminate the signal. If a reading looks strange, the first suspect should be the setup, not the machine.
Configuring Data Acquisition for Diagnostic Clarity
A properly mounted sensor still won't help if the analyzer is configured to ignore the fault, causing many vibration measurements to become too shallow to diagnose anything beyond “it's vibrating.”
Set the frequency range to match the machine
The first major setting is the frequency range, often handled through Fmax. If Fmax is too low, high-frequency defects never appear in the spectrum. If it's too high, the analyzer spreads available detail across a wider band and the spectrum may lose useful separation.
A slow gearbox in a pulp and paper application is a good example. The team may care about running speed, harmonics, gear mesh, and gear mesh sidebands. That means Fmax has to cover the frequencies needed to see those patterns clearly. A low setting might be enough for basic running-speed issues but not enough for gear damage investigation.
For a high-speed motor with anti-friction bearings, the target band usually shifts upward because bearing-related energy sits much higher than simple running-speed vibration. That's why one analyzer setup won't suit every route.
A focused motor vibration analysis workflow usually separates general motor condition checks from measurements intended to expose bearing and electrical-related patterns.
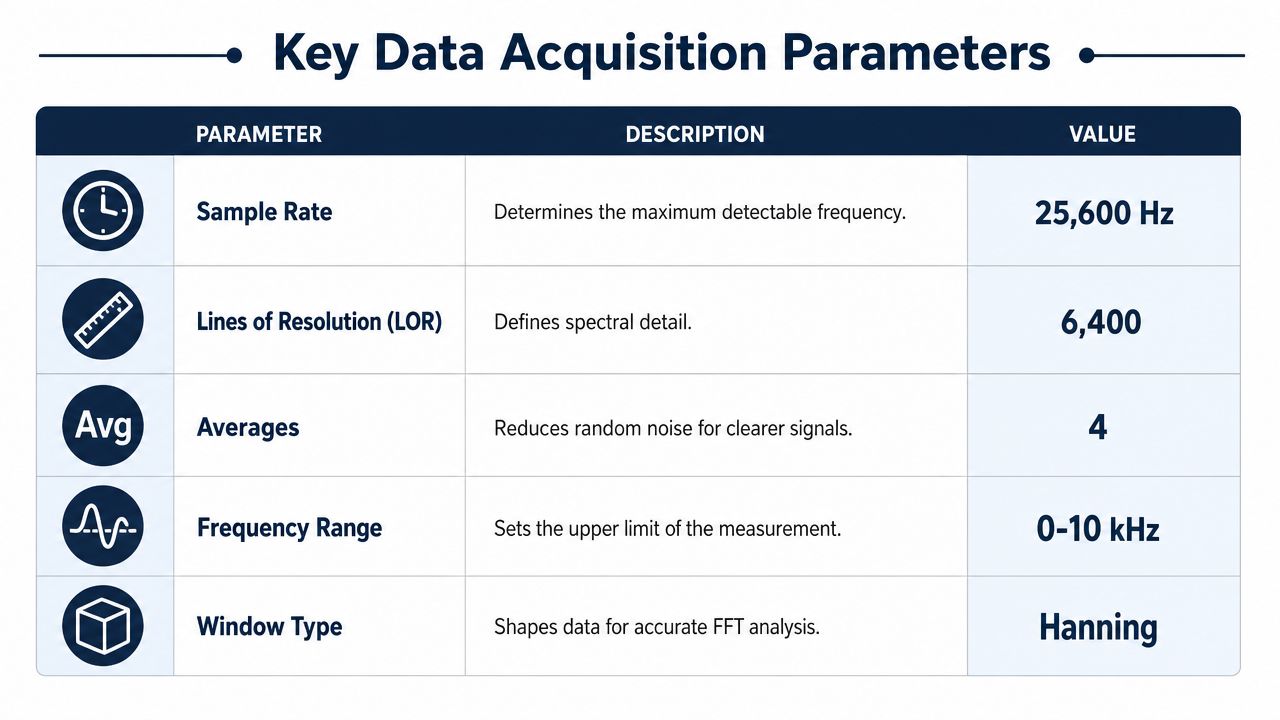
Choose resolution and windowing with a purpose
Resolution controls how finely the FFT separates nearby frequencies. More lines of resolution give a sharper spectrum, which helps when frequencies sit close together. Too little resolution turns several nearby components into one broad lump.
Windowing matters for signal presentation. A Hanning window is commonly used for rotating equipment because it helps manage leakage when the captured signal doesn't land neatly within the sampled time record.
The practical trade-offs look like this:
- Low resolution: Faster collection, but peaks blend together and sidebands become harder to trust.
- Higher resolution: Better separation of close frequencies, but more time is needed and route efficiency drops.
- Wrong frequency range: The fault may be absent from the display even though the machine is generating it.
A clean setup usually asks three questions before any route is locked in:
| Setting | What the technician is deciding |
|---|---|
| Frequency range | Which fault frequencies must be visible |
| Resolution | How clearly close components must be separated |
| Window type | How the signal should be conditioned for reliable FFT interpretation |
When technicians understand those choices, analyzer settings stop looking like software clutter and start looking like diagnostic controls.
From Raw Data to Specific Fault Diagnosis
The analyzer gives two views that matter most in routine machine diagnostics: the time waveform and the FFT spectrum. A reliable diagnosis usually needs both.
Why the time waveform and FFT must be read together
A practical industrial workflow starts by defining machine scope and measurement points, establishing baseline readings on healthy equipment, then collecting data with an accelerometer and reviewing both the time waveform and FFT spectrum. In that same workflow, velocity in mm/s is used as a strong benchmark for rotating-machine severity, while acceleration is preferred for early-stage bearing defects and high-frequency effects such as cavitation or turbulence in pumps, as described in this industrial vibration analysis workflow reference.
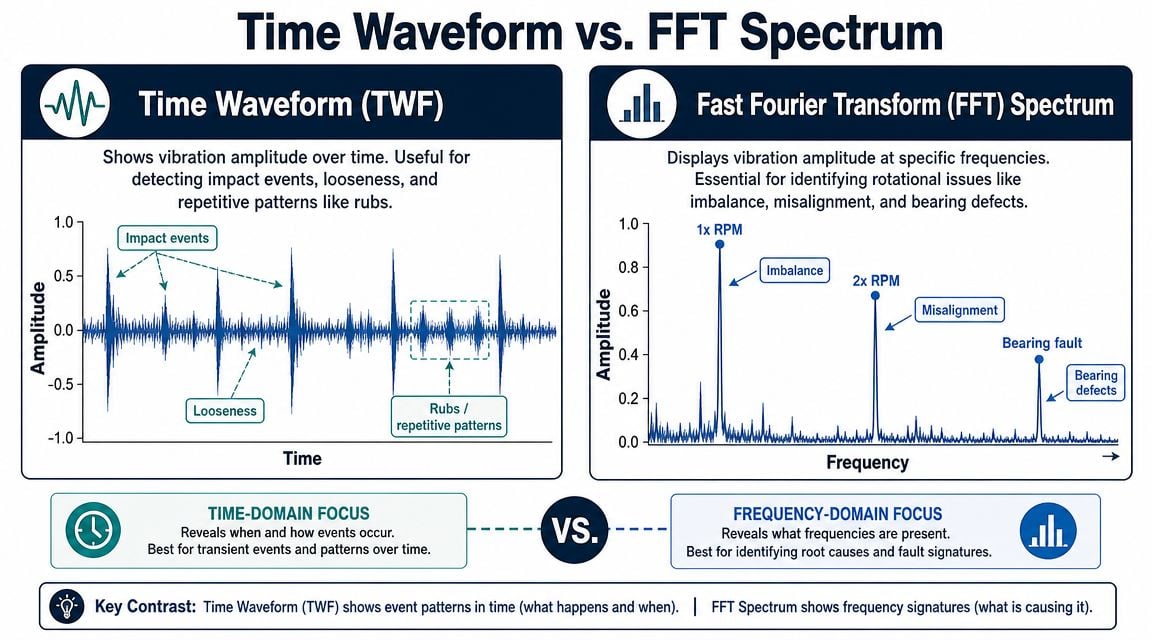
The time waveform shows amplitude over time. It's excellent for exposing repeating impacts, modulation, rubs, and intermittent events that can hide inside an overall value. On a gearbox, a damaged tooth may create a repeating impact pattern long before a broad severity metric tells a clear story.
The FFT converts that same signal into frequency content. That's the map used to connect vibration energy to mechanical sources such as running speed, harmonics, bearing frequencies, and gear mesh.
The waveform shows behavior. The spectrum shows where that behavior lives in frequency.
What common fault patterns usually look like
On common plant assets, several patterns appear again and again:
- Unbalance: Often presents as a dominant peak at 1x running speed.
- Misalignment: Frequently shows stronger activity at 2x running speed, often with axial involvement.
- Mechanical looseness: Commonly creates multiple harmonics of running speed rather than one clean dominant peak.
- Bearing defects: Often need acceleration data and careful frequency interpretation because the earliest clues sit in higher-frequency bands.
- Gear damage: May show gear mesh activity and sideband structure, with impacts often visible in the waveform.
A conveyor drive gearbox in a bulk handling plant is a good example. If the FFT shows running-speed harmonics plus a rough, impacting waveform, the analyst shouldn't stop at “gearbox vibration high.” The primary task is to separate looseness, gear tooth damage, and structural response.
For teams trying to tighten bearing diagnostics, this bearing fault detection resource is one practical path for linking spectral patterns to rolling-element damage.
Using severity tables without losing the diagnosis
Severity charts are useful, especially when velocity RMS is being used to judge overall machine condition. They help answer whether a machine is operating in a generally acceptable range. They do not answer what component is failing.
Below is a field-friendly format many teams use to frame velocity severity under the heading requested.
| Machine Class | Good (mm/s) | Satisfactory (mm/s) | Unsatisfactory (mm/s) | Unacceptable (mm/s) |
|---|---|---|---|---|
| Class I | Refer to the applicable plant standard or ISO document | Refer to the applicable plant standard or ISO document | Refer to the applicable plant standard or ISO document | Refer to the applicable plant standard or ISO document |
| Class II | Refer to the applicable plant standard or ISO document | Refer to the applicable plant standard or ISO document | Refer to the applicable plant standard or ISO document | Refer to the applicable plant standard or ISO document |
| Class III | Refer to the applicable plant standard or ISO document | Refer to the applicable plant standard or ISO document | Refer to the applicable plant standard or ISO document | Refer to the applicable plant standard or ISO document |
| Class IV | Refer to the applicable plant standard or ISO document | Refer to the applicable plant standard or ISO document | Refer to the applicable plant standard or ISO document | Refer to the applicable plant standard or ISO document |
That table is useful for prioritization. It's incomplete without fault identification. A pump can sit in a tolerable overall velocity range and still show acceleration evidence of early bearing distress or hydraulic instability. That's why severity and diagnosis have to stay separate in the analyst's mind.
Documenting Results and Troubleshooting Complex Issues
Measurement only creates value when someone can act on it. A good vibration report should let a planner, supervisor, or reliability engineer decide what to inspect, when to schedule it, and how urgent the work really is.
What a useful vibration report needs
A report doesn't need to be long. It needs to be unambiguous. On a motor-driven blower, for example, the document should identify the exact asset, exact location, operating state, and what changed since the last collection.
A strong report usually includes:
- Asset identity: Equipment tag, train description, and measurement location.
- Operating context: Running speed, load condition, and whether the machine was steady-state during collection.
- Measured condition: Overall values, dominant frequencies, and whether the signal came from velocity, acceleration, or displacement.
- Diagnostic statement: The most likely fault, competing possibilities, and confidence level.
- Action recommendation: Inspect, correct at next outage, monitor at shorter interval, or intervene immediately.
That format is what makes trending useful inside a CMMS. A planner can connect the vibration finding to an alignment task, a bearing inspection, a balance job, or a structural review instead of leaving the note at “high vibration observed.”
When the structure is the problem
Not every high reading points to a machine defect. Structural resonance can amplify relatively small forcing energy into a large vibration response, and foundation measurements may be needed to sort that out, as described in this structural vibration testing and resonance discussion.
That matters most on assets with variable speed, flexible bases, raised steel, and changing loads. A fan on a light platform may show dramatic vibration at one operating speed and behave normally at another. Rebalancing the rotor may reduce symptoms a little and still leave the root cause untouched.
When vibration rises sharply only in a narrow operating band, the team should question resonance before it assumes a classic rotating fault.
A practical troubleshooting sequence for confusing cases looks like this:
- Compare machine and foundation readings. If the support responds strongly, the structure may be part of the problem.
- Check operating-state dependence. Vibration that changes with speed, product density, or process condition may not point to one fixed defect.
- Review phase and directional behavior. Directional dominance and response changes across support points often reveal more than one overall number.
- Escalate the test method when needed. Route data is useful, but some problems require structural testing, operating deflection shape work, or a more targeted diagnostic setup.
For plants that don't have in-house specialists, one option is a structured service model such as Forge Reliability, which provides route-based and continuous vibration programs for rotating assets and ties findings back to maintenance planning. Used correctly, that kind of support helps teams avoid treating every vibration issue as a balance job.
Turn Your Data Into a Downtime Prevention Plan
Knowing how to measure vibrations is the entry point. The ultimate payoff comes when the plant turns that knowledge into a repeatable reliability process.
That process is straightforward in principle. Critical assets get matched to likely failure modes. Measurement points are fixed. Sensor and metric choices are standardized. Data collection settings are chosen for diagnostic value, not convenience alone. Findings get documented in a way planners can use. Complex cases such as resonance get escalated instead of guessed at.
A chemical plant, paper mill, or food facility doesn't need every machine monitored the same way. It needs the right level of measurement on the right assets, with clear decision rules for when to inspect, when to repair, and when to keep trending. That's how vibration data stops being a stack of screenshots and starts becoming a downtime prevention plan.
The plants that improve fastest usually do one thing well. They treat vibration measurement as part of an asset strategy, not as an isolated technician task.
If recurring failures, unclear vibration data, or weak route consistency are holding the plant back, Forge Reliability offers a free reliability assessment to identify critical asset risks, measurement gaps, and practical next steps for a stronger condition monitoring program.