A vibration route comes back with a problem reading on a critical fan. Operations says the unit sounds normal. Maintenance hears a new tone and wants to inspect it. Production doesn't want an outage based on instinct alone. That tension is where ISO vibration standards either help a plant make a defensible decision or get misused as a blunt pass or fail chart.
Most plants don't struggle because the standards are unavailable. They struggle because the standards are applied without context. A pump on a rigid base doesn't behave like the same pump on a steel skid. A motor running across a VFD speed range doesn't behave like a fixed-speed machine at steady state. And a machine that looks acceptable on casing velocity can still be in trouble if the shaft is moving badly inside a fluid-film bearing.
That's why this guide focuses on practical application. Reliability engineers, maintenance managers, and plant operations leaders need more than a list of standard numbers. They need to know what to measure, where to measure it, which standard applies, and when the published limits stop being enough.
Table of Contents
- Why Objective Vibration Data Matters
- The Language of ISO Vibration Measurement Requirements
- Navigating the ISO 20816 and 10816 Series
- Understanding ISO 7919 for Shaft Vibration
- Mapping Standards to Common Industrial Equipment
- From Data to Decision Using ISO Severity Zones
- Integrating ISO Standards into Your PdM Program
- Advanced Topics Where Standard Limits Fall Short
- Field Checklist and Example Calculation
- Turn ISO Data into Uptime with a Free Reliability Assessment
Why Objective Vibration Data Matters
A cooling tower fan making a new noise is a familiar plant-floor problem. Noise alone doesn't justify an outage. Ignoring it doesn't protect uptime either. Without objective vibration data, the decision turns into a guess between production pressure and maintenance caution.
ISO vibration standards matter because they convert opinion into a repeatable measurement process. Instead of arguing over whether a machine sounds rough, the team can compare measured vibration to a known severity framework and act based on machine condition rather than personality or shift bias.
Why subjective calls fail
A machine can sound worse and still be healthy. Another can sound normal while looseness, misalignment, or resonance is building into a failure. Human observation is useful, but it isn't a condition monitoring method.
For reliability teams building a maintenance strategy, this is one reason the shift from time-based work to condition-based work matters. Plants comparing predictive vs preventive maintenance strategies usually find that vibration standards create a common language for planners, technicians, and operations.
Practical rule: If a shutdown decision can't be explained with measured data, the plant is still relying on judgment calls.
What objective data changes
Objective vibration data helps a team do three things well:
- Prioritize risk: Critical assets with high vibration move up the schedule before failure forces the outage.
- Defend maintenance actions: Planners can justify inspection, balancing, alignment, or repair with measured evidence.
- Trend machine condition: A single reading matters less than a repeatable trend taken at the same points under comparable conditions.
A food plant with a product pump train is a good example. When bearing housing vibration climbs into an unsatisfactory range, the team can plan a short outage, inspect alignment and bearing condition, and avoid losing a production run. That's a key advantage of ISO vibration standards. They reduce guesswork and improve decisions before the machine decides for the plant.
The Language of ISO Vibration Measurement Requirements
Before any team can use ISO vibration standards correctly, it has to speak the measurement language correctly. Most mistakes start here. The wrong quantity, the wrong location, or the wrong frequency range can turn a valid standard into a bad conclusion.
A boiler feed pump in a chemical processing plant is a good example. The pump may be healthy, but if a technician collects one handheld reading on a painted casing and calls it compliant, the number won't mean much. ISO-based evaluation depends on repeatable measurements.
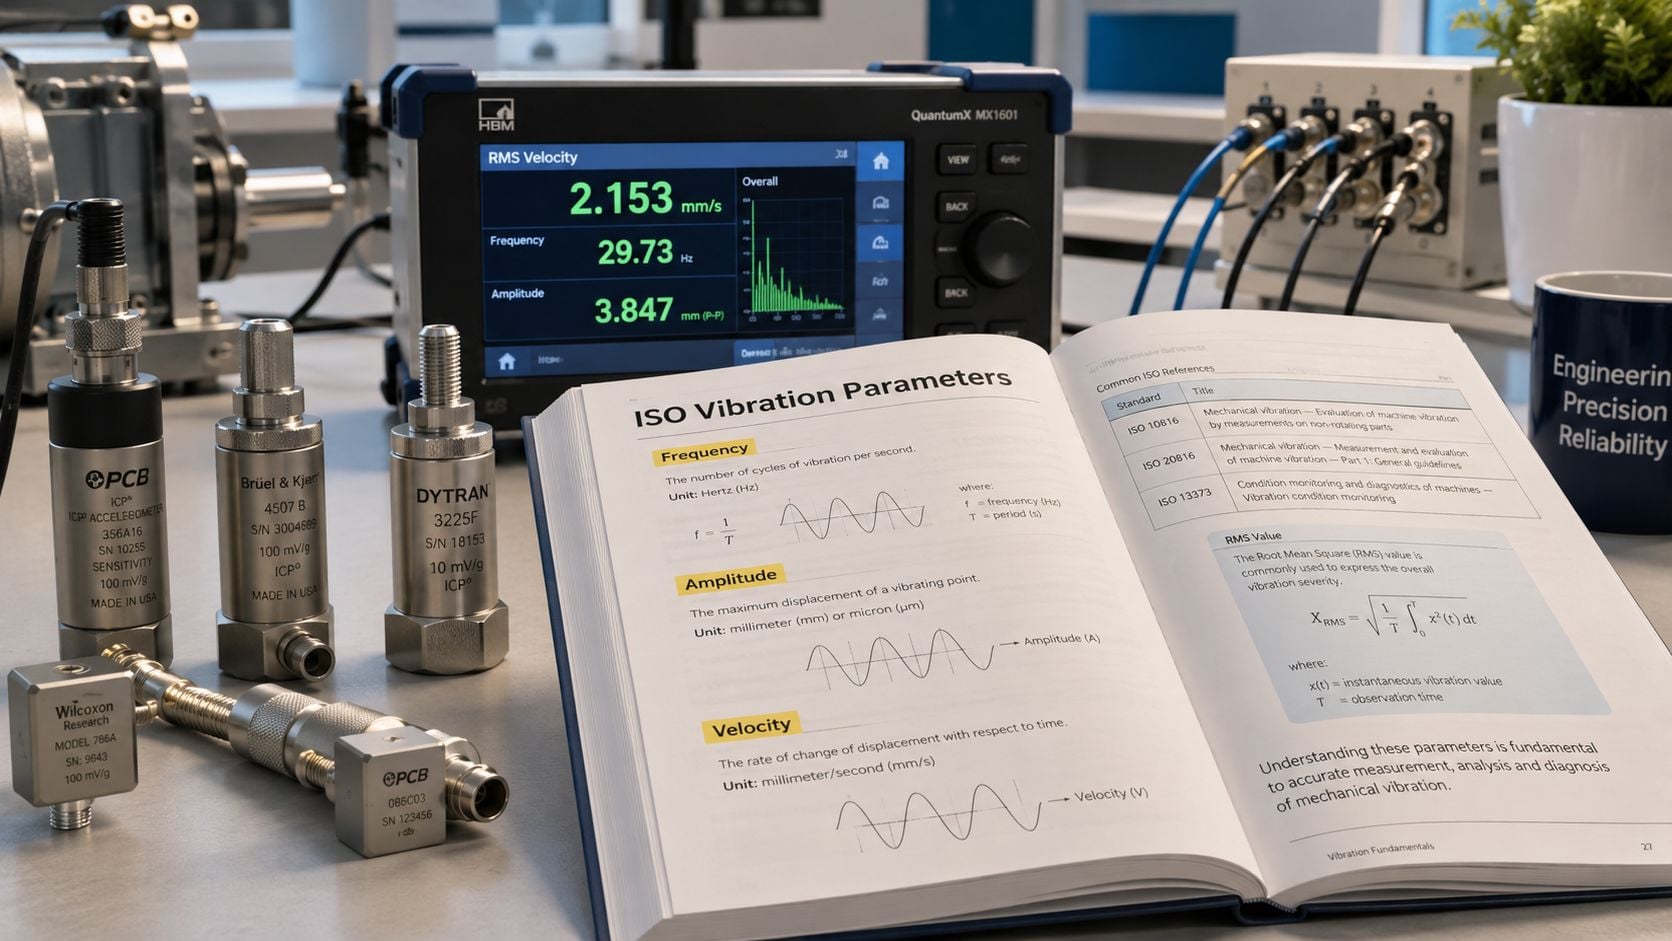
Velocity, acceleration, and RMS
For general machine condition on industrial assets, the primary quantity is vibration velocity, usually reported in mm/s RMS. RMS means root mean square. It represents the effective energy level of the vibration signal and gives a stable severity value for trending and alarm setting.
Acceleration, commonly shown in g, is more sensitive to higher-frequency content such as bearing-related impacts or electrical effects. It has value, but it isn't the first screening metric for broad machine health in the standard casing measurement approach.
That distinction matters on motor-driven pumps. Velocity is often the right first answer for overall condition. Acceleration helps when the engineer is chasing specific high-frequency fault behavior after the overall number says there is a problem.
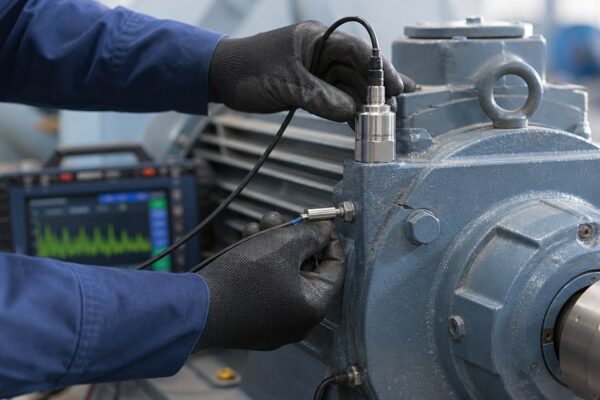
Measurement location and direction
The next requirement is location. For most route-based work, the team measures on non-rotating machine parts such as bearing housings or other structurally solid points. Readings should be repeatable and tied to defined positions.
Typical directions include:
- Horizontal: Often reveals looseness, unbalance, or structural response.
- Vertical: Useful for support stiffness issues and general housing motion.
- Axial: Often helps expose misalignment and thrust-related behavior.
A large motor-pump set may need all three directions at both motor bearings and pump bearings. This is the basis of a useful route, not just collecting whichever point is easiest to reach. Plants trying to standardize that process often start with a documented motor vibration analysis workflow.
Good vibration data isn't just about a sensor. It's about using the same point, the same direction, and comparable operating conditions every time.
Frequency range and repeatability
Frequency range determines what the reading includes. If the setup is too narrow, important vibration energy may be excluded. If it is too broad without purpose, the team may mix different fault behaviors into one number that isn't actionable.
For a chemical pump train, repeatability usually matters more than collecting exotic data on day one. A consistent route with defined points, defined directions, and stable machine operating condition gives the reliability team something they can trust. Without that, the plant isn't using ISO vibration standards. It's just collecting numbers.
Navigating the ISO 20816 and 10816 Series
Many plants still reference ISO 10816 in procedures, reports, and alarm sheets. That's understandable, but the current framework centers on ISO 20816. The key practical point is simple. Engineers need to know which document governs the machine class they're evaluating and what part of the machine is being measured.
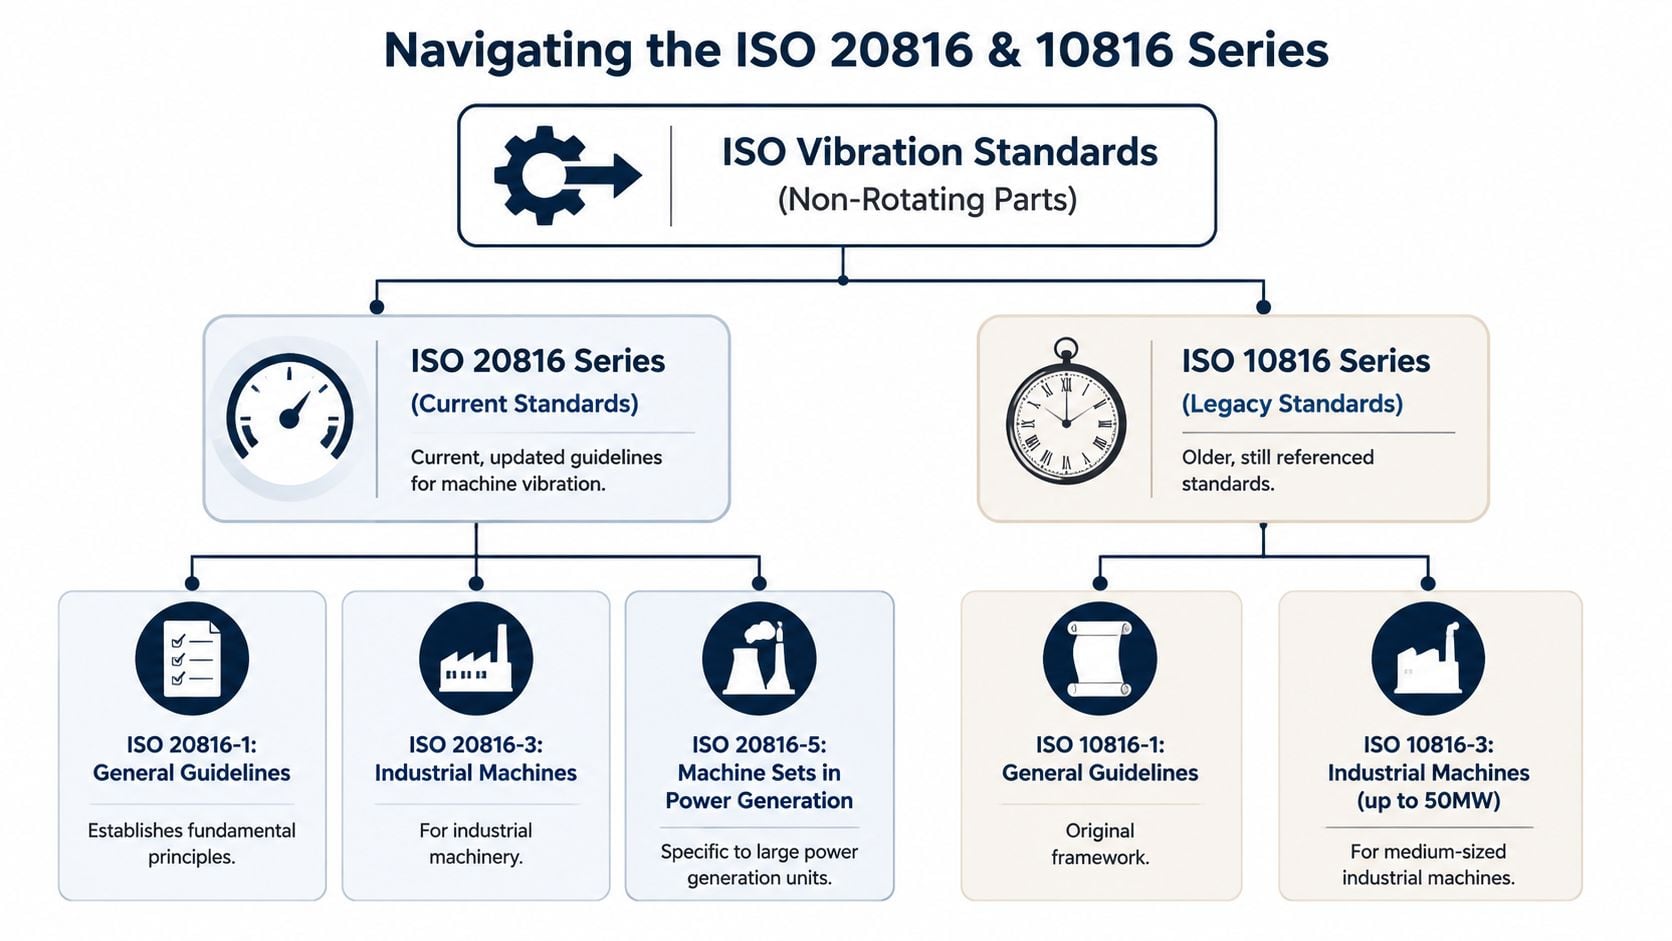
What changed from 10816 to 20816
ISO 10816-3, now superseded by ISO 20816-3, established vibration severity criteria for industrial machinery above 15 kW and operating between 120 and 15,000 RPM, including motors, pumps, generators, compressors, and fans. It used four zones based on RMS velocity in mm/s. For machines in the 15 to 75 kW range, Zone B typically ranges from 1.1 to 2.3 mm/s and Zone C from 2.3 to 4.5 mm/s according to the ISO 10816-3 standard summary.
Those zone concepts remained useful because they gave reliability teams a structured way to judge severity instead of relying on subjective descriptions like “slightly rough” or “running hot.”
Which part applies in practice
The standards aren't one universal table. They are a family. In day-to-day plant work, engineers usually sort the problem like this:
- General guidance: Start with the general ISO framework for how vibration should be measured and evaluated.
- Industrial machine sets: Use the industrial machine document when evaluating common coupled assets such as motors, pumps, fans, and compressors.
- Special machine classes: Move to the applicable part when the asset is a different machine category with its own behavior and limits.
A pulp and paper mill gearbox train illustrates the point. If the machine train includes a 50 kW driver and falls into the industrial machine category, the engineer doesn't need a generic vibration chart from an internal slide deck. The engineer needs the applicable industrial machine criteria and a clear understanding of whether the measurement is being taken on non-rotating or rotating parts.
Where engineers get this wrong
The most common failure isn't using the wrong acronym. It's treating ISO vibration standards as universal thresholds that ignore machine construction, support condition, and operating mode.
A practical review should answer these questions before any judgment is made:
| Question | Why it matters |
|---|---|
| Is the machine within the standard's scope? | Power, speed range, and machine type determine applicability. |
| Is the measurement on the correct part? | Casing data and shaft data answer different reliability questions. |
| Is the machine under steady operating condition? | Unstable process condition can distort severity judgment. |
| Is the support condition understood? | Foundation behavior changes how vibration should be interpreted. |
ISO standards help when they are used as decision tools. They fail when plants use them as a shortcut around engineering judgment.
That distinction becomes even sharper on large turbomachinery, where shaft motion can matter more than casing motion.
Understanding ISO 7919 for Shaft Vibration
Casing vibration doesn't tell the whole story on every machine. On large turbines and compressors with fluid-film bearings, the most important motion may be the shaft's movement inside the bearing clearance. That's where the ISO 7919 series becomes relevant.
A power generation steam turbine is the classic example. The casing may look calm enough, while the shaft is developing behavior that points to instability, misalignment, or oil film problems. If the team only watches external velocity, it can miss the underlying issue.
Casing vibration versus shaft vibration
The difference is straightforward:
- Casing vibration: Measures absolute movement of non-rotating machine parts such as bearing housings.
- Shaft vibration: Measures relative shaft motion, typically with non-contact proximity probes.
These methods are not interchangeable. They answer different questions.
Casing data is often enough for standard rolling-element-bearing assets like process pumps, fans, and common motors. Shaft vibration becomes necessary when the rotor system itself is the dominant concern and the bearing design allows significant shaft motion relative to the housing.
When shaft data changes the diagnosis
On a large steam turbine, shaft vibration can reveal problems that housing velocity may understate. Oil whirl, oil whip, and severe misalignment are classic examples. A machine may not look alarming from the outside, but probe data can show unstable shaft orbit behavior that requires immediate engineering review.
That's why shaft alignment quality still matters upstream of vibration diagnosis. A machine train that is forced into bad alignment often creates symptoms that show up in both casing and shaft measurements. Plants dealing with persistent train vibration often need a disciplined precision shaft alignment approach before they can trust the rest of the diagnostic picture.
A low casing reading doesn't clear a large turbomachine if the shaft is behaving badly.
Practical selection logic
For most reliability programs, the choice is based on machine design and consequence of failure:
| Machine type | Primary concern | Preferred measurement emphasis |
|---|---|---|
| Standard motor-pump set with rolling-element bearings | Housing condition and transmitted force | Casing vibration |
| Large compressor with fluid-film bearings | Rotor behavior in bearing clearance | Shaft vibration |
| Steam turbine train | Rotor stability and shaft motion | Shaft vibration plus supporting casing data |
The mistake isn't choosing one method over the other. The mistake is assuming casing velocity always tells enough of the story.
Mapping Standards to Common Industrial Equipment
A route technician pulls an overall velocity on a 250 kW pump skid and gets a number that looks acceptable. Two weeks later, the coupling insert is chewed up, the base has walked, and the standby unit is now carrying the process. The problem was not the reading alone. The problem was applying the wrong standard logic to the machine, the mounting, and the way it was operating.
That is where many ISO discussions fall short. Listing standard numbers is easy. Using the right standard for the actual machine in front of you is harder, especially with packaged skids, variable speed drives, soft structures, and mixed fleets where pumps, motors, and fans all sit in the same route.
Quick reference by equipment type
Start with machine design, support stiffness, and bearing type. Then match the asset to the standard family used for that measurement.
| Equipment type | Typical measurement focus | Standard family usually applied |
|---|---|---|
| Horizontal motor-pump set with rolling-element bearings | Casing or bearing housing vibration, overall velocity for screening | ISO 20816-3, formerly ISO 10816-3, for industrial machines on rigid or flexible supports |
| Process pump set on baseplate or skid | Casing vibration, with support condition checked before judging severity | ISO 20816-3 for the driver and pump train, then pump-specific acceptance documents if the OEM or project spec requires them |
| Fan and blower packages | Casing vibration, with close attention to structural response and operating point | ISO 20816-3 in many plant applications, but fan construction and support flexibility need a separate engineering check |
| Reciprocating compressor package | Overall velocity alone is rarely enough | Use the standard that matches the machine type and review pulsation, piping forces, and discrete frequency content before calling condition good or bad |
| Large compressor or turbine with fluid-film bearings | Shaft-relative and shaft-absolute data often carry more weight than housing velocity | ISO 7919 for shaft vibration, supported by the applicable ISO 20816 part for casing behavior |
The practical point is simple. "Pump," "motor," or "fan" is not enough to choose limits confidently.
A 30 kW end-suction pump on a rigid foundation can often be screened effectively with the general industrial machine framework. A large vertical pump, a fan on a light structural mezzanine, or a motor on a long flexible skid can produce readings that look severe even when the fault is more about support behavior than rotor condition. The opposite failure happens too. Teams normalize a bad reading because "that skid always shakes," and they miss looseness, resonance, or misalignment until parts start failing.
ISO 20816-3 vibration severity limits by equipment type
| Equipment Type | Applicable Standard | How to interpret it in practice |
|---|---|---|
| Industrial motor in the 15 to 75 kW range | ISO 10816-3 / ISO 20816-3 framework for industrial machines | Use overall velocity as a screening tool only after confirming machine group and support condition |
| Industrial pump in the 15 to 75 kW range | ISO 10816-3 / ISO 20816-3 framework for industrial machines | Evaluate the pump and driver as an installed system, not as isolated assets |
| Compressor | Machine-specific standard selection is required | Do not apply generic overall velocity limits without checking machine type, bearing style, and process effects |
| Fan | Often screened under ISO 20816-3 in general industry | Review buildup, blade condition, operating point, and structural amplification before treating the reading as pure rotor unbalance |
How to use the table without misusing it
Three checks prevent most bad calls.
- Confirm the support condition. Rigid versus flexible support changes the applicable classification and can shift how a given overall value should be judged.
- Check speed control. VFD-driven machines cross frequency ranges that fixed-speed severity tables do not explain well. A clean number at one speed can become a resonance problem at another.
- Separate screening from diagnosis. ISO severity zones help decide urgency. They do not identify whether the problem is unbalance, looseness, hydraulic excitation, vane pass, belt frequency, or foundation weakness.
Fan systems expose this problem quickly. A fan on a flexible steel frame may run high overall velocity because the structure is amplifying motion near running speed. Balancing the rotor might reduce the number a little, but it will not fix the frame. I have seen plants chase balance corrections for months when the actual task was stiffening supports and changing operating speed away from resonance.
Pump skids with VFDs create another trap. At one speed, the machine may sit comfortably in a normal screening range. At another, pipe strain, soft foot, or base flexibility can drive a sharp increase at 1x or vane-pass-related frequencies. If the team treats the highest reading as a generic "pump problem," they often replace bearings and couplings while leaving the forcing function in place.
Use the standard to classify the measurement. Then apply engineering judgment to the machine, the structure, and the process. That is what keeps ISO data from turning into false alarms on one asset and missed failures on the next.
From Data to Decision Using ISO Severity Zones
The four ISO severity zones are useful only if the plant translates them into actions. Too many reports stop at color coding. A machine lands in a zone, the box turns yellow or red, and nobody defines what maintenance, operations, or engineering should do next.
A food and beverage facility with a critical product pump illustrates the problem well. If the pump enters an unsatisfactory zone during a production campaign, shutting it down immediately may create a process problem. Leaving it untouched may create a larger failure. The ISO zone gives structure to that decision, but it doesn't make the decision on its own.
What each zone means in plant terms
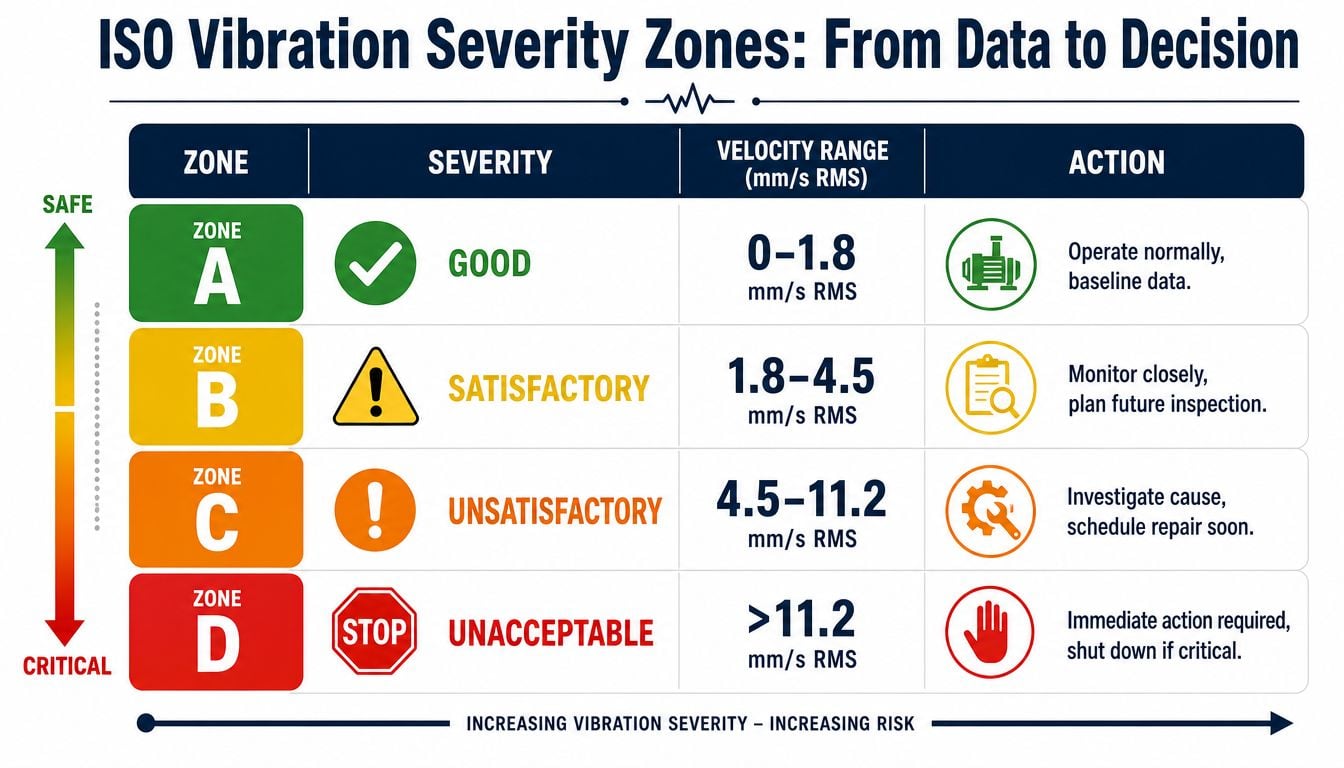
For newly commissioned machinery under ISO 10816, vibration of 1.4 mm/sec RMS or less is advised. 2.8 mm/sec RMS allows unrestricted operation. 2.8 to 4.5 mm/sec RMS indicates restricted operation associated with issues such as unbalance or misalignment. Above 4.5 mm/sec RMS is associated with damage, as summarized in this ISO 10816-3 severity chart explanation.
Those values become more useful when translated into plant actions:
| Zone | Typical condition | Practical action |
|---|---|---|
| A | New or newly restored condition | Capture baseline data and lock in reference points |
| B | Acceptable for normal service | Continue operation and trend normally |
| C | Unsatisfactory for long-term service | Investigate cause, assess risk, and schedule corrective work |
| D | Likely damaging condition | Escalate immediately and consider shutdown based on criticality |
Zone C is where most judgment failures happen
Zone C is where reliability teams earn their keep. The machine isn't healthy enough for long-term comfort, but it may still run for a limited period while the team plans the right intervention.
That means the response should be deliberate:
- Confirm the reading: Recheck the point, operating condition, and trend history.
- Find the mode: Look for likely causes such as imbalance, misalignment, looseness, resonance, or bearing distress.
- Assess consequence: A standby pump can wait for a planned outage. A sole production asset may need immediate contingency planning.
- Assign a work scope: Alignment, balancing, bolt inspection, soft foot correction, or bearing inspection should be tied to the likely fault.
Zone C isn't a paperwork category. It's a warning that the plant still has time to choose the outage instead of receiving one.
Communicating the decision
Operations leaders need a plain-language answer. A useful recommendation doesn't say only that vibration is high. It says the machine is in an unsatisfactory range, the likely failure modes are known, the risk of continued operation is high, and the team recommends a planned outage within a defined maintenance window.
That's how ISO vibration standards support uptime. Not by replacing judgment, but by forcing judgment to be evidence-based.
Integrating ISO Standards into Your PdM Program
A standard on a shelf doesn't improve reliability. A predictive maintenance program does, if the plant builds the program around repeatable measurement, clear alarm logic, and disciplined follow-up.
An HVAC-heavy commercial facility with a fleet of air handling units is a useful example. The site may have dozens of motors, fans, and belt-driven assets. If the route design is inconsistent, the team will spend more time debating bad data than finding faults.
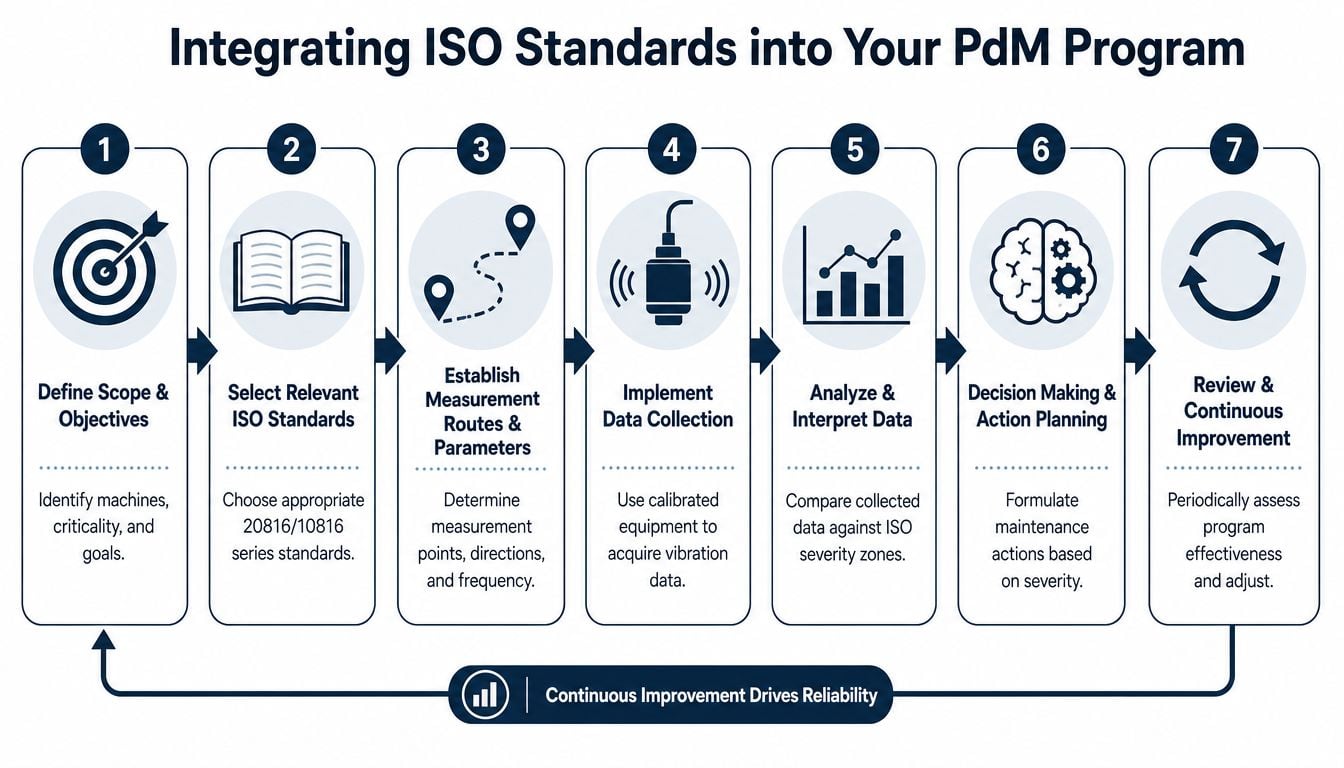
Start with scope and measurement discipline
ISO 20816-3:2022 applies to in-situ broad-band vibration measurements on coupled industrial machines above 15 kW and operating from 120 r/min to 30,000 r/min. It specifies measurement on non-rotating and rotating parts under steady-state conditions within the nominal operating speed range, excluding vibration from external sources, according to the ISO 20816-3:2022 standard page.
That has direct implications for route setup. The team should define:
- Asset scope: Which machines are critical, which are balance-of-plant, and which only need periodic checks.
- Measurement points: Bearing housings, directions, and naming conventions.
- Operating condition: Load, speed, and process state required for a valid reading.
Without that structure, the plant can't compare one month to the next with confidence.
Match the monitoring method to asset criticality
Not every machine needs continuous online monitoring. Not every machine should be left to a quarterly route either.
A practical split often looks like this:
- Route-based monitoring: Fits less critical motors, fans, and utility pumps where trend changes can be caught before production impact.
- Continuous monitoring: Fits machines whose failure consequence is high, restart is difficult, or process upset is severe.
- Hybrid approach: Common in plants that monitor critical trains continuously while collecting route data on broader asset populations.
For plants that don't have in-house analysts, one option is to use a provider that supports predictive maintenance services. Forge Reliability is one example of a firm that applies route-based and continuous monitoring methods to rotating assets, along with reporting and follow-up recommendations.
Reporting and action closure
Good reporting doesn't bury the decision in charts. It makes the action clear.
A solid PdM workflow should include:
- Severity classification: Tie readings to the relevant ISO zone or alarm level.
- Fault hypothesis: State the likely cause in plain terms.
- Recommended work: Convert analysis into a work order scope.
- Verification step: Re-measure after the repair to confirm the fix.
If a vibration program doesn't create better work orders, it isn't a reliability program yet.
For a fleet of air handling units, that means the monthly report should tell the facility manager which fans are healthy, which belts or sheaves need inspection, which motor bearings need attention, and which units can safely wait for the next planned maintenance window. That's how ISO vibration standards become part of a working PdM system instead of just another compliance reference.
Advanced Topics Where Standard Limits Fall Short
A pump can sit in the acceptable ISO zone at 50 Hz, then cross a resonance band at 42 Hz and start eating bearings. The report still says "within limits" if the route captured only one operating point. That is how standards get misused. The limit was not wrong. The application was.
ISO vibration limits are reference points for defined machine classes and measurement conditions. They do not replace machine knowledge. The mistakes show up on assets with changing speed, flexible support structures, complex piping loads, or operating states that were never close to the assumptions behind the chart.
VFD-driven assets need speed-aware evaluation
Variable speed changes the forcing frequency, the structural response, and sometimes the dominant fault signature. A single overall velocity alarm that works on a fixed-speed motor can miss a narrow speed band where resonance appears, then disappears a few hundred RPM later.
That is the trap with VFD-driven machines. Teams apply a fixed limit to a variable-response system and assume the classification is still meaningful across the full range.
In practice, the right question is not "Is this machine below the ISO limit?" It is "At what speeds was it measured, and what happens between them?" Startup, coastdown, and controlled speed sweeps often show more than a month of single-point route data. On fans, vertical pumps, and skid-mounted process pumps, I have seen the worst vibration occur in a transient band that normal route collection never touched.
A speed-based review works better:
- Trend by speed band: Compare readings at repeatable RPM ranges, not just one overall monthly value.
- Capture run-up or coastdown data: Look for peaks that point to structural or rotor resonance.
- Separate electrical from mechanical effects: VFDs can introduce frequency components that confuse a quick diagnosis.
- Set alarms by operating state: One alarm for the whole speed range is often too blunt to be useful.
Plants trying to tighten collection consistency across these assets usually need a documented vibration monitoring route setup guide so technicians record speed, load, and measurement location the same way every time.
Flexible foundations change the meaning of the number
Support stiffness is not an administrative detail. It changes how vibration is transmitted, amplified, and interpreted at the bearing housing.
The same motor-pump set can produce very different casing vibration on a rigid concrete foundation versus a steel skid with soft structural modes. If the support is flexible, the machine may show high housing motion without the same internal condition expected on a rigid base. The opposite problem also occurs. A local structural amplification can mask the actual source and prompt the team to address balancing, alignment, or bearings when the foundation itself is the root problem.
Common warning signs include:
- Large changes in amplitude with small speed changes
- High readings at one measurement point with no matching fault pattern elsewhere
- Persistent looseness harmonics after repeated mechanical correction
- Visible movement at feet, baseplate, piping, or nearby steel
Standard severity zones do not diagnose the support structure, classifying only the observed vibration. Should the structure itself drive the response, the zone may appear official, though the conclusion would be incorrect.
Standard limits create risk when they replace judgment on machines with variable speed or uncertain support stiffness.
What experienced teams do differently
Use the ISO limit as the starting boundary, then test whether the machine fits the assumptions behind it.
That usually means checking speed, load, foundation behavior, and measurement repeatability before treating the zone as a maintenance decision. When the number and the field symptoms disagree, trust the inconsistency and investigate it. Pull spectra. Check phase. Look at structural response. Inspect grout, hold-downs, base flatness, and pipe strain.
A chemical plant with VFD-driven fans can spend months correcting "imbalance" that keeps coming back. The fan was never the main problem. A structural resonance in the operating range was. The overall value alone did not show that. The fix came from matching the standard to the machine, not forcing the machine into the standard.
Field Checklist and Example Calculation
A standard becomes useful when the technician in the field can follow the same process every time. That starts with a checklist. It ends with a simple classification decision that can be repeated across assets and shifts.
A route on a 40 kW pump motor in a process plant is a good working example. The team needs enough context to determine whether the reading is trustworthy before anyone classifies the machine.
Field checklist for ISO-based evaluation
Use a route sheet or digital form that captures at least the following:
- Machine identification: Asset number, service, and location
- Operating state: Running, loaded condition, and current speed if known
- Measurement point: Exact bearing location and direction
- Measurement type: Overall velocity in mm/s RMS for the applicable route point
- Support note: Rigid base, skid, or uncertain support condition
- Observed condition: Noise, heat, looseness, leakage, or recent maintenance
- Trend reference: Prior reading at the same point under comparable conditions
Plants building route consistency often benefit from a documented vibration monitoring route setup guide, especially when multiple technicians collect data.
Example calculation
Take this field reading:
| Item | Value |
|---|---|
| Machine | Pump motor |
| Power | 40 kW |
| Measurement | 3.2 mm/s RMS |
| Point | Motor bearing housing |
| Operating condition | Steady running |
Now classify it.
For industrial machinery in the 15 to 75 kW range, the earlier cited ISO 10816-3 framework places Zone B at 1.1 to 2.3 mm/s and Zone C at 2.3 to 4.5 mm/s. A reading of 3.2 mm/s RMS falls inside Zone C.
That means the machine is unsatisfactory for long-term operation under that framework. It doesn't automatically mean immediate shutdown. It does mean the team should investigate and plan corrective work.
What the team should do next
A useful response would look like this:
- Verify the reading at the same point and operating condition.
- Review the spectrum for likely causes such as imbalance, misalignment, or looseness.
- Inspect the train for soft foot, coupling condition, hold-down integrity, and bearing symptoms.
- Plan the repair based on machine criticality and production schedule.
- Re-test after correction to confirm the vibration has returned to an acceptable range.
The calculation is the easy part. The value comes from tying the zone to the right maintenance action.
Many plants stall at this point. They can label a machine yellow or red, but they don't have a disciplined path from measurement to correction. A repeatable checklist closes that gap.
Turn ISO Data into Uptime with a Free Reliability Assessment
ISO vibration standards are useful because they create structure. They help plants measure consistently, classify machine condition, and justify action. But standards alone don't prevent failure. The plant still needs good routes, valid operating-condition control, analysts who can separate imbalance from resonance, and maintenance teams that close the loop after the repair.
That matters most on mixed fleets where common industrial assets sit next to VFD-driven machines, skid-mounted equipment, and critical trains where a single missed diagnosis can force a shutdown. In those environments, the difference between a compliant-looking reading and a reliable asset often comes down to how the data is interpreted and acted on.
Plants that want to tighten alarm strategy, improve route quality, or review chronic vibration problems should start with an outside assessment of machine criticality, measurement practices, and failure risk.
Forge Reliability helps plants turn vibration data into maintenance decisions that reduce unplanned downtime. If the site needs a practical review of ISO alarm settings, route coverage, VFD-driven asset risk, foundation-related vibration issues, or broader predictive maintenance gaps, request a free reliability assessment from Forge Reliability.