
A production pump rarely fails at a convenient time. It fails when the line is full, operators are pushing rate, and maintenance already has a backlog. In a chemical plant, that usually means a seal starts leaking, vibration climbs, bearing temperature drifts upward, and then someone gets the call after the asset is already lost.
What turns that event into a plant-wide problem isn't just the broken pump. It's the overtime, the rushed parts decision, the scramble to decide whether the standby pump can carry the load, and the uncomfortable conversation about why no one saw it coming. Most plants had warning signs. They just didn't have a system that converted those signals into timely action.
That's the difference between instrumentation and a condition monitoring program. A sensor can collect data. A usable strategy tells the team which assets matter, which signals are trustworthy, how findings should be interpreted, and what action should happen before failure. For plants trying to move away from reactive work, that's the primary job of condition monitoring systems.
This matters more now because the category has become a significant industrial market. One forecast values the condition monitoring system market at USD 4.4 billion in 2025 and USD 4.7 billion in 2026, with a projection of USD 9.9 billion by 2036 at a 7.7% CAGR, according to Future Market Insights' condition monitoring system market analysis. Another projects US$4.5 billion in 2025 and US$7.6 billion by 2032 at a 7.8% CAGR, according to Persistence Market Research's condition monitoring system market forecast. The useful takeaway isn't the size of the market. It's that industrial teams are steadily adopting continuous monitoring for critical assets because downtime and maintenance labor justify it.
Table of Contents
- Beyond Alarms Why Your Plant Needs a Monitoring Strategy
- Choosing Your System Architecture From Alerts to Intelligence
- Matching Sensors and Techniques to Specific Failure Modes
- Designing the Data Workflow From Sensor to Actionable Insight
- Building the Business Case with KPIs and ROI Calculation
- Your Implementation Roadmap and CMMS Integration Plan
- From Reactive Repairs to Proactive Reliability
Beyond Alarms Why Your Plant Needs a Monitoring Strategy
A main product pump in a chemical unit usually doesn't announce failure with a single dramatic event. It gives off smaller signals first. Vibration trends upward on the outboard bearing. Casing temperature changes under higher throughput. Seal flush conditions drift. Operators hear a different sound during recirculation, but the asset keeps running, so the line keeps running.

Plants get in trouble when they treat those signals as isolated alarms instead of part of a decision process. One alarm goes to operations. Another sits in a dashboard. A third gets noticed during rounds. No one owns the full picture, so the pump runs until the failure is obvious and expensive.
A monitoring strategy fixes that by forcing three questions early:
- Which assets can hurt production most: The main process pump, not every utility pump, gets the first monitoring budget.
- Which evidence is reliable: A single temperature spike may be noise. Vibration plus process change plus lubricant condition is harder to dismiss.
- What action follows a finding: If the team can't define who reviews alerts and how work gets planned, the system won't prevent failure.
A plant doesn't need more alarms. It needs fewer, better signals tied to decisions.
That shift also changes how maintenance and operations work together. Monitoring becomes part of the operating model, not a side project owned by one analyst. In many plants, that means aligning machine health work with broader operations and maintenance reliability practices so asset condition, production risk, and maintenance planning use the same priorities.
Choosing Your System Architecture From Alerts to Intelligence
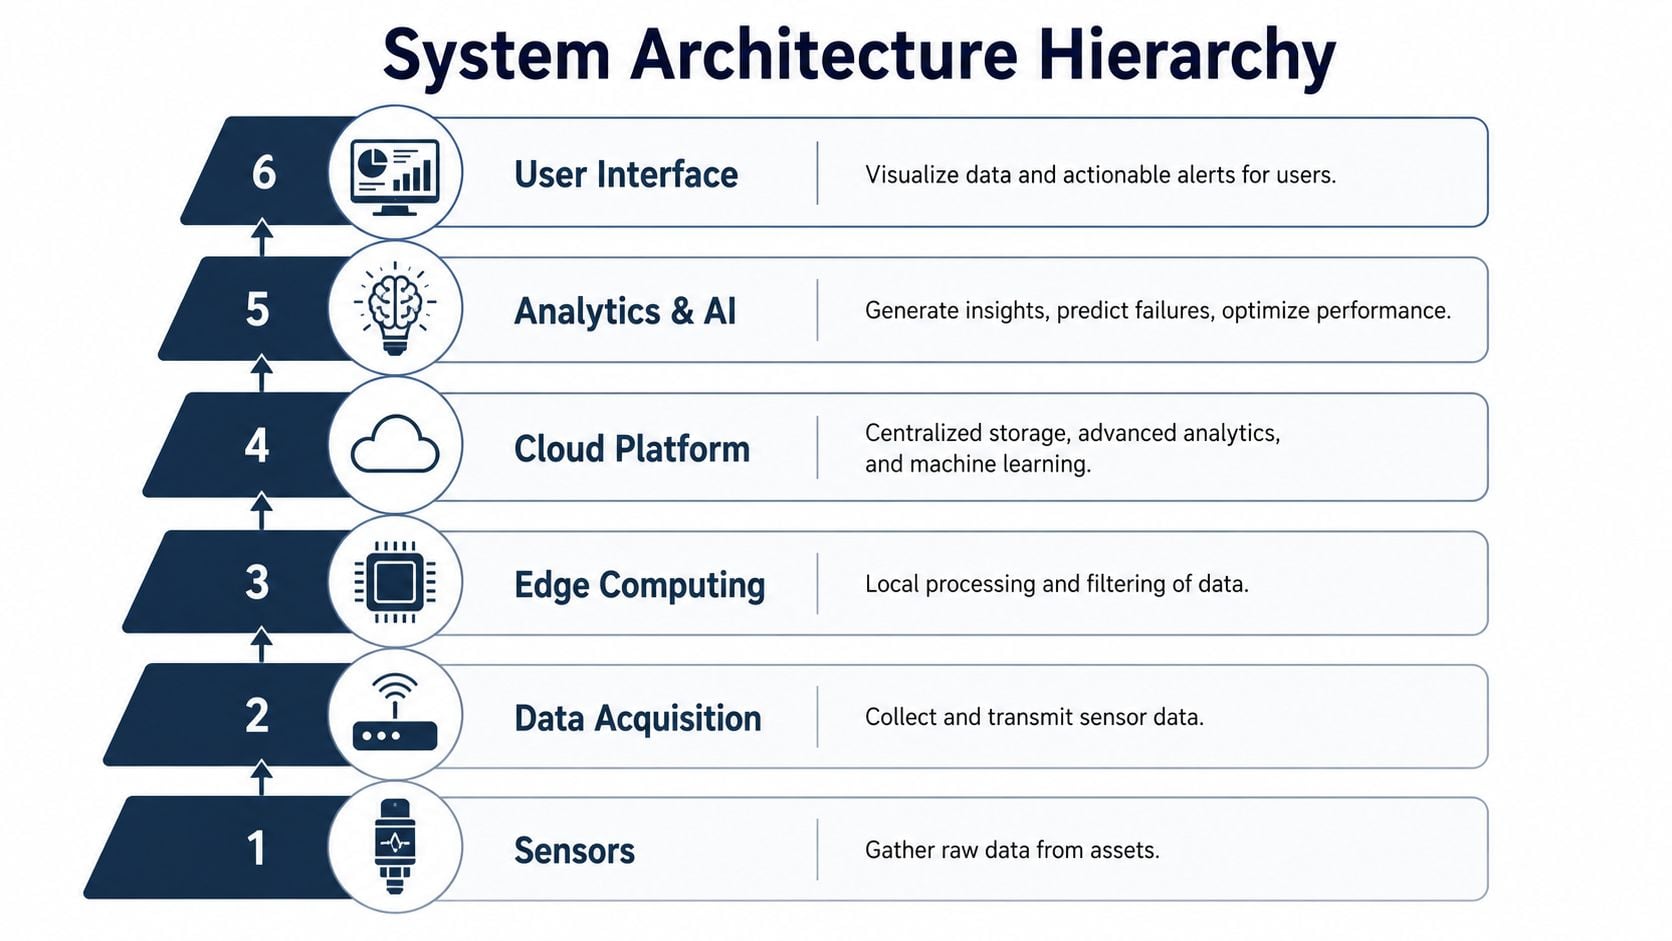
A common initial inquiry focuses on which sensor to buy. That's usually the wrong first question. The first decision is architectural. The plant has to decide whether it wants raw data, alarms, diagnosis, workflow support, or a system that carries a finding all the way into execution.
A widely used comparison framework identifies five maturity levels for condition monitoring systems: sensor network with threshold alerting, analyst-driven monitoring service, diagnostic platform with managed expert overlay, assembled monitoring-and-maintenance ecosystem, and closed-loop condition intelligence/execution, as described in this condition monitoring systems maturity framework. That framework is useful because it connects design choices to response time, labor demand, and diagnostic consistency.
Start with asset criticality, not sensor features
A power plant can tolerate a simpler architecture for cooling tower fan motors than for the main steam turbine train. The fan may need basic alerting and periodic review. The turbine needs faster interpretation, tighter workflow, and less dependence on a single expert being available at the right moment.
Three selection criteria usually matter most:
Consequence of failure
If the asset can shut down a line, create a safety exposure, or force a product-quality event, basic alerts alone usually aren't enough.Internal diagnostic capability
Plants with strong vibration and electrical analysis capability can live with a less automated system. Lean teams usually can't.Execution speed required
If a fault has to move from detection to a planned work order quickly, any handoff between systems becomes a weak point.
What each maturity level means in practice
The five levels look similar in a brochure. They don't behave the same on the plant floor.
Threshold alerting works for lower-criticality assets or early pilots. It tells the team that something changed. It usually doesn't tell them what changed or what to do next.
Analyst-driven monitoring adds interpretation. That's useful when the site lacks in-house expertise, but the program can become dependent on outside review capacity.
Diagnostic platform with expert support moves more fault recognition into software. That improves scale, but many plants still face a delay between diagnosis and maintenance execution.
Monitoring plus maintenance ecosystem gets closer to a full workflow. The value depends on how smoothly the monitoring side and maintenance side connect.
Closed-loop execution is where the architecture starts behaving like a reliability engine instead of a dashboard. Findings can be triaged and pushed directly into maintenance action with less re-entry and less waiting.
Practical rule: Match the architecture to the business risk of the asset, not to the novelty of the technology.
A common mistake is overbuilding the system for noncritical assets and underbuilding it for production bottlenecks. Another is buying an advanced analytics layer without a defined path into maintenance planning. A fault that dies in a dashboard still becomes downtime.
For teams evaluating how much automation and workflow support they need, predictive maintenance and machine learning in practice is usually the right lens. The point isn't to chase AI language. It's to decide how much manual interpretation the plant can realistically sustain as the monitored asset count grows.
Matching Sensors and Techniques to Specific Failure Modes
A motor trips on overload. The infrared scan shows heat at the terminals. Vibration on the drive end is also rising. If those signals are reviewed in isolation, the team can waste a week debating whether the problem is electrical or mechanical. The better question is what failure mechanism can explain all three, under the actual process conditions when they appeared.
That is the starting point for sensor selection. Choose sensors based on failure physics and operating context, not by installing the same package on every asset. A pump with cavitation risk, a motor with insulation concerns, and a gearbox with contamination exposure fail differently. They need different evidence, collected at the right rate and interpreted alongside load, flow, pressure, speed, temperature, and start-stop history.
A practical way to frame the choice is by asking three questions:
- What failure mode are we trying to catch early?
- What physical change appears first?
- What other process variables could create a false alarm or hide the fault?
Those questions usually narrow the field fast.
Match the method to the defect, not the asset class alone
Asset labels are too broad to drive good sensor decisions. Two pumps in the same unit can need different monitoring approaches if one runs at fixed duty on clean service and the other operates across a wide control range with frequent cavitation or seal issues.
Vibration analysis fits faults that change dynamic behavior. Use it for imbalance, misalignment, looseness, resonance, bearing damage, and gear defects. It is usually the primary method for rotating equipment because it shows mechanical change early and supports diagnosis when the measurement point, mounting, and sampling settings are right.
Thermography fits faults that create abnormal heating. Use it for loose electrical connections, overloaded circuits, phase imbalance effects, friction, and some lubrication failures. It is useful, but heat is often a later symptom than vibration or ultrasound, so it works best as confirming evidence rather than the only line of defense.
Ultrasound and stress-wave methods fit high-frequency events. They can pick up early rolling-element bearing distress, air and gas leaks, lubrication problems, arcing, and some cavitation-related conditions before broadband trends look abnormal.
Electrical methods fit faults inside the motor system or cases where the mechanical symptoms do not explain the operating behavior. Online electrical signature analysis is used while the machine is running and helps assess rotor-related issues, power quality effects, and load interaction. Offline motor circuit tests are done with the motor isolated and are better for winding, insulation, and connection integrity.
Lubricant analysis fits enclosed machines where wear debris, contamination, and fluid condition show internal damage before external symptoms become obvious. It is especially useful on gearboxes, hydraulic systems, and large bearing systems where opening the machine is expensive.
Condition Monitoring Technology Selection Matrix
| Technology | Primary Failure Modes Detected | Typical Assets |
|---|---|---|
| Vibration analysis | Imbalance, misalignment, looseness, bearing damage | Pumps, motors, compressors, gearboxes, fans |
| Thermography | Hot electrical connections, friction heating, overloaded components | Motor control centers, switchgear, bearings, couplings |
| Ultrasound or stress-wave methods | Early bearing distress, leaks, some lubrication issues, cavitation-related signatures | Bearings, compressed air systems, valves, pumps |
| Online electrical signature analysis | Load-dependent electrical anomalies while running | Motors, driven pump and fan systems |
| Offline motor circuit analysis | Insulation and circuit degradation during de-energized testing | Spare motors, planned shutdown inspections, critical motor fleets |
| Lubricant analysis | Wear debris, contamination, fluid degradation | Gearboxes, hydraulic units, compressors, large bearing systems |
Combine machine health data with process data
This is the step many guides skip, and it is where diagnosis gets more reliable.
A pump can show rising vibration because the coupling is misaligned. It can also show rising vibration because minimum flow protection is not working and the pump is recirculating. The corrective actions are different, and one of them belongs to operations, not maintenance. If the reliability team does not review suction pressure, discharge pressure, flow, valve position, speed, and recent process changes with the machine data, the plant can fix the wrong problem and watch the alarm return.
The same issue shows up on conveyors, mixers, and compressors. A gearbox temperature increase might be a lubrication problem. It might also be the result of a production rate increase that pushed the drive into a higher load band for longer periods. Electrical current anomalies might point to rotor issues, or they might reflect unstable process demand. Sensor choice should account for that from the start. If process context determines whether a signal is meaningful, capture both.
A layered approach works because real failures are messy
Single-signal monitoring has limits. It can detect change, but diagnosis often needs corroboration.
On a critical process pump, a sound setup might include continuous vibration at both bearing locations, periodic thermography on motor terminations and bearing housings, ultrasound during inspection routes, and lubricant checks where contamination risk is high. Add the process tags that explain duty point and operating regime. That combination does more than create extra data. It helps the team separate mechanical defects from operating problems and avoid false work orders.
On motor-driven equipment, vibration is usually the best starting point because it ties directly to defect frequencies, mechanical condition, and machine behavior. Teams building that skill set should start with vibration analysis of motors and driven equipment before adding more specialized methods.
Visual inspection can also matter when equipment condition affects product quality or line performance. On packaging lines, for example, a worn guide, unstable conveyor drive, or indexing problem may show up first as a reject pattern rather than a maintenance alarm. Zephony's vision system guide is useful background when inspection performance and machine condition need to be evaluated together.
The selection rule is simple. Use each method for the failure modes it can prove, then check those signals against process conditions before calling the root cause. That is how a monitoring program moves from collecting alerts to preventing repeat failures.
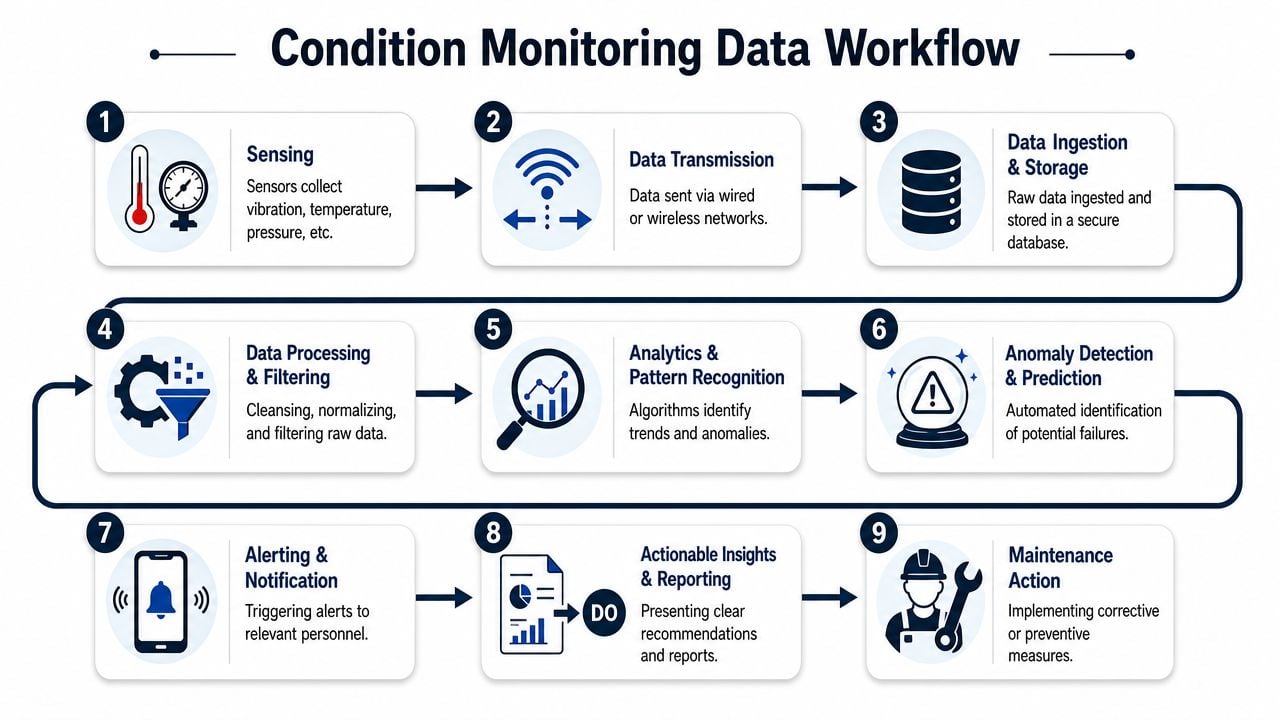
Designing the Data Workflow From Sensor to Actionable Insight
A machine rarely fails because a sensor missed everything. It fails because the plant did not turn a signal into a decision in time. I see that break most often in the handoff points: poor tag quality, no operating context, unclear alarm ownership, or no rule for when a finding becomes planned work.
Sensing and transmission decisions
Start with the failure decision you need to make, then design the data path backward. If the question is whether a critical compressor can safely run until the next shutdown, the workflow needs repeatable measurements, stable timestamps, and enough process data to separate a true mechanical change from a load change. If the question is whether a low-risk pump should stay on a watch list, the data path can be simpler.
Sensor placement and mounting still decide data quality more than software does. A badly mounted accelerometer on a flexible surface creates arguments, not diagnoses. Sampling strategy also has to match the defect progression rate. Slow-developing bearing wear and short-lived impact events do not need the same collection interval or resolution.
Transmission is an engineering and maintenance decision, not just an IT preference.
- Wired systems fit assets where high-resolution continuous data, synchronization, and low signal loss are required.
- Wireless systems fit retrofit programs, remote assets, and broad fleet coverage where installation cost would otherwise kill the project.
- Hybrid designs usually make the most sense in real plants. Keep permanent high-quality coverage on production-critical trains, then use wireless points to widen reach across secondary assets.
The bigger mistake is treating machine data as a standalone stream. Pressure, flow, temperature, speed, valve position, and production rate often explain why vibration or temperature changed. Without those tags, analysts end up chasing symptoms. With them, the team can see that a pump only goes unstable at low flow, or that a gearbox temperature increase tracks a process upset rather than a lubrication problem.
Analysis and action decisions
Analysis starts with data quality rules. Remove bad points caused by sensor faults, communication dropouts, and known startup or shutdown states. Group data by operating regime before setting limits. A fan at 60 percent speed should not be judged against the same baseline as the same fan at full load.
Alarm logic needs tiers. One threshold for "watch" and another for "plan work" is usually better than a single trip line. Teams also need clear ownership. Reliability may validate the diagnosis, but operations often controls the load and maintenance owns the repair window. If those responsibilities are not written down, alerts sit in dashboards until the failure makes the decision for everyone.
A useful output is specific. The planner should see the asset, the likely failure mode, the confidence level, the process conditions present when the event occurred, and the recommended next step. "High vibration" is not enough. "Rising 1x and bearing housing temperature increase at high load only, inspect alignment and check coupling condition during the next planned stop" is actionable.
The workflow should also close the loop after inspection. If the finding was wrong, update the rule. If the diagnosis was right, record what confirmed it and how early the team caught it. That feedback is what improves alarm quality and supports later maintenance cost reduction decisions with plant-specific evidence instead of assumptions.
One practical option is to use a provider that can support both the diagnostics and the workflow design. Forge Reliability offers condition monitoring services that combine route-based and continuous methods with vibration, thermography, ultrasound, oil analysis, and motor current testing, which fits plants that need a working decision process, not just more data.
Building the Business Case with KPIs and ROI Calculation
A plant manager usually approves condition monitoring after a painful outage, not after a presentation on sensor features. A compressor trips, production misses shipment, maintenance pulls people off planned work, and finance sees the premium freight and overtime. That is the moment to show what earlier detection would have changed, and what it is worth.
The business case should start with avoided loss on a specific asset or process bottleneck. Keep it tied to failures the site has already experienced. If the argument depends on broad market adoption, abstract benchmarks, or perfect prediction accuracy, it will not survive budget review. Management wants to know three things. Which failures can be caught early, how much warning is realistic, and what financial outcome improves if the team acts on that warning.
An automotive stamping line makes the point clearly. Monitoring the press drive train alone may miss the actual cause of repeated damage if lubrication pressure drops during speed changes or hydraulic temperature rises during heavy production periods. The better case combines machine health signals with process context. Vibration may show a developing problem, but load, speed, pressure, temperature, and production state explain whether that problem is dangerous, intermittent, or normal for the duty cycle. That connection matters because it reduces false confidence and helps the team justify decisions with evidence the operations group recognizes.
The KPIs management will understand
Use KPIs that already matter in the weekly plant review. If the metric does not connect to production, maintenance cost, or schedule stability, it usually stays inside the reliability group.
The most useful measures are:
Avoided unplanned downtime
Track hours of production loss prevented by planned intervention on monitored assets.Planned versus emergency maintenance hours
Show whether the program is shifting labor away from callouts and rushed repairs.Repair cost per failure event
Compare emergency repair history with the cost of planned correction for the same failure mode.Schedule compliance
Measure whether earlier detection gives planners enough time to align work with production windows.Asset-specific MTBF
Use it only on assets with stable duty and clear failure history. On highly variable processes, context matters more than a sitewide average.Spare parts spend behavior
Look for fewer expedited orders, fewer duplicate purchases, and better use of shutdown inventory.
One warning. Do not promise that condition monitoring will improve every reliability metric at once. Some benefits show up first in work mix and overtime reduction, while MTBF and OEE may lag because the site is still working through existing defects.
A simple ROI structure that holds up
The strongest ROI model is built around one failure scenario with known consequences. Start with an event the plant has already paid for. A failed fan bearing on a non-critical utility line is rarely persuasive. A gearbox failure on a constrained production train usually is.
Use a structure like this:
Define the failure event
Name the asset, the failure mode, and the operating conditions that make it expensive. Include process context if that is what turns a manageable defect into a major outage.Calculate the current cost of that event
Use plant history where possible. Include lost production, overtime, contractor support, expedited freight, scrap, collateral damage, and startup losses after the repair.Estimate the warning window required
Ask a practical question. How much lead time does maintenance need to inspect, order parts, and repair the asset during a planned stop? If the technology cannot provide that window consistently, it should not carry the business case.Price the full program
Include sensors, installation, communications, software, analyst time, training, alarm review, and corrective work generated by findings. Cheap monitoring that no one reviews is wasted spend.Compare one prevented event against annual program cost
If avoiding one credible outage pays for the first year, the case is usually strong enough to move forward.
That last point matters. Plants often understate the labor needed to review exceptions, validate findings, and turn them into planned work. They also overstate savings by counting every alert as a prevented failure. A defensible case uses confirmed findings, not dashboard activity.
A good proposal also separates direct savings from secondary gains. Direct savings come from avoided downtime, lower repair cost, and less emergency labor. Secondary gains include safer work execution, better shutdown planning, and more disciplined inventory use. Both matter, but they should not be blended into one inflated number.
For teams trying to connect reliability gains to finance language, maintenance cost reduction planning at the plant level often helps turn failure history into a budget case that leadership will accept.
Management will also look for proof that the program can be governed. Show who owns KPI review, how avoided events will be validated, and how the site will treat false positives, missed detections, and changes in operating context. If those rules are not clear, the ROI model looks theoretical, even when the technical case is sound.
Your Implementation Roadmap and CMMS Integration Plan
A pilot goes wrong in a familiar way. Sensors get installed, alerts start arriving, and within a few weeks the maintenance team stops trusting them because half the notifications show up during startups, grade changes, or other operating shifts that were never tied to the machine data. The problem is rarely the hardware alone. The problem is implementing monitoring before the site has decided how findings will be reviewed, validated, and turned into planned work.
The plants that get results start narrower and with more discipline. A pulp and paper mill, for example, should begin with paper machine rolls, felt drives, and critical pump trains where early detection changes the maintenance outcome and production loss is easy to explain. That gives the team a manageable pilot, a clear consequence model, and enough repetition to learn what good data looks like.
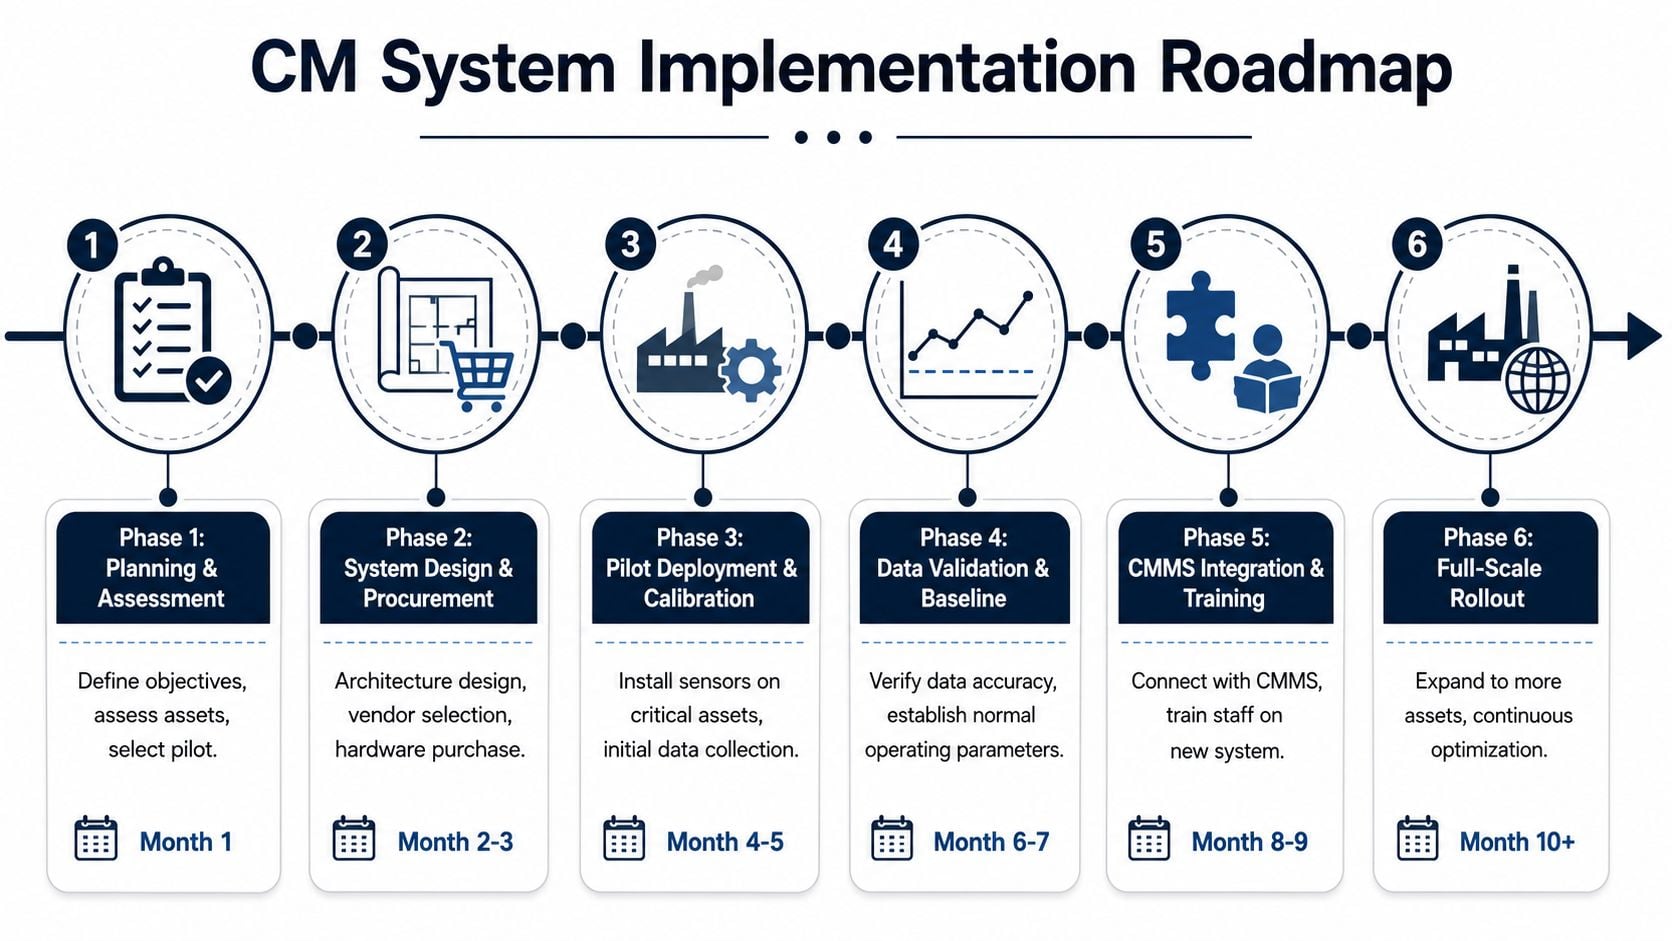
Phase 1 and Phase 2 planning and design
Phase 1 starts with asset criticality and decision points. Rank assets by safety exposure, production consequence, repair difficulty, spares risk, and how much warning time would help. A first pilot belongs on equipment where a reliable warning lets the planner schedule work, stage parts, and avoid secondary damage. That often rules out both the easiest machine to monitor and the loudest problem machine.
Phase 2 defines the monitoring design and the operating rules around it. The site needs to decide architecture, sensing method, communications path, alarm logic, and review ownership before installation starts. Sensor location should reflect bearing load zones, housing stiffness, transmission path, and the failure modes being targeted. If the team cannot explain why a point is measured, it usually should not be in the pilot.
A planning package should answer four questions:
- What failure modes are in scope? Bearing damage, lubrication breakdown, misalignment, looseness, cavitation, electrical defects, or process-induced instability
- What evidence will confirm them? Vibration, temperature, motor current, oil condition, ultrasound, or a combination
- What action follows each condition level? Inspect, change operating practice, schedule repair, or intervene immediately
- Who owns each step? Analyst, reliability engineer, supervisor, planner, and technician
Phase 3 and Phase 4 deployment and baseline
Phase 3 is deployment and commissioning. Weak programs often fail at this stage. Hardware installation is only one piece. Commissioning should include tag verification, point-to-asset validation, mounting inspection, rotation direction checks where relevant, communications testing, and a review of whether the signal changes in a way that matches actual machine behavior.
Baseline work deserves more attention than it usually gets.
Phase 4 establishes what normal looks like under different operating states. A paper machine roll does not have one normal signature. Startup, steady production, low load, grade change, wash-up, and upset conditions can all shift vibration, temperature, and power draw without indicating damage. If the baseline ignores those states, the plant trains itself to distrust the system.
The article's main point finds its practical application. Machine health data should be read with process data, not in isolation. A pump vibration increase means something different at reduced flow than it does at design flow. A motor current change during a process upset can explain a thermal rise that would otherwise look like a bearing problem. The goal is not more tags for the sake of more data. The goal is enough operating context to separate true degradation from normal process variation.
For many assets, that means linking each health indicator to a small set of process variables such as load, speed, flow, suction condition, temperature, pressure, or operating mode. Without that context, analysts and planners spend too much time sorting false positives from useful findings.
Phase 5 and Phase 6 CMMS integration and scale
Phase 5 turns detection into execution. The monitoring platform has to feed the CMMS in a form planners can use. Raw alerts should not become automatic work orders. That creates noise, weakens trust, and fills the backlog with work no one has screened. A better approach is a gated workflow where a qualified reviewer confirms the condition, assigns severity, adds supporting evidence, and then creates or recommends work with a clear job scope.
The handoff into maintenance planning should include:
- Exact asset and component identification
- Observed condition and change from baseline
- Operating context at the time of the finding
- Recommended follow-up action
- Diagnostic evidence that supports planner confidence
- Required timing based on risk, not just alarm state
That last point matters. A hot bearing on a standby pump and the same condition on a bottleneck production asset do not deserve the same response window.
For sites building that workflow into the maintenance system, CMMS implementation and integration planning often determines whether condition monitoring reduces failures or just creates another inbox. The CMMS should capture the finding, planned response, actual inspection result, completed repair, and closeout notes in a way the reliability team can review later. That feedback loop is how alarm rules improve and how finance sees that detected conditions led to confirmed defects, not just dashboard activity.
Phase 6 is expansion with tighter standards, not just more sensors. Add the next asset class only after the pilot has stable review routines, usable baselines, and clean work identification in the CMMS. Training should expand with it. Technicians need to know what evidence supports a predictive work order, planners need standard job templates for common defects, and reliability engineers need failure codes and closeout discipline that let them compare predictions with what was found in the field.
Scale works when each alert can be traced to a decision, each decision to a work order, and each work order to a verified outcome. That is the point where condition monitoring stops being a reporting layer and starts changing failure risk.
From Reactive Repairs to Proactive Reliability
Reactive maintenance keeps a plant moving until it doesn't. The team gets good at urgency, but urgency isn't a reliability strategy. Condition monitoring systems give plants a way to replace guesswork with evidence, provided the system is built around decisions instead of dashboards.
The practical sequence is straightforward. Choose the right architecture for the asset risk. Match sensing methods to real failure modes. Build a data path that preserves signal quality and operating context. Then make sure the result enters maintenance planning in a form the plant can act on. That's how a warning becomes a scheduled repair instead of a midnight outage.
For reliability engineers, maintenance managers, and plant leaders, this isn't just a maintenance upgrade. It's a control upgrade. Better condition monitoring improves planning quality, reduces unnecessary intervention, strengthens confidence in shutdown scope, and helps operations run critical equipment with fewer surprises.
A plant doesn't need to guess where to start. Forge Reliability offers a free reliability assessment to identify critical assets, evaluate current monitoring gaps, and outline a practical condition monitoring program that fits the site's failure risks, maintenance workflow, and CMMS maturity.