A production line rarely stops because a gearbox “suddenly” failed. Most of the time, the machine gave warning for weeks or months. Wear metals climbed. Contamination entered the housing. Viscosity drifted. The oil told the story long before the operator heard noise or maintenance found heat.
That's why oil sampling analysis matters to reliability engineers and plant leaders. It isn't a paperwork exercise for the lubrication route. It's one of the few diagnostic methods that can show what's happening inside a closed machine while it's still running and still profitable. For plants running critical pumps, compressors, turbines, mixers, conveyors, and process gearboxes, that insight changes maintenance from reaction to decision.
Table of Contents
- Why Oil Analysis Is Your First Defense Against Downtime
- Decoding the Language of an Oil Analysis Report
- How to Collect a Perfect Oil Sample Every Time
- Interpreting Results Trending and Setting Action Limits
- Advanced Diagnostics for Complex Equipment and Scenarios
- Integrating Oil Analysis into a World-Class Reliability Program
- Turn Your Data Into Action and Eliminate Unplanned Downtime
Why Oil Analysis Is Your First Defense Against Downtime
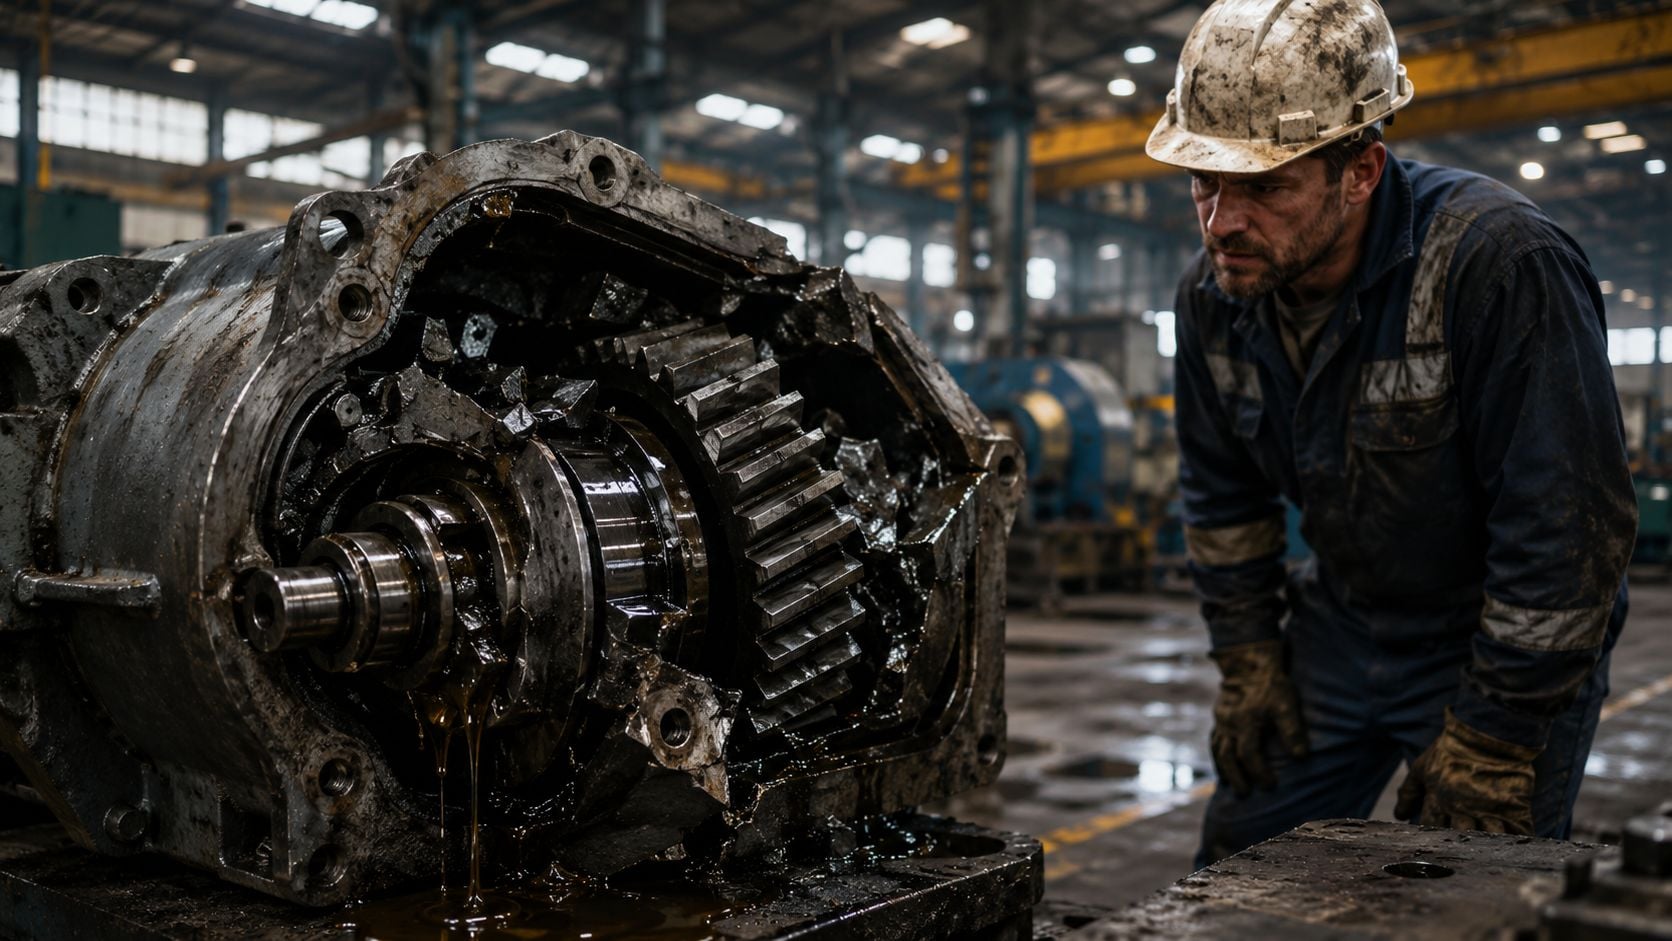
A seized gearbox on a packaging line doesn't just damage gears and bearings. It starves downstream equipment, forces schedule changes, creates scrap risk, and drags maintenance into emergency mode. In many plants, the teardown finds darkened oil, abrasive debris, and contamination that had been building for a long time.
Oil sampling analysis is the practical way to catch that progression early. It functions like a machine blood test, but the value isn't in one bottle and one report. The value comes from taking representative samples the same way, from the same place, and comparing the changes over time.
Modern programs still follow the same logic established after World War II, when the U.S. railroad industry began using oil analysis to monitor locomotive health and move from reactive repair to condition-based decisions, as documented in the history of oil analysis. That historical shift matters because it defined the core principle that still separates useful programs from weak ones. Trend the change, don't worship the single number.
For a plant reliability team, that principle applies across a wide range of assets:
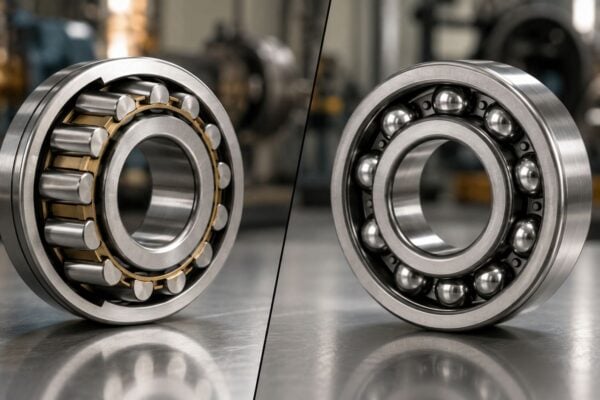
- Gearboxes: Wear metal trends can point toward gear mesh distress, bearing wear, or contamination ingress before vibration reaches an unmistakable fault pattern.
- Hydraulic systems: Oil condition helps expose contamination control problems, fluid degradation, and component distress that eventually show up as valve sticking or pump wear.
- Compressors and turbines: Lubricant health can reveal oxidation, contamination, and additive depletion early enough to plan action instead of reacting to a forced outage.
Practical rule: A bad oil analysis program creates false confidence. A disciplined one creates decision time.
Plants that want fewer surprises usually find that oil analysis becomes more valuable when it's treated as part of operations discipline, not just laboratory administration. The same teams often improve results further when oil analysis is tied to broader operations and maintenance practices such as route discipline, inspection quality, contamination control, and shutdown planning.
Decoding the Language of an Oil Analysis Report
A report lands in the inbox for a critical compressor. Iron is up, viscosity is off grade, and the lab has marked three items in red. One team schedules an inspection, another changes the oil, and a third does nothing because production cannot spare the machine. All three responses can be wrong if the report is read as a list of alarms instead of evidence tied to failure modes, asset criticality, and business risk.
That is the primary job of this section. Read the report well enough to decide what action protects production margin, not just what action clears a red flag.
What the report is really trying to tell the team
An oil analysis report usually answers three separate questions, and mixing them together is one of the fastest ways to make an expensive maintenance mistake.
First, is the machine wearing abnormally? Elemental wear data, ferrous debris results, and particle morphology can show that internal surfaces are breaking down before operators hear noise or vibration trends become conclusive. On a critical asset, that early warning buys planning time. On a non-critical asset, it may justify continued operation with tighter monitoring instead of immediate teardown.
Second, is the lubricant still capable of protecting the machine? Oil can lose that ability long before a component fails. Viscosity shift, oxidation, nitration, additive depletion, or base number loss can all change the lubrication regime and set up future wear.
Third, has contamination entered the system? Dirt, water, process fluid, soot, fuel, or the wrong top-up oil often point to handling, storage, sealing, or operating problems. Those issues need a different response than mechanical wear. Replacing bearings will not fix a dirty breather or poor transfer practice.
A centrifugal compressor makes the distinction clear. Rising wear metals suggest component distress. A viscosity change points to lubricant condition or contamination. Water or high particle count raises questions about seals, breathers, reservoir integrity, or maintenance practices. Same report. Different failure paths. Different cost consequences.
Common oil analysis tests and failure modes detected
| Test Name | What It Measures | Potential Failure Mode Detected |
|---|---|---|
| Wear metal analysis | Metallic elements present in the oil, often reported in parts per million | Bearing wear, gear wear, shaft or component distress |
| Viscosity | The oil's resistance to flow | Wrong oil in service, oxidation, fuel dilution, shear, thermal degradation |
| Particle count | The relative cleanliness of the fluid and suspended debris load | Dirt ingress, poor filtration, contamination control failure |
| Water content | Presence of moisture in the oil | Seal failure, condensation, washdown intrusion, corrosion risk |
| Oxidation indicators | Evidence of oil degradation from heat and time in service | Varnish formation, sludge development, shortened lubricant life |
| Additive condition | Remaining health of the oil's additive package | Additive depletion, reduced wear protection, reduced oxidation resistance |
| Acid/base condition | Chemical shift showing oil aging or reserve depletion | Lubricant degradation, corrosive conditions, loss of oil performance |
The right test slate depends on what failure would cost the business. A slow-speed conveyor gearbox in a dirty environment and a turbine lube system do not deserve the same panel, the same sampling interval, or the same action limits. World-class programs set up reports around asset failure modes and consequence of failure, not around a generic lab package applied to every machine in the plant.
A useful report separates wear, contamination, lubricant condition, and possible sampling error. That separation is what turns lab data into a profitable maintenance decision.
How to read the report in equipment context
Start with context before looking at severity flags. Was the machine rebuilt recently? Was oil added or changed? Did the unit sit idle? Has the asset been under unusual load, high temperature, or washdown exposure? Without that history, normal post-maintenance debris can be mistaken for active failure, and contamination can be dismissed as background noise.
Then read the report in layers.
- Start with lubricant condition. If viscosity, oxidation, or additive health are out of line, poor lubricant performance may be driving the wear pattern.
- Move to contamination. If particle count, water, or cross-contamination markers rise, inspect breathers, seals, storage containers, transfer tools, and filtration practices.
- Finish with wear evidence. Wear data carries more value when it matches machine metallurgy, operating conditions, and prior samples.
This sequence matters because it prevents teams from treating symptoms first. I have seen plants replace components when the actual problem was moisture ingress, and I have seen teams change oil repeatedly when the machine was generating active wear that the fresh charge could not hide for long.
For failure elimination work, report interpretation has to connect with real component damage. The practical guidance in bearing, gear, and seal failure interpretation helps link wear patterns and lubricant condition to likely physical damage inside the machine.
One final point. A single report can support a decision, but a series of reports supports a good one. The rate of change usually matters more than the isolated number, especially on critical assets where the goal is not just to find a problem, but to decide when intervention produces the best economic result.
How to Collect a Perfect Oil Sample Every Time
Poor sampling is one of the fastest ways to waste a predictive maintenance budget. The team pays for the bottle, the shipment, the lab work, and the review, then bases a decision on a sample that never represented the machine in the first place.
In a high-pressure hydraulic power unit, this usually happens when someone grabs oil from the wrong place because it's convenient. The result looks official, but it tells the team more about stagnant fluid or settled debris than active machine condition.
Choose a live sampling point
Representative samples come from a live zone, not from wherever access is easiest. For circulating systems, guidance commonly favors the return line rather than the reservoir, and a practical rule of thumb is sampling around 50% of the oil level, based on oil sampling guidance from Des-Case. The point is to capture oil that is moving and mixed.
For sump or dipstick extraction, the sample has to come from the turbulent zone rather than the top surface or the sediment-heavy bottom. A drain plug often pulls settled material that overstates wear. The bottom of a dipstick tube can do the same thing if the tube isn't retracted.
A good port location usually follows three rules:
- Upstream of filtration: Sampling after the filter can hide the actual contaminant load the machine is experiencing.
- In an active flow path: The fluid should be circulating, mixed, and representative of what components are seeing.
- Consistent from sample to sample: The same machine must be sampled from the same point, using the same method, every cycle.
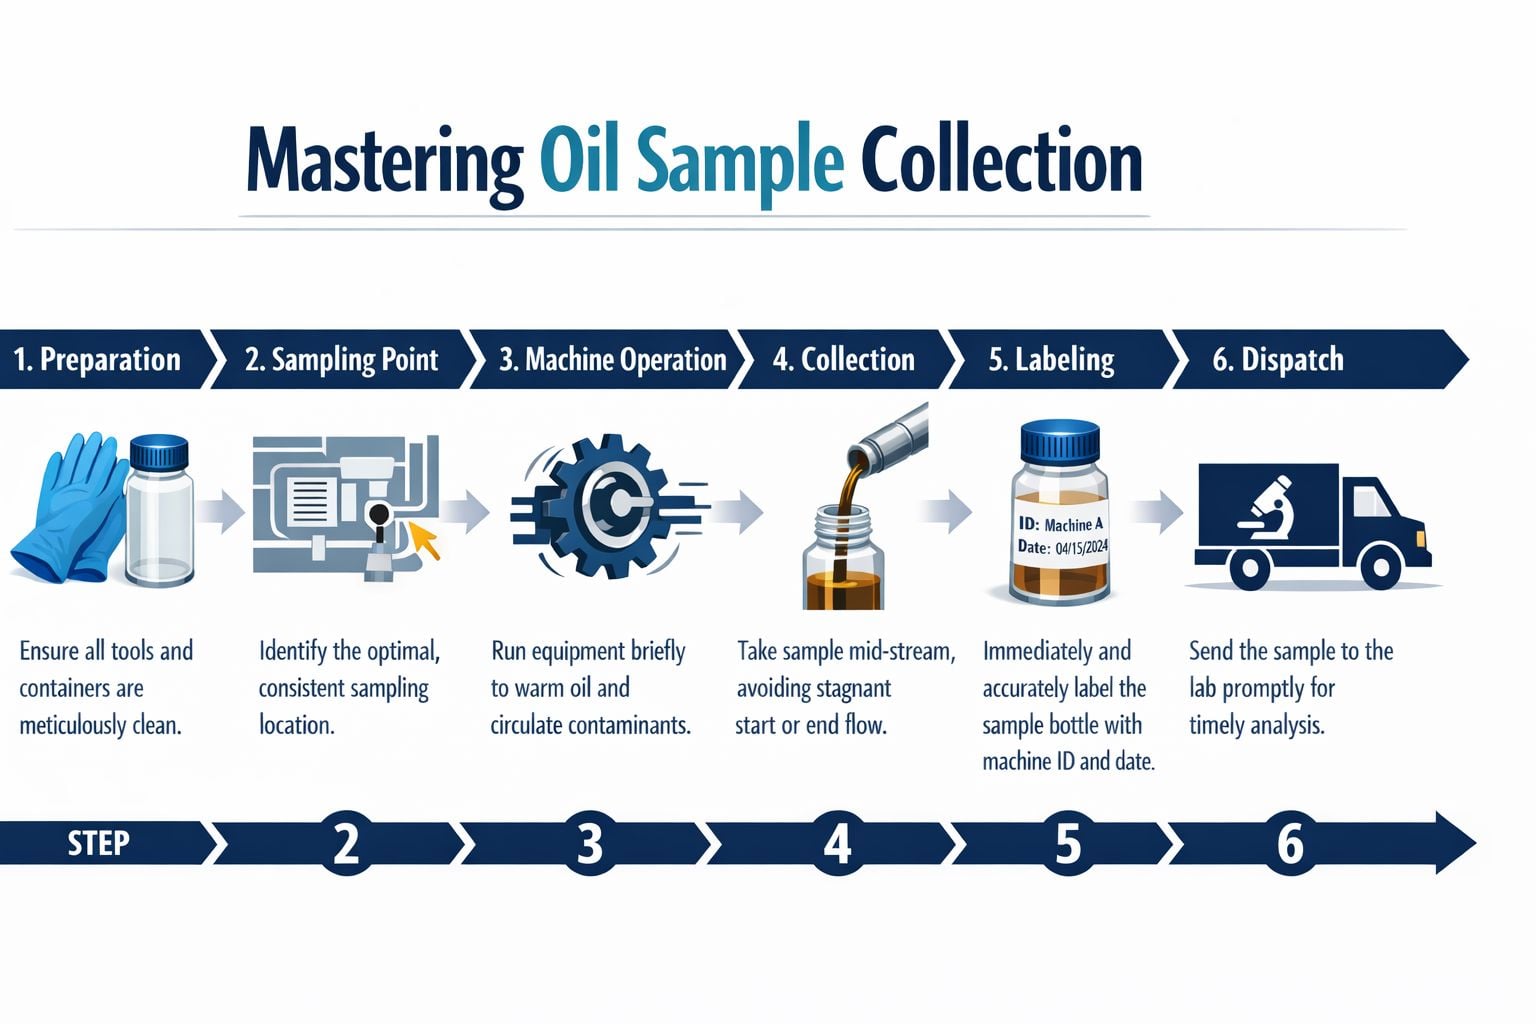
Follow a repeatable collection routine
Sampling consistency is the number one rule because trend quality depends on repeatability. Good technicians don't improvise the method each month. They standardize it.
For a hydraulic system or circulating gearbox, a disciplined routine looks like this:
- Verify the machine state. Sample under normal operating conditions when the oil is circulating and contamination is suspended.
- Prepare clean hardware. Use clean bottles, clean tubing if tubing is required, and keep the cap protected from airborne contamination.
- Flush dead space before collecting. Pre-flushing the sampling valve matters because stagnant oil in the port does not represent active conditions.
- Collect the sample cleanly. Fill the bottle to the required level and cap it immediately.
- Document the context. Machine ID, lubricant type, date, operating condition, recent maintenance, and any abnormal observations should travel with the sample.
Pre-flushing deserves special attention. The required protocol is to flush 10 times the volume of the dead space, such as 10 ounces for 1 ounce of dead space, so the sample reflects active system conditions, as outlined in oil analysis best practices from Forge Reliability. Unflushed samples can inflate wear metal counts and send a team into an unnecessary teardown.
What ruins the sample
The most common failures are simple, and they're expensive.
- Sampling from the drain plug: This often captures settled debris, not representative oil.
- Using inconsistent depth with a tube: A different insertion depth changes the particle profile and destroys the trend.
- Collecting after the machine has cooled: Stratification and settling distort the picture.
- Skipping labeling details: A perfect sample with weak documentation still creates bad decisions.
- Treating the bottle cap casually: A contaminated cap can contaminate the sample.
The sample procedure should be controlled like a calibration task. If the method changes, the trend changes, even if the machine doesn't.
Plants that want stronger repeatability often build sampling into their broader condition monitoring and lubrication systems rather than leaving it as an informal task on a route sheet. That's when oil sampling analysis starts behaving like a true diagnostic program instead of a compliance activity.
Interpreting Results Trending and Setting Action Limits
A maintenance planner gets a report on Monday that looks acceptable. By Friday, the gearbox is louder, oil temperature is up, and production wants answers. The problem was not the lab result. The problem was treating one sample as a verdict instead of part of a trend.
Trend interpretation is where oil analysis starts paying for itself. A single report shows current condition. A trend shows whether the machine is stable, drifting, or accelerating toward failure. That difference matters because profitable decisions come from timing. The goal is not to react to every abnormal result. The goal is to intervene early enough to prevent secondary damage, but late enough to use the asset's remaining life.
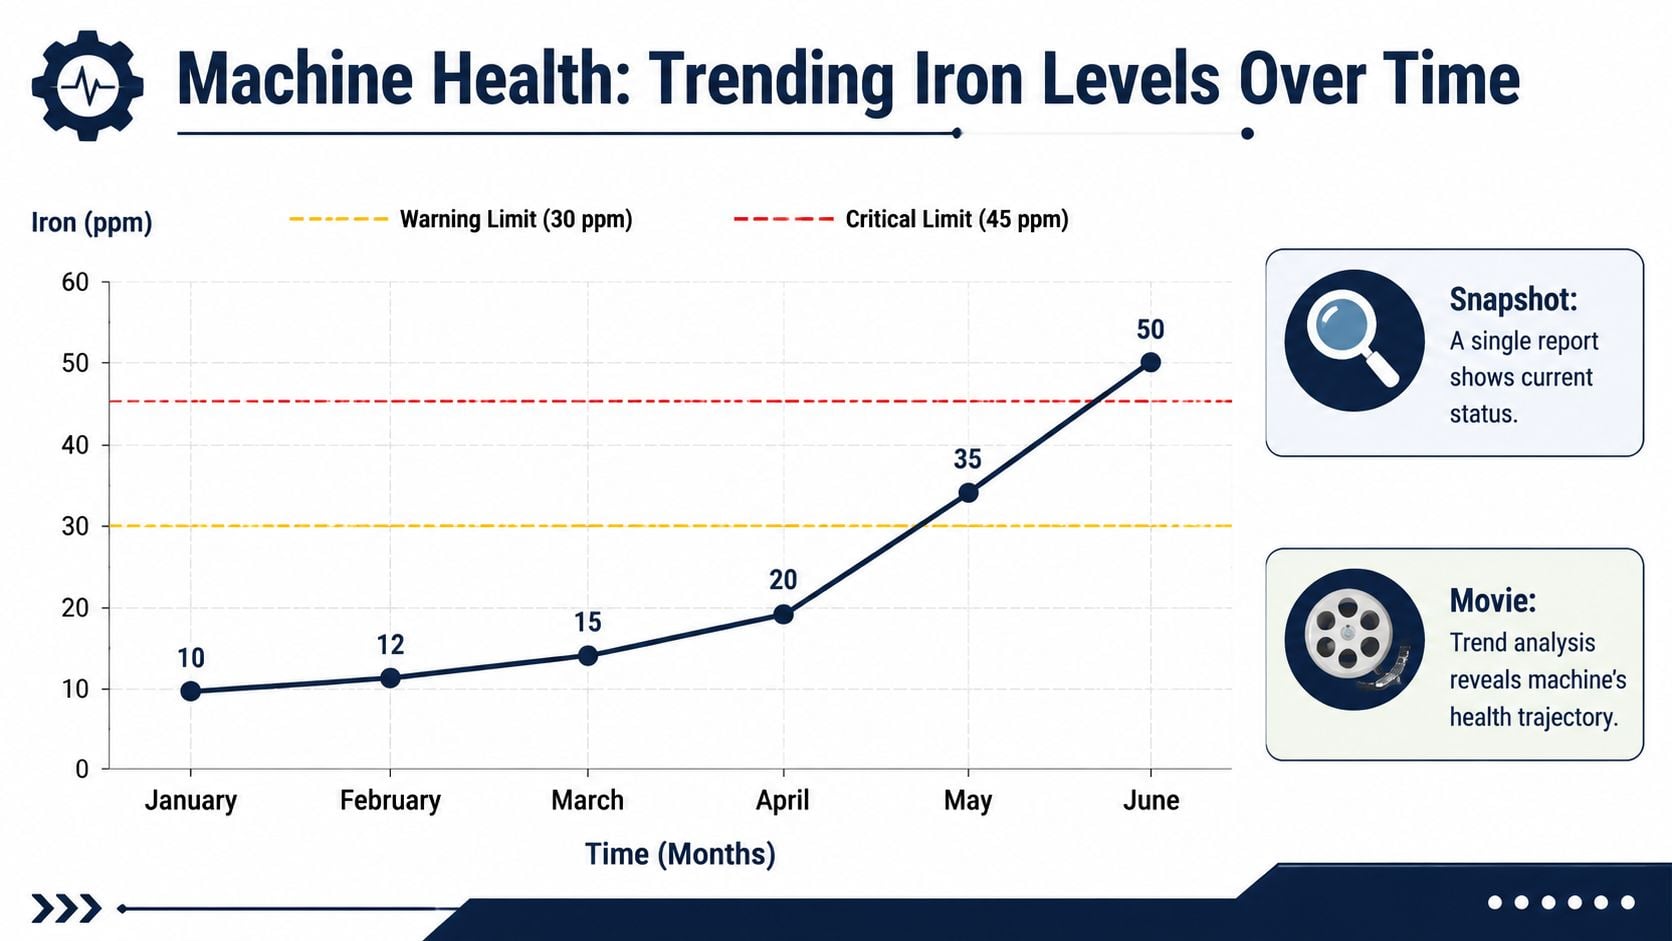
A single report is a snapshot
High iron by itself does not tell the whole story. A gearbox with moderate iron that has held steady for six months may stay in service with routine checks. A gearbox that jumps sharply over two intervals, especially with rising silicon, viscosity shift, or oxidation, deserves immediate attention. Rate of change is often more useful than the absolute number.
That is why every serious program starts with a baseline for each asset class and then tightens it by machine. Compare the pump to its own history under similar load, temperature, and oil age. Generic alarm tables have value, but they are a poor substitute for machine-specific trends.
A useful review asks a few direct questions:
- Is the slope gradual, or has it changed abruptly?
- Are wear metals, contamination markers, and oil condition moving together?
- Did anything operational change, such as a shutdown, filter change, oil top-up, rebuild, or process upset?
- Is the sampling interval still appropriate for the risk and failure pace of this asset?
That last point gets missed. Critical assets with high business impact need tighter review intervals and faster response rules than non-critical utility equipment. If a forced outage costs far more than the sampling program, the action limits should reflect that economics, not just lab convention.
How to set action limits that drive decisions
Action limits should tell the team what to do next. They should not just turn a cell red.
I recommend three bands. Normal means continue the route and maintain the interval. Alert means inspect the machine in the field, verify the sample context, and watch the next result closely. Action means plan corrective work or trigger secondary diagnostics now. On a production gearbox, that may include checking breathers, seals, oil level, and load, then confirming condition with motor vibration analysis for rotating equipment faults if the oil trend points to active wear.
The trade-off is straightforward. Limits set too tight create nuisance work orders and train the plant to ignore the system. Limits set too loose delay intervention until the repair is larger, the outage is harder to schedule, and the failure spreads debris through the housing. Good limits are built from asset criticality, failure modes, and what the plant can realistically do with the warning.
Field judgment still matters. A stable but elevated reading can be less urgent than a machine showing fast chemical change and rising debris across consecutive samples.
Lab reporting also affects action limits. Fast turnaround has value only if the result reaches someone who can make a decision and if the history is easy to interpret. A report with strong comments, consistent test slates, and clear trend visibility supports planning. A report that arrives after the weekly scheduling meeting often pushes a preventable problem into the next cycle.
Oil sampling analysis produces measurable ROI when the sample interval, alarm logic, and maintenance response are built around business risk. That is the step many programs skip. They collect data faithfully, then apply the same limits to every machine. World-class programs do the opposite. They set tighter control on assets that can hurt production, safety, or repair cost, and they use the trend to choose the right work at the right time.
Advanced Diagnostics for Complex Equipment and Scenarios
Standard advice works well for circulating systems. It breaks down in plants where equipment spends long periods idle, contamination settles fast, and the sample point is a compromise rather than an ideal location. Chemical processing and food and beverage sites see this regularly on batch mixers, kettle drives, jacketed reactor gearboxes, and intermittently operated transfer systems.
In these environments, the biggest risk isn't always a false positive. It's the false negative that convinces the team the machine is clean when the damaging material has settled out of suspension.
The quiet drain problem in batch operations
A NIST study found that 42% of false-negative oil analysis results in batch-process industries stem from sampling after equipment has been idle for more than 30 minutes, allowing particulates to settle, as noted in guidance discussing the need for a flush and snap protocol immediately after shutdown in these environments in the Amsoil oil analysis article. For reliability engineers, that finding explains a familiar frustration. The machine opens up dirty, but the report looked acceptable.
The failure mechanism is straightforward. During idle time, dense wear debris and contamination fall out of suspension. A quiet drain sample taken later may pull cleaner-looking oil from above the settled layer. The sample doesn't represent what the machine was carrying during operation.
When standard sampling advice fails
A batch reactor gearbox in a chemical plant is a good example. If the unit runs, stops, and sits while operators complete the process cycle, the lubrication sample has to be tied to that operating rhythm. A routine route taken long after shutdown can understate real wear and contamination.
A more defensible approach in these cases includes:
- Sample immediately after shutdown: The goal is to catch the oil before settling changes the particle distribution.
- Use a flush-and-snap method from the available port: If the machine lacks an ideal live-zone port, the team should at least remove stagnant material before collecting.
- Document idle time: “Sampled after shutdown” is not enough. The time gap matters because settling changes the result.
- Escalate suspect results: If the sample history and machine condition don't agree, the team should challenge the method before trusting the conclusion.
This is also where oil analysis should not stand alone. If the machine has repeat alarms, recurring filter loading, abnormal temperature, or changing vibration, the team should compare evidence across technologies. A practical example is pairing lubricant findings with motor vibration analysis on driven equipment to separate lubrication-related wear from alignment, looseness, or process loading problems.
Escalating from detection to root cause
Complex equipment often needs more than routine screening. A steam turbine lube system with recurring varnish symptoms, or a critical gearbox with unexplained metallic debris, may require expanded diagnostics and a root cause path rather than another standard sample.
That escalation usually follows a sequence:
- Confirm sample integrity. Bad collection invalidates everything downstream.
- Compare with operating evidence. Temperature, noise, load, filtration behavior, and inspection findings should support the oil result.
- Decide whether the issue is lubricant, contamination, or component wear. The work scope depends on that distinction.
- Use targeted follow-up testing or inspection. The point is not to order every available test. It's to answer the next decision question.
When teams skip that discipline, they either miss failures or chase noise. Advanced oil sampling analysis isn't about making the program more complicated. It's about recognizing when standard methods no longer describe the machine accurately.
Integrating Oil Analysis into a World-Class Reliability Program
Oil data has no financial value until it changes work selection, outage timing, or failure elimination. A mature program doesn't end when the lab report is filed. It starts there.
That matters most in multi-site operations and larger plants, where the common failure isn't “no sampling.” It's sampling the wrong assets at the wrong frequency. Critical machines get treated like utility pumps, while low-risk equipment gets routine lab work because it's easy to reach and already on the route.
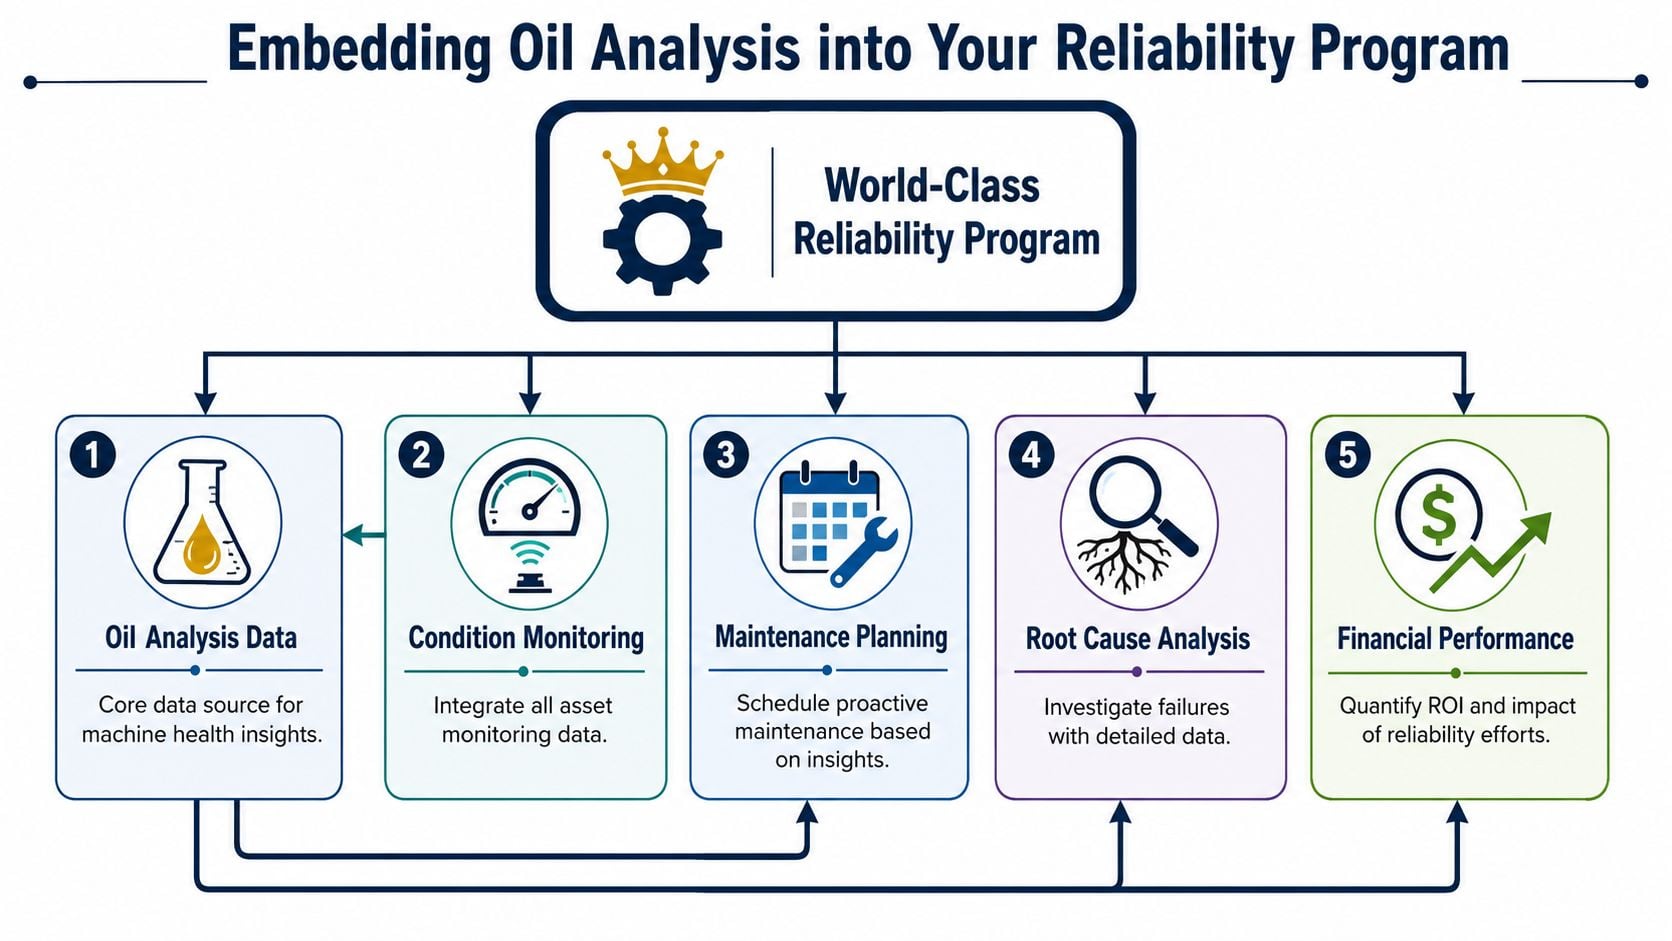
Set frequency by business risk not habit
A 2024 analysis by the International Center for Asset Reliability found that 68% of industrial facilities over-sample low-risk assets while under-sampling high-risk assets, wasting up to 23% of predictive maintenance budgets, which is why sampling frequency should be tied to asset criticality and FMEA, as summarized in this discussion of sampling frequency and reliability ROI. That's the strategic gap in many programs. The route is fixed, but the business risk is not.
A reliability-focused frequency decision usually considers:
- Criticality of the asset: What happens to throughput, safety, quality, or environmental exposure if it fails?
- Failure modes that oil can detect: Some machines justify frequent sampling because lubricant condition is an early and reliable indicator.
- Failure development window: If the defect can move from detectable to functional failure quickly, the interval must be shorter.
- Maintenance response capability: Sampling faster than the plant can act doesn't improve reliability.
A turbine-driven compressor in a process plant and a non-critical utility pump should not be sampled on the same logic. One threatens production continuity. The other may only affect convenience or redundancy.
Connect oil data to planning and failure elimination
The best programs push findings directly into maintenance planning. If a critical alarm is triggered, the team should know whether that means inspect, filter, change oil, verify contamination control, schedule downtime, or launch a root cause analysis. Delay usually comes from ambiguity, not lack of data.
That's also where oil analysis strengthens FMEA and RCM work. If repeated samples show contamination as the dominant precursor in a gearbox fleet, the maintenance strategy may need better breathers, handling controls, storage practices, and seal inspections rather than more frequent rebuilds. If additive depletion appears before the current PM interval, the lubrication task needs redesign.
A practical operating model often includes:
- Defined ownership: Someone reviews the report, someone validates the machine context, and someone authorizes the maintenance response.
- CMMS integration: Actionable alarms should convert into planned work, not sit in email.
- Closed-loop review: After intervention, the next samples should confirm whether the fix worked.
One option for plants that need structured execution is a provider-run sampling and laboratory workflow. Forge Reliability offers oil analysis logistics and distribution as part of broader condition monitoring services for industrial equipment, which is useful when sites need standardized sampling, reporting, and decision support without building the entire system internally.
What a mature program looks like
A strong program usually has visible characteristics. Sampling points are engineered, not improvised. Interval decisions align with criticality. Reports are reviewed in the context of machine history. Oil data informs planning, not just records. Repeated findings trigger corrective action on root causes.
The larger reliability system matters too. Teams that are formalizing this work often benefit from a documented 12-month roadmap for building a reliability program so oil analysis isn't isolated from planning, inspection quality, and asset strategy.
Oil analysis should answer a business question, not just a technical one. Which machine needs attention first, what action is justified, and what failure can be prevented if the team acts now?
Turn Your Data Into Action and Eliminate Unplanned Downtime
Oil sampling analysis works when the plant treats it as a decision system. The sample has to be representative. The report has to be interpreted in equipment context. The trend has to trigger action before the failure reaches production.
That's what separates a world-class program from a stack of lab reports in a shared folder. The disciplined program finds contamination before it turns into wear, catches wear before it turns into damage, and uses every interval to refine maintenance strategy. For a gearbox on a packaging line, a hydraulic power unit in a metals plant, or a reactor drive in chemical processing, that difference shows up in schedule stability and repair cost.
Most facilities already own enough critical assets to justify the effort. The gap is usually design, not intent. Sampling points may be wrong. Frequencies may be inherited instead of engineered. Alarm responses may be unclear. Those are fixable problems.
The next step is to objectively assess the current program. Which assets are worth sampling. Which sample points are producing trustworthy data. Which reports are driving profitable maintenance decisions. And which alarms are being ignored because the process around them is weak.
Forge Reliability offers a free, no-obligation reliability assessment through Forge Reliability to identify where an oil sampling analysis program can deliver the most impact in a facility. For teams trying to reduce unplanned downtime, improve sampling discipline, and connect lubricant data to better maintenance decisions, that assessment is a practical place to start.