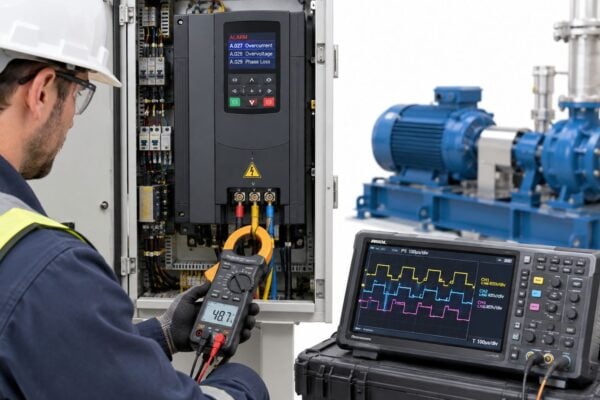
A maintenance manager walks into the morning meeting with a backlog full of legitimate problems. A cooling tower fan bearing is running hot. A piston compressor has started short-cycling. A process pump shows intermittent seal leakage. Operators want the noisy gearbox fixed first because they hear it every shift. Production wants the compressor addressed because it threatens throughput. Safety wants the fan reviewed because loss of cooling affects the whole unit.
That's where many plants stall. The problem usually isn't effort. It's prioritization. Without a common method, the loudest failure mode wins, the most recent breakdown gets all the attention, and chronic risks hide in plain sight.
Risk priority numbers give teams a structured way to sort that mess. In Failure Modes and Effects Analysis (FMEA), RPN turns three dimensions of risk into one ranking value so engineers, planners, and operations leaders can decide what deserves action first. Used well, it brings discipline to maintenance decision-making. Used poorly, it creates false confidence and sends resources to the wrong place. Facilities that want better execution usually need stronger ties between analysis and operations and maintenance planning, not just another spreadsheet.
Table of Contents
- From Chaos to Clarity Prioritizing Maintenance Risk
- Deconstructing the RPN Formula Severity Occurrence and Detection
- Calculating RPN A Worked Example for a Piston Compressor
- Establishing Your Scoring Scales and Action Thresholds
- The Hidden Pitfalls of Traditional Risk Priority Numbers
- Beyond RPN Modern Alternatives for Better Risk Analysis
- Operationalizing Risk From Numbers to Actionable Maintenance
From Chaos to Clarity Prioritizing Maintenance Risk
A food and beverage plant may have three compressor-related problems open at the same time. One machine has high discharge temperature. Another has recurring valve issues. A third has poor capacity control and wastes energy but hasn't failed outright. Every one of those issues matters, but they don't carry the same operational risk.
FMEA was built for this exact situation. It forces a team to define the failure mode, describe the effect, identify the cause, and score the risk in a way the whole site can understand. The value of risk priority numbers isn't mathematical elegance. The value is alignment. Planners, operators, maintenance, and engineering can look at the same failure mode and discuss the same criteria instead of arguing from instinct.
Practical rule: RPN works best when the team uses it to support judgment, not replace judgment.
In plant settings, the biggest improvement often comes from standardizing the conversation. A pump seal leak in a utility service isn't scored the same way as a seal leak on a product transfer pump in a sanitary process. A cracked fan blade on a redundant ventilation unit isn't treated the same as the same defect on a single-point-of-failure induced draft fan. The RPN process makes those distinctions visible.
That said, no experienced reliability team should stop at the final number. The number helps rank work. It doesn't think for the team. It doesn't understand safety context. It doesn't know whether the current inspection route is weak, or whether operators have normalized a developing defect. Those details still need engineering review.
Deconstructing the RPN Formula Severity Occurrence and Detection
The classic FMEA method defines RPN = Severity × Occurrence × Detection, with each factor commonly rated on a 1 to 10 scale. That creates a range from 1 to 1000, where 1 × 1 × 1 = 1 and 10 × 10 × 10 = 1000 according to this overview of the Risk Priority Number formula.
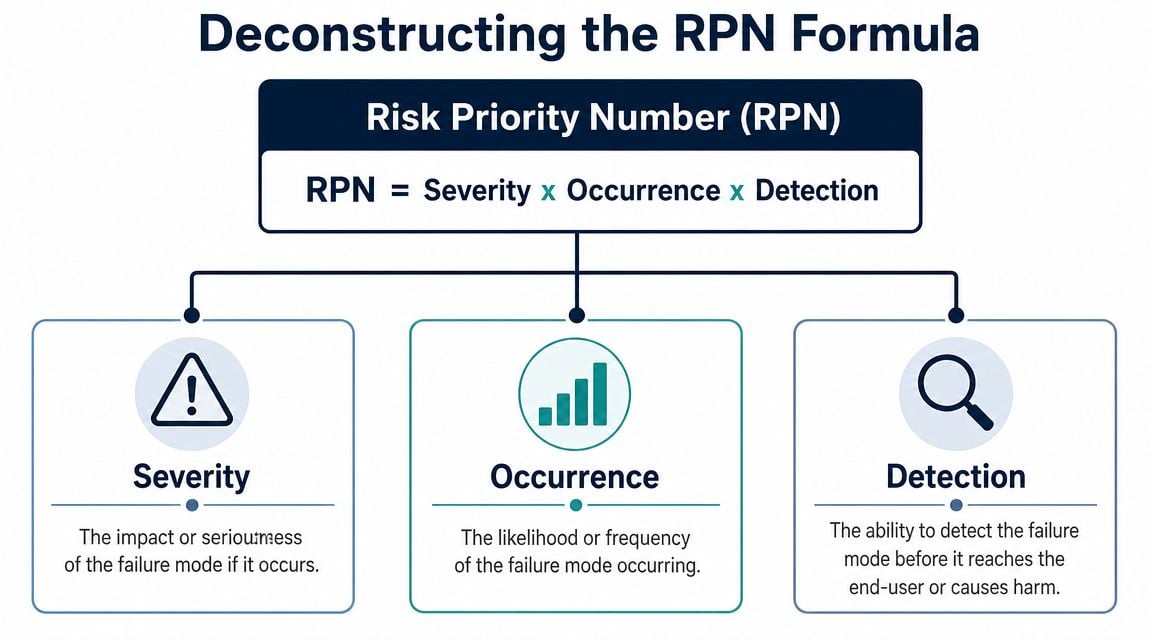
For industrial teams, that formula is useful because it compresses consequence, likelihood, and control effectiveness into one sortable value. In practice, though, each part of the formula needs a disciplined definition. If one team treats detection as “can anyone see something wrong” and another treats it as “can current controls reliably catch the failure before functional loss,” the numbers become noise. A well-built maintenance FMEA workflow depends on scoring consistency more than spreadsheet formatting.
Severity reflects consequence
Severity asks one question. If this failure mode happens, how bad is the outcome? In a cooling tower fan bearing example, low severity might mean nuisance vibration with no production effect. High severity might mean loss of cooling capacity, process upset, environmental exposure, or a safety risk from secondary equipment overheating.
A reliable severity scale should account for more than repair cost. Teams usually score for:
- Safety impact if the failure could expose personnel to injury risk
- Environmental consequence if loss of containment or emissions are possible
- Production effect if the failure constrains throughput, quality, or batch continuity
- Asset damage if the failure cascades into shafts, housings, couplings, or motors
Occurrence reflects how often the plant gets exposed
Occurrence isn't a gut feel. It should come from CMMS history, operator logs, inspection findings, and known duty-cycle stress. On that same cooling tower fan, bearing failure occurrence goes up if lubrication intervals drift, alignment is poor, grease contamination is common, or the fan runs through heavy seasonal cycling.
Good occurrence scoring pulls from evidence such as:
- Repeat work orders for the same mode
- Mean time between similar failures
- Operating context such as washdown, dust, heat, or variable loading
- Known design weaknesses like undersized bearings or poor sealing
Detection reflects control strength
Detection is the most misunderstood part of RPN. It doesn't ask whether the plant could theoretically notice the issue. It asks how likely the current controls are to detect the failure mode early enough to prevent the consequence.
On a fan bearing, weekly visual rounds might catch grease purge or noise, but they won't reliably identify early inner-race damage. Vibration analysis, ultrasound, and temperature trending create a much stronger detection position because they identify defect growth before the bearing reaches functional failure.
Detection scores should reflect what the plant is actually doing today, not what the team hopes to implement next quarter.
That distinction matters. A site with no route-based condition monitoring shouldn't score itself as highly detectable just because a technology exists.
Calculating RPN A Worked Example for a Piston Compressor
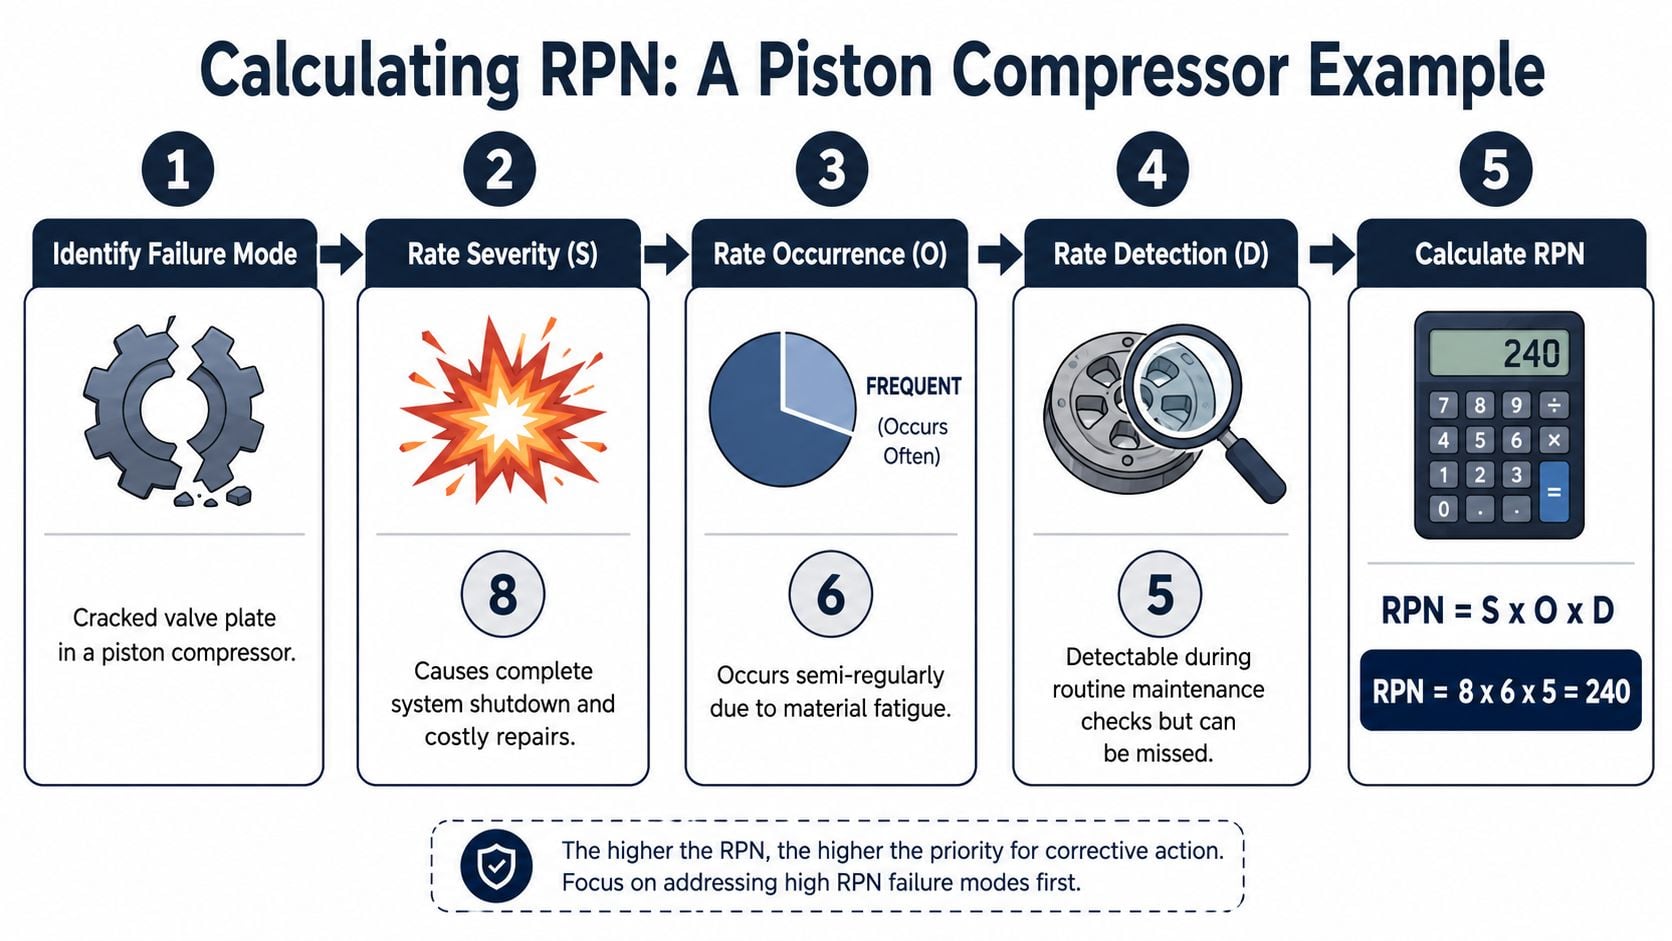
A multi-stage piston compressor in a food and beverage facility develops a recurring failure mode. The team identifies cracked valve plate as the specific mode to analyze. The effect is reduced compressor efficiency, potential shutdown, unstable air supply to downstream users, and possible product risk if the compressed air system supports sensitive operations.
The asset matters because compressors often sit in an awkward reliability category. They aren't always the most visible production machines, but when they fail, many dependent systems degrade at once. That makes them ideal candidates for FMEA and risk priority numbers.
A good compressor program starts with a clear equipment strategy, not just emergency repairs. That's why many sites pair FMEA work with a more detailed industrial compressor maintenance guide so failure ranking connects to inspection, overhaul, and condition monitoring tasks.
Scoring the failure mode
For this example, the team scores the cracked valve plate as follows:
- Severity = 9. The failure can force shutdown and create serious production consequences in a regulated process environment.
- Occurrence = 4. Maintenance records show the issue appears periodically rather than frequently.
- Detection = 6. The plant relies on operator rounds, changing performance, and general trend review. Those controls can catch some cases, but not early and not consistently.
The calculation is straightforward:
| Factor | Score | Reason |
|---|---|---|
| Severity | 9 | High operational consequence if the valve plate cracks |
| Occurrence | 4 | Intermittent repeat mode based on site history |
| Detection | 6 | Moderate chance of catching the problem before escalation |
RPN = 9 × 4 × 6 = 216
That number doesn't mean the risk is “216 units” of anything. It means this failure mode ranks high enough that the team shouldn't leave it in the general backlog.
What the score should trigger
A useful RPN discussion doesn't stop with the multiplication. The team should immediately ask where the reduction should come from.
For a cracked compressor valve plate, the options usually fall into three buckets:
- Reduce occurrence by reviewing valve material selection, compressor loading pattern, suction filtration, lubrication carryover, and thermal stress.
- Improve detection by tightening performance trending, adding structured inspection criteria during PMs, or using vibration and ultrasonic methods to identify developing valve distress.
- Lower severity indirectly by improving system redundancy or isolating the process impact so a single compressor failure doesn't take down a whole area.
High RPNs become useful only when they point to a specific engineering response.
In many compressor systems, the fastest improvement comes from detection and occurrence together. Better monitoring catches the problem sooner, while root-cause work reduces how often the valve plate fails in the first place.
Establishing Your Scoring Scales and Action Thresholds
An RPN is meaningless if each team invents its own definitions. One planner's “moderate” occurrence can be another engineer's “rare.” One operations leader may call a failure severe because it hurts schedule adherence, while another only uses the top end of the scale for safety events.
That's why plants need a documented scoring matrix before they need a software field for RPN. The matrix should define what each score means in site language. A chemical plant may score environmental release risk heavily. A packaging line may emphasize throughput and customer service. A water treatment facility may place regulatory compliance near the top of severity.

Build one plant standard
Some sites prefer a full 1 to 10 scale because it creates more distinction between failure modes. Others use a compressed internal scale for simpler workshops, then map those values into the formal FMEA sheet. Either approach can work if the definitions are stable.
What doesn't work is mixing scales by department or asset class without translation rules.
A practical scoring standard usually includes:
- Asset examples for each severity band, such as pump seal leak, fan bearing seizure, or compressor valve failure
- Historical references for occurrence so the team isn't guessing
- Control-based definitions for detection, ranging from weak operator observation to reliable condition monitoring and test methods
- Review ownership so one reliability lead or cross-functional team audits scoring consistency
Use thresholds with override rules
RPN needs action limits, but those limits should never be the only rule. Criticism of traditional RPN has led many practitioners to use thresholds instead of sorting by number alone, with some applying action limits in the 80 to 125 range and requiring action whenever severity is 9 or 10, regardless of final score, as described in this discussion of common RPN threshold practice and its limits.
That severity override matters on plant assets such as ammonia compressors, critical steam valves, or reactors with loss-of-containment scenarios. A low occurrence score can hide a dangerous consequence if the team only watches the final product of the formula.
A workable threshold policy often looks like this:
- Above the site action limit calls for a formal mitigation plan
- High severity regardless of RPN triggers engineering review
- Weak detection on critical assets prompts monitoring upgrades even if the final score isn't at the top of the list
The Hidden Pitfalls of Traditional Risk Priority Numbers
Risk priority numbers became popular because they're simple. That simplicity is also the problem. The method rose through Six Sigma and modern FMEA practice as a practical prioritization tool, but it's been criticized for mis-ranking risk because different Severity, Occurrence, and Detection combinations can produce the same product. That criticism is one reason teams now use threshold rules and severity overrides rather than relying on the number alone.
The first trap is treating RPN as if it were a precise linear measurement. It isn't. The score comes from multiplying ordinal rankings. Those rankings represent categories, not calibrated probabilities. So a move from one score to another doesn't carry the same meaning across the full range.
Equal products can hide unequal risk
Take two industrial examples on the same site:
- Ammonia compressor seal release risk with S = 10, O = 2, D = 4, giving RPN = 80
- Packaging conveyor sensor nuisance trip with S = 4, O = 4, D = 5, also giving RPN = 80
A simple sort puts them side by side. No experienced plant team should treat them as equivalent. One is a rare but severe process hazard. The other is a recurring production annoyance. They may both deserve action, but not for the same reason, and not with the same urgency.
That's why maintenance groups that rely only on ranked RPN lists often misallocate effort. They end up burning engineering hours on chronic nuisance modes while accepting high-consequence exposures that happened to multiply into a lower-looking number.
A severe failure mode with a moderate RPN can be more important than a nuisance failure mode with a higher RPN.
RPN can tempt teams into shallow decisions
Another common failure is chasing the easiest arithmetic reduction instead of the best risk reduction. Detection is often the cheapest score to improve on paper. Add an inspection step, revise a route, or increase review frequency, and the RPN drops. But if the underlying cause remains untouched, the plant hasn't truly reduced exposure. It has only improved the chance of seeing the problem a bit earlier.
That distinction matters on assets like slurry pumps, cooling tower fans, and piston compressors. If a site has recurring bearing contamination, cracked valve plates, or seal failures, the best long-term move is often occurrence reduction through design, lubrication, alignment, filtration, or operating practice changes.
The most effective use of RPN is as a trigger for deeper questions:
| Question | Why it matters |
|---|---|
| Is the failure severe enough to require action regardless of score? | Prevents dangerous under-ranking |
| Are current controls actually capable of early detection? | Stops optimistic scoring |
| Is the team reducing symptoms or causes? | Keeps effort focused on durable fixes |
Sites that mature beyond spreadsheet FMEA usually combine this thinking with broader predictive versus preventive maintenance strategy so risk ranking directly affects inspection design, condition monitoring, and work execution.
Beyond RPN Modern Alternatives for Better Risk Analysis
Once a plant sees the blind spots in traditional RPN, the next question is practical. What should replace it, or at least supplement it? The best answer depends on program maturity, regulatory pressure, and how disciplined the site is about using risk outputs inside daily maintenance work.
Why Action Priority changes the conversation
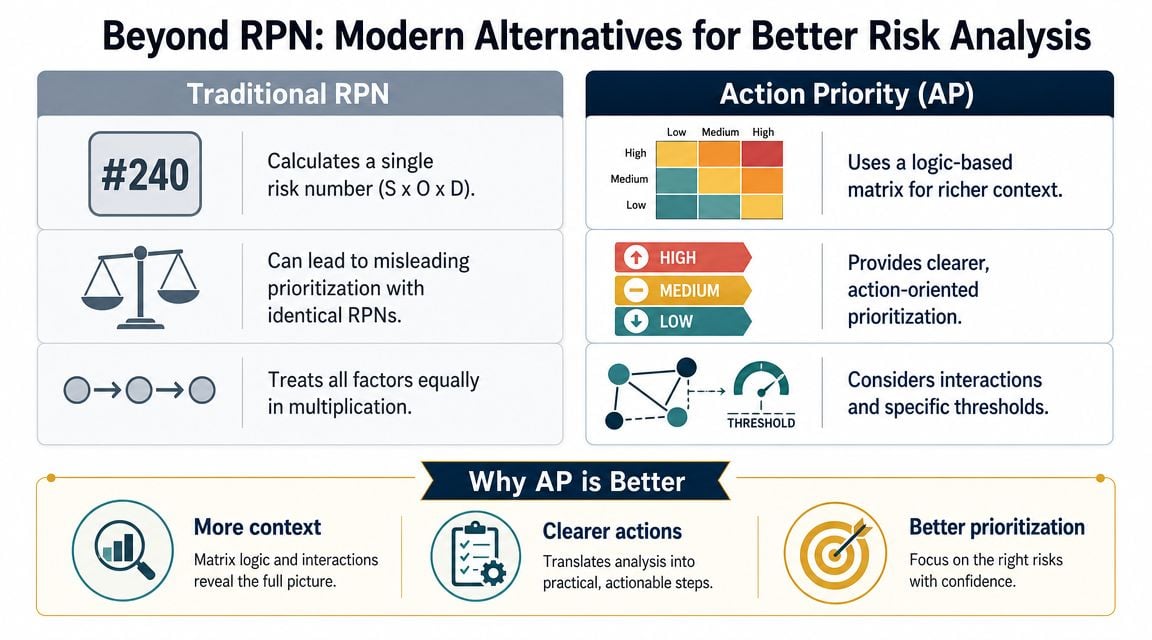
Action Priority (AP) is attractive because it shifts the discussion away from a single multiplied score and toward a logic-based prioritization framework. Instead of asking, “What number did this mode get?” the team asks, “Is this failure mode high, medium, or low priority based on the interaction of consequence, frequency, and control?”
That approach usually works better on critical plant assets. Consider a boiler feed pump with cavitation risk. If the consequence is serious and the current controls are weak, AP tends to surface that issue clearly even when occurrence isn't extreme. Traditional RPN can dilute that signal.
Other plants use simplified alternatives for specific purposes:
- Severity and occurrence only for fast asset-level screening when detection data is poor
- Weighted scoring models when the organization wants consequence to carry more influence than other factors
- Criticality matrices that combine business impact and failure likelihood for capital planning and spare-parts decisions
Teams focused on reducing unplanned downtime often find that logic-based prioritization fits better with condition monitoring programs because it gives more weight to consequence and control quality, not just arithmetic ranking. Sites that are further along may also connect these risk decisions with predictive maintenance and machine learning workflows when they want risk scores to inform monitoring intensity and alarm strategy.
Comparison of Risk Prioritization Metrics
| Metric | Calculation | Key Advantage | Key Disadvantage |
|---|---|---|---|
| RPN | Severity × Occurrence × Detection | Simple to calculate and easy to sort in an FMEA sheet | Different risk profiles can produce the same score |
| Action Priority | Logic-based priority from severity, occurrence, and detection interactions | Better reflects practical urgency, especially for severe failure modes | Requires stronger scoring discipline and team training |
| Criticality Index | Simplified consequence and likelihood approach | Fast for portfolio ranking and asset screening | Can overlook how detection controls change exposure |
A mature reliability program doesn't need to be dogmatic. It can keep RPN for workshop structure, use AP for decision-making on critical modes, and apply a simpler criticality method for site-wide asset ranking. What matters is whether the method drives the right maintenance actions on real equipment.
Operationalizing Risk From Numbers to Actionable Maintenance
A risk score that lives in a worksheet has no value until it changes work. In a strong maintenance system, a high RPN or high action priority rating automatically feeds the CMMS and planning process.
For example, a high-risk cooling tower fan bearing mode should trigger a defined response. That response might include a planning request for root cause failure analysis, a revision to lubrication and alignment tasks, and a route-based vibration or ultrasound requirement. A piston compressor valve failure mode might trigger a PM rewrite, spare-parts review, and structured performance trending with alarm ownership assigned.
The best sites build explicit rules such as:
- High-risk mode creates an engineering action item, not just a note in the FMEA
- Weak detection on critical equipment prompts a condition monitoring review
- Repeat failure modes require feedback from completed work orders into the scoring table
That closes the loop. The team doesn't just score risk. It learns from executed maintenance, updates the ranking, and steadily improves the control strategy around pumps, compressors, fans, motors, and process-critical systems.
Plants that want risk priority numbers to drive real reliability gains usually need more than a workshop template. They need scoring discipline, CMMS integration, and maintenance strategies tied to actual failure modes. Forge Reliability helps industrial teams build that system through condition monitoring, FMEA support, and practical reliability programs. Schedule a free reliability assessment to identify where risk ranking, inspection strategy, and asset data can work together to prevent the next avoidable failure.