A maintenance team usually sees the same pattern before a bad week. A filler line trips twice in three shifts. The local PLC shows a motor overload, then clears. Production restarts, the issue disappears, and nobody has the trend, sequence of events, or upstream process context to explain why it happened. By the third stop, the team is swapping parts instead of solving the failure mode.
That gap is where PLC with SCADA becomes a reliability issue, not just an automation choice. The PLC can protect the machine and keep it running. The SCADA layer gives operations and maintenance the larger story, including alarm context, historian data, remote visibility, and cross-asset comparison. In a plant with mixed-age packaging equipment, pump skids, utilities, and remote support needs, that distinction decides whether the team reacts to faults or prevents them.
Table of Contents
- Why Integrating PLC with SCADA Is Critical for Reliability
- Understanding the Foundational PLC SCADA Architecture
- Choosing the Right Communication Protocols for Data Integrity
- Turning Raw Data into Predictive Insights
- Optimizing Alarms and RTUs for Faster Response
- Securing Your PLC SCADA System from Modern Threats
- Your PLC SCADA Integration Checklist
Why Integrating PLC with SCADA Is Critical for Reliability
A standalone PLC is good at one thing that plants can't compromise on. It makes real-time control decisions close to the asset. That is exactly what it should do. But repeated failures rarely stay inside one machine boundary.
A recurring conveyor jam on a packaging line may start with a drive load spike, but the underlying cause could be product accumulation upstream, low air pressure at a reject station, or an operator bypass that only appears during changeover. Without supervisory context, maintenance teams end up chasing symptoms.
According to GE Vernova's explanation of PLC, HMI, and SCADA roles, a PLC-SCADA architecture is foundational in modern industrial automation because PLCs perform real-time control while SCADA provides supervisory oversight across multiple machines, lines, sites, or geographically distributed assets. The same source notes that SCADA collects data from PLCs, RTUs, and intelligent devices, then stores, visualizes, analyzes, and reports that data centrally. That higher layer is what turns isolated machine faults into usable reliability intelligence.
What changes when SCADA is integrated correctly
The main shift is from event response to event interpretation. A plant no longer sees only a trip. It sees what happened before it, what else moved with it, and whether the pattern is local or systemic.
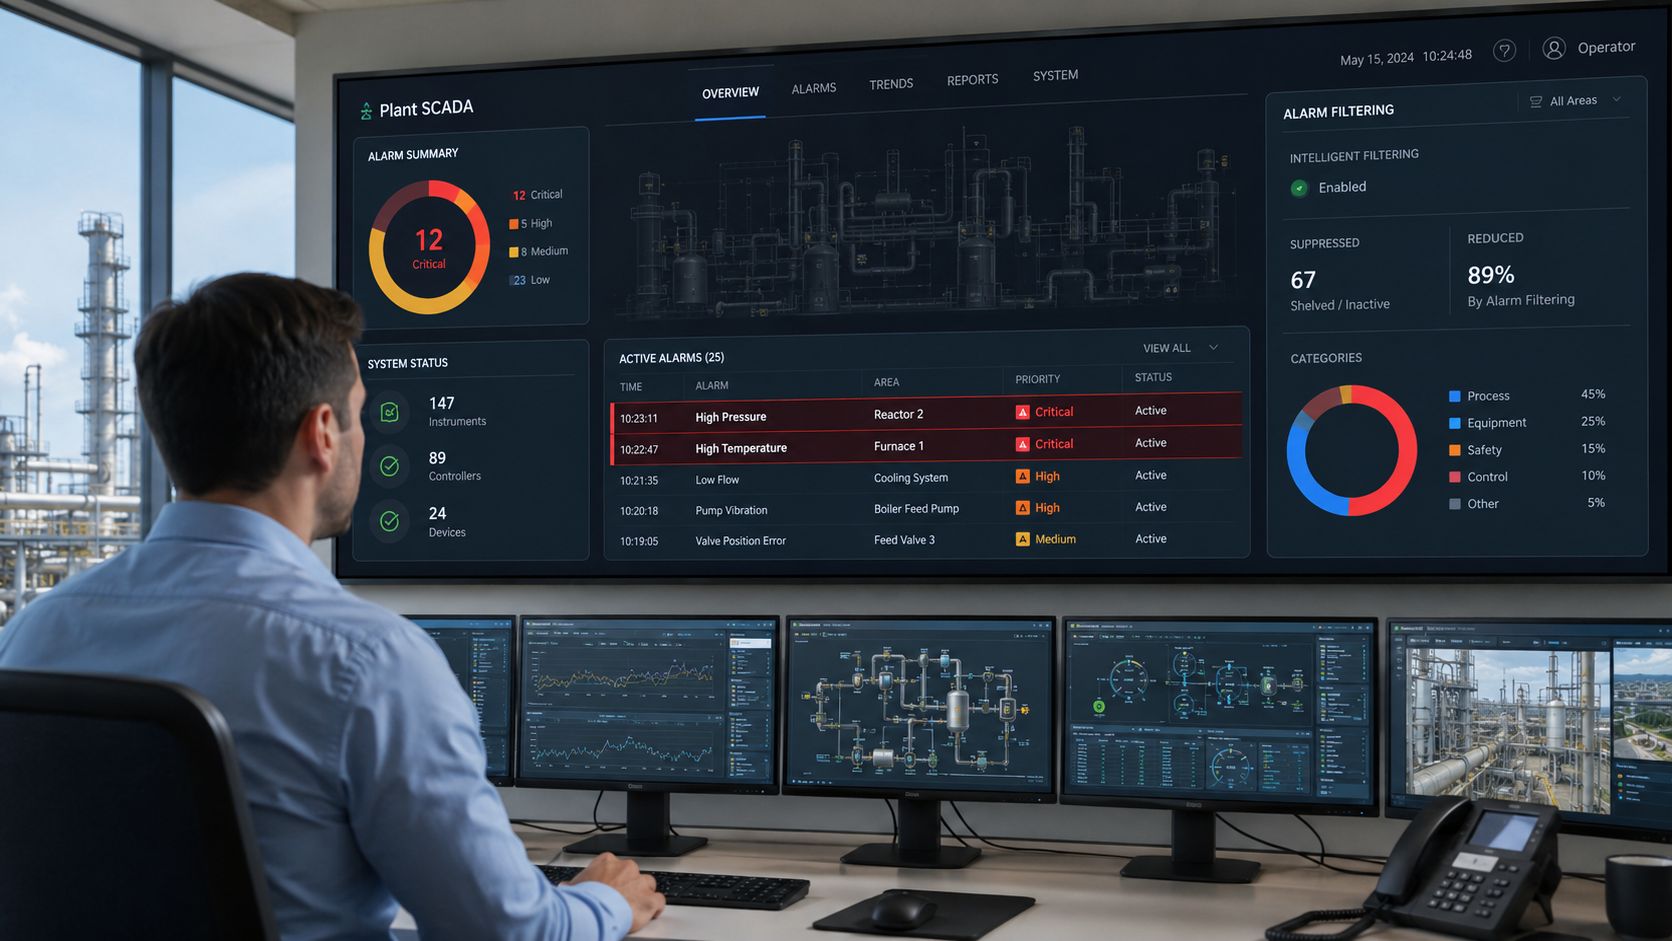
- Centralized alarm context: Operators can distinguish a true process upset from a nuisance alarm tied to startup, washdown, or batch transition.
- Historical trending: Maintenance can compare motor current, valve position, temperature, and permissive states across repeated events.
- Remote visibility: Supervisors and reliability engineers can review conditions without standing at every local panel.
- Cross-line learning: One site's recurring fault can be checked against similar assets elsewhere.
Practical rule: If the team can't reconstruct the ten minutes before a trip, the plant is still operating reactively.
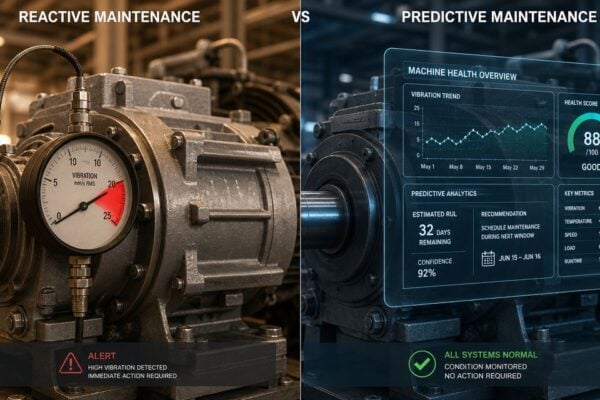
For maintenance leaders trying to decide where to invest first, the better question isn't predictive versus preventive in the abstract. It's which failure modes already generate enough process and condition data to support action. This is why many teams pair controls upgrades with a broader maintenance strategy such as predictive vs preventive maintenance planning.
Integration also creates an organizational dependency. The controls design may be solid, but weak support between OT and IT still causes outages, blind spots, and delayed recovery. Plants that are reviewing network ownership, escalation paths, and remote support often benefit from guidance on choosing an IT partner for manufacturers, especially when the SCADA layer has to serve both operations continuity and business reporting.
Understanding the Foundational PLC SCADA Architecture
The cleanest way to think about a PLC with SCADA system is as a layered control stack. The PLC is the skilled musician. It plays its part with precise timing. SCADA is the conductor. It doesn't generate torque, open valves, or stop a pump directly for hard protection. It coordinates visibility, interpretation, and supervision across the whole performance.
Historically, SCADA became the layer that made remote monitoring and data acquisition practical at industrial scale. Cedalo notes in its SCADA system guide that modern SCADA systems are commonly deployed as monolithic, distributed, networked, and increasingly IoT- or cloud-based systems. That evolution matters because today's plants rarely operate as isolated machines. They operate as connected production systems with historians, remote assets, and enterprise reporting needs.
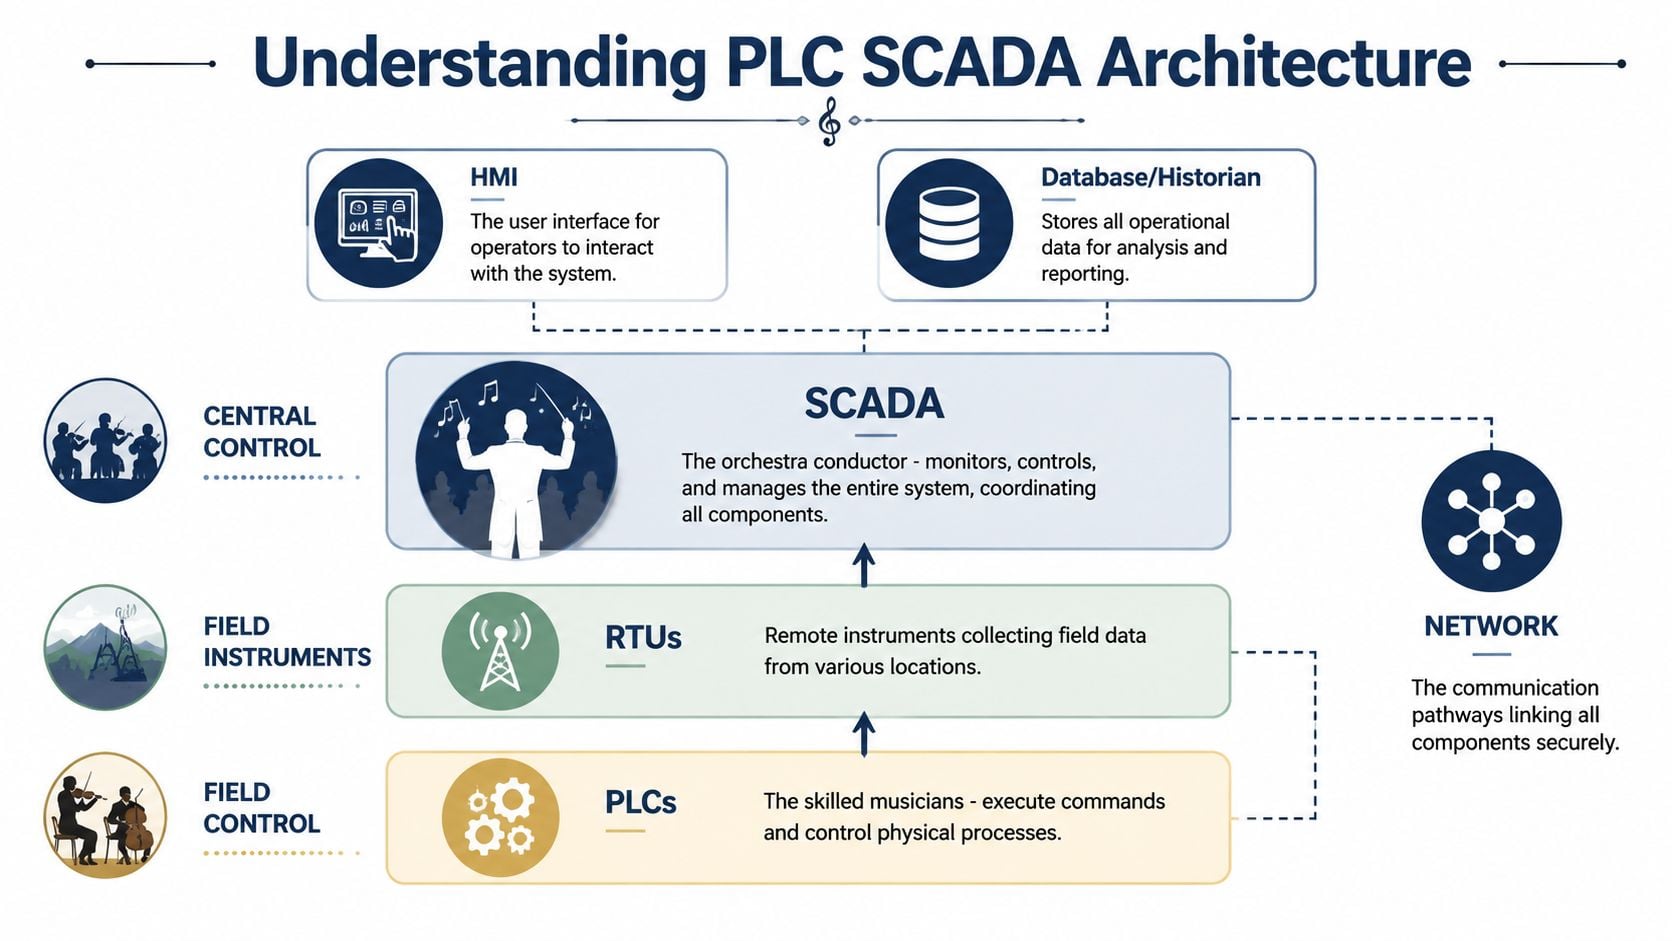
The layers that matter on the plant floor
At the bottom are field devices. These include sensors, transmitters, switches, actuators, drives, and control valves. Reliability starts here because bad inputs create false confidence. A drifting pressure transmitter or fouled level sensor can make a healthy control loop look unstable.
Above that sits the control layer, usually PLCs and sometimes RTUs for remote assets. These devices run logic, interlocks, sequencing, permissives, and immediate control actions. In a water booster station, this layer handles pump lead-lag logic, low suction shutdowns, and local hand-off-auto behavior.
The next layer is the communications network. This is the pathway between field controllers and supervisory systems. Plants often underestimate how much reliability depends on network quality. Intermittent communication loss can look like instrumentation failure, HMI lag, or historian gaps when the actual problem is topology, unmanaged traffic, or poor segmentation.
Then comes the supervisory layer. That includes SCADA servers, HMIs, alarm management, and the historian. From this layer, operations sees plant status and maintenance sees time-based evidence. For teams building route-based inspections and automated alerts together, this supervisory layer becomes more useful when it's aligned with a broader condition monitoring program.
How architecture choices affect maintenance
A simple architecture is easier to troubleshoot. A richer architecture is easier to optimize. Plants have to choose where complexity pays back.
A monolithic setup may work for a small facility, but distributed or networked architectures usually age better when sites add skids, utilities, remote panels, and reporting needs. The trade-off is that every added layer introduces more interfaces to validate, secure, and document.
A reliable architecture doesn't just move data. It preserves context when a device fails, a comms path drops, or an operator needs to decide whether to restart.
A chemical batching area shows this clearly. Local PLCs can keep reactors, transfer pumps, and valve manifolds sequenced safely. SCADA ties those units together so operators can see batch status, utility conditions, and recurring deviations across the area. Without that higher-level view, each skid may look healthy while the process as a whole keeps generating off-spec product and nuisance downtime.
Choosing the Right Communication Protocols for Data Integrity
Protocol selection is one of the most underestimated reliability decisions in industrial automation. Many plants inherit it instead of designing it. Years later, maintenance teams are still dealing with dropped values, bad timestamps, unreadable tag structures, or gateways that nobody wants to touch during a shutdown.
A protocol isn't just a language. It shapes how faults appear, how easy they are to isolate, and how much diagnostic detail survives from field device to operator screen.
Protocol choice changes failure behavior
Modbus is still common because it's simple, familiar, and durable in legacy environments. It works well when a plant needs straightforward register-based communication from utility meters, analyzers, remote I/O, or older packaged equipment. Its weakness is context. Raw registers are easy to move and easy to misinterpret if mapping isn't tightly documented.
Ethernet-based industrial protocols are common in factory automation where scan speed and tight integration matter. They fit well on packaging lines, material handling systems, and high-speed machine cells. The reliability benefit is responsiveness and broad device interoperability within the automation domain. The risk is that plants sometimes treat high performance as a reason to collapse traffic onto flat networks, which creates troubleshooting and security problems later.
OPC UA is a stronger fit when plants need platform-independent integration, richer data models, and better security features at the supervisory layer. It helps when a site wants structured data for historians, analytics, and enterprise visibility without turning every tag into a custom mapping exercise. The trade-off is implementation discipline. A poorly planned data model or certificate process can delay startup just as badly as any gateway issue.
A practical comparison for reliability teams
| Protocol | Best For | Key Advantage | Reliability Consideration |
|---|---|---|---|
| Modbus | Legacy assets, simple instruments, utility systems | Straightforward setup and troubleshooting | Weak context if register maps and scaling aren't controlled |
| Ethernet-based industrial protocols | High-speed machine control and factory automation | Fast updates and strong controller-level integration | Poor segmentation can turn traffic issues into plant-wide visibility problems |
| OPC UA | SCADA integration, historian quality, cross-system data sharing | Rich data structure and built-in security capabilities | Needs disciplined namespace, access control, and validation during commissioning |
Food processing example
A food processing site often has mixed requirements in one building. A packaging hall needs fast controller communications for conveyors, fillers, labelers, and reject systems. The boiler room and refrigeration plant may still expose simpler data points from legacy instruments. Plant leadership also wants one supervisory view for downtime review, sanitation verification, and utility use.
That is where coexistence makes sense.
- Use simpler polling for legacy utility skids when the data set is stable and well documented.
- Keep machine-level control traffic local where determinism and quick fault response matter most.
- Use a structured supervisory interface for historian collection, alarm context, and reporting across departments.
A common mistake is forcing every asset onto one protocol strategy because it looks standardized on paper. In practice, standardization should happen around naming, security boundaries, diagnostic methods, and maintenance ownership, not around a single transport choice at all costs.
The wrong protocol rarely fails all at once. It usually fails as ambiguity. Missing status bits, stale values, and tags that nobody trusts.
Protocol selection also affects work order quality and maintenance follow-through. If SCADA alarms don't map cleanly to asset IDs and fault descriptions, technicians receive vague notifications and planners lose failure history. Teams trying to tighten that loop often need both controls data and work management aligned, which is why protocol decisions should be considered alongside CMMS implementation and asset data structure.
Turning Raw Data into Predictive Insights
Plants don't struggle because they lack data. They struggle because the data arrives without structure, timing discipline, or asset meaning. A historian full of generic tags doesn't help a reliability team diagnose a recurring pump cavitation event or a compressor surge condition.
Useful insight starts with data that a technician can understand at speed.
Tagging discipline comes first
Every tag should answer three questions immediately. What asset is this. What variable is being measured. What does the value represent. A naming format such as AssetID_Parameter_Unit is simple enough to enforce and detailed enough to use during troubleshooting.
In a wastewater lift station, a tag named LS01_PumpA_RunStatus is actionable. A tag named DI_014 is not. During an upset, maintenance can't afford to cross-reference every point through old panel drawings and spreadsheets.
Strong tag discipline should include:
- Asset identity: Match the plant's asset hierarchy, not the programmer's temporary naming.
- Signal meaning: Use names like suction pressure, bearing temperature, or VFD speed feedback instead of internal shorthand.
- State consistency: Keep alarm, command, feedback, and status naming patterns uniform across lines and sites.
- Engineering context: Include units or clear scaling conventions so trend interpretation is immediate.
That naming work directly supports advanced analytics later. Teams that want to build early warning logic around process drift or operating state classification need clean source data first. Otherwise, the model learns noise. This is why data governance should come before projects tied to predictive maintenance and machine learning.
Historian strategy should match failure modes
A data historian is a time-series repository built for industrial signals. It isn't just long-term storage. It is the replay system that lets teams inspect what changed, in what order, and under what operating conditions.
Historian configuration should be selective. Not every point needs the same collection rate or retention emphasis.
A sensible approach looks like this:
- Capture fast-changing critical variables at higher resolution around trips, starts, stops, and permissive changes.
- Trend slower process variables at lower frequency for fouling, wear, drift, and seasonal comparison.
- Store event markers with process values so operators can correlate a fault with mode changes, operator action, or batch transitions.
- Separate diagnostic tags from display-only tags to keep the dataset useful and maintainable.
A centrifugal pump example shows why this matters. If the historian only stores averaged current and discharge pressure, the plant may miss the short suction collapse that precedes cavitation damage. If the historian captures state transitions, local pressure changes, and valve position around the event window, the team can see whether the root cause was low tank level, control valve hunting, or an upstream process interruption.
Raw data becomes reliability data only after the plant defines naming, timing, and ownership.
The best plants also review historian blind spots during every repeat failure investigation. If a critical event occurs and the team still can't reconstruct it, that isn't bad luck. It's a design defect in the information layer.
Optimizing Alarms and RTUs for Faster Response
Most plants don't have too few alarms. They have too many bad ones. The result is predictable. Operators acknowledge floods, technicians stop trusting notifications, and actual abnormal conditions hide inside routine noise.
A better PLC with SCADA design separates protective action from supervisory awareness. That split is essential for reliability.
Protective trips belong in the PLC
Wevolver's discussion of PLC and SCADA roles makes the division clear. The PLC should be treated as the deterministic control layer, executing machine logic close to the asset, while SCADA sits above it to aggregate data and support supervisory decisions. The same source notes that fault response time for protective actions should remain in the PLC, while analytics, reporting, remote visibility, and cross-asset correlation belong in SCADA. If those protective functions are pushed upward, response slows and local protection weakens.
That principle fixes many alarm problems before alarm rationalization even starts. The PLC should own shutdown logic, permissives, and hard interlocks. SCADA should own context, prioritization, suppression during known operating states, and operator-facing escalation.
A practical alarm strategy includes:
- Priority by consequence: Reserve the highest priority for conditions that require immediate operator action or indicate loss of protection.
- State-based alarming: Suppress or reclassify alarms during maintenance mode, startup, cleaning cycles, or known shutdown conditions.
- Rate-of-change and deviation alarms: Use SCADA to detect abnormal trends that don't justify a hard trip but do warrant intervention.
- Alarm shelving rules: Allow controlled temporary shelving, but require review so nuisance alarms don't become permanent blind spots.
A compressed air system illustrates the point. The PLC should trip a compressor on hard safety conditions. SCADA can warn on rising load/unload cycling, abnormal pressure decay, or leak-related runtime patterns. Pairing those alerts with field checks such as ultrasonic leak detection makes alarm data far more actionable.
RTUs extend visibility across distributed assets
RTUs, or Remote Terminal Units, fill a different role from PLCs in many distributed systems. They are commonly used where assets are spread out and need centralized supervision, such as pipelines, remote wells, tank farms, lift stations, or isolated utility sites.
In an oil and gas pipeline example, RTUs can collect pressure, flow, valve position, and status data from remote block valves or pump stations and feed that information back to the central SCADA system. That lets operations identify communication loss, pressure imbalance, or repeated remote device faults without sending technicians blind into the field.
The fastest response doesn't come from more alarms. It comes from fewer alarms with better context.
When RTUs are added without a clear alarm philosophy, they often multiply nuisance notifications across wide-area systems. The better approach is to alarm on conditions that change operator decisions, then use historian and event context to support maintenance diagnosis.
Securing Your PLC SCADA System from Modern Threats
The biggest integration mistake in industrial environments isn't usually logic quality. It's exposing a control environment to avoidable network and lifecycle risk. Once a plant connects OT systems to business networks for dashboards, historians, remote support, or enterprise analytics, cybersecurity becomes part of reliability engineering.
That doesn't mean turning the controls team into a security department. It means designing the PLC with SCADA environment so a network event doesn't become a production event.
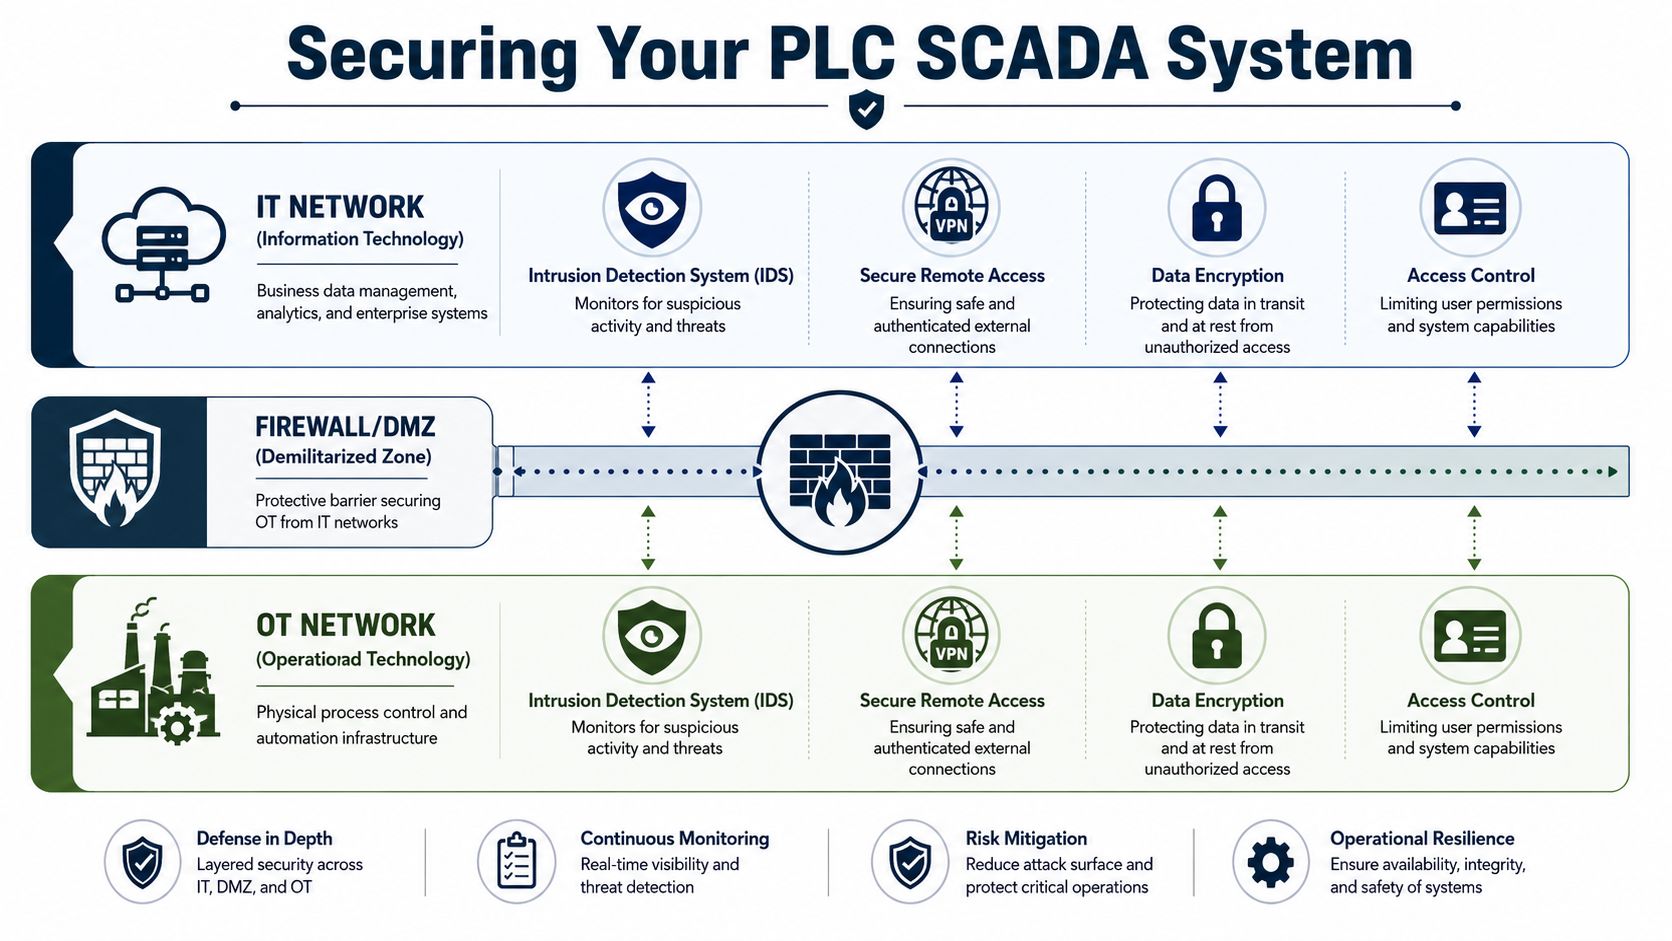
Segmentation is a reliability control
A practical way to organize this is with the Purdue Model, which separates industrial control layers from business systems. The exact implementation varies, but the operating principle is straightforward. Critical controllers and supervisory systems shouldn't sit on the same flat network as ordinary office traffic.
A plant usually needs:
- Defined OT zones: Separate controller networks, supervisory systems, and plant-level services based on function and criticality.
- A DMZ or buffer layer: Create a controlled exchange point for historian replication, remote access services, and limited data sharing.
- Firewalled boundaries: Restrict which systems can talk across levels and under what rules.
- Secure remote access: Use authenticated remote connections rather than ad hoc direct paths into the control environment.
- Patch and firmware governance: Test updates against compatibility and outage risk before deployment.
Plants that are strengthening these controls often look for broader guidance on protecting your digital infrastructure because the operational challenge isn't only blocking threats. It's preserving safe supportability for maintenance, engineering, and operations.
Where integration projects usually fail
The hard part of modernization is rarely the architecture sketch. It's commissioning and lifecycle reality. According to industry guidance on common SCADA integration challenges, the overlooked issues often include commissioning risks, firmware and protocol conflicts, phased cutovers, native UA or gateway needs, and monitoring boundaries with SIEM and SOC workflows. The same guidance stresses that integration failures often come from topology, staffing, and validation issues rather than the control logic itself.
That matches what reliability teams see on site. A legacy PLC may communicate during a bench test and still fail during production because the live network behaves differently. A gateway may pass values but strip useful diagnostic context. A remote-access method may work for support but bypass change control and leave no audit trail.
Plants reduce those risks when they:
- Validate communications with production-like loads, not only during isolated startup tests.
- Stage cutovers by asset criticality, so a network issue doesn't blind the whole area at once.
- Document firmware, protocol, and mapping dependencies before changing HMIs, historians, or controllers.
- Assign clear ownership for OT support, cybersecurity review, and post-change verification.
A secure control network is easier to troubleshoot because the data paths, user paths, and failure boundaries are intentional.
Your PLC SCADA Integration Checklist
A good integration doesn't start with screens. It starts with asset criticality, failure modes, and operating boundaries. Plants get better results when they treat PLC with SCADA as a reliability system, a controls system, and a cybersecurity system at the same time.
The checklist below works as both a project guide and an audit tool.
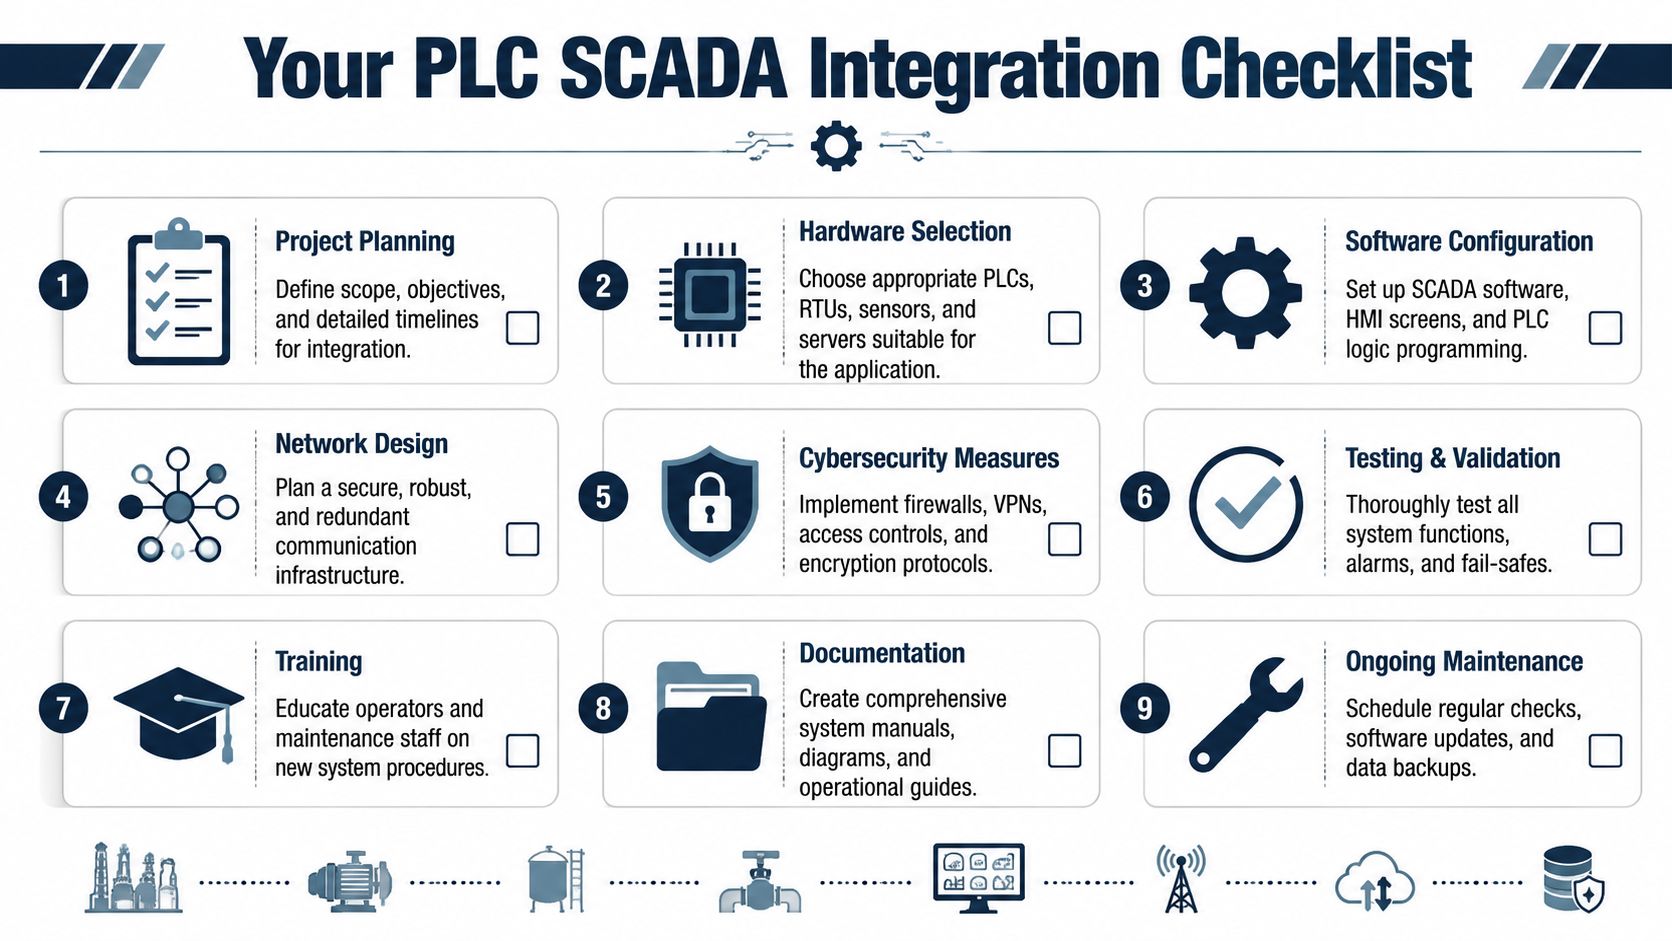
Integration checks that prevent repeat failures
- Rank critical assets first: Start with lines, utilities, and process units where data loss or poor alarm design creates the highest downtime risk.
- Define controller versus supervisory roles: Keep interlocks, trips, and permissives local. Put trends, dashboards, and cross-asset analytics in SCADA.
- Choose protocols by use case: Match each communication path to the required speed, context, maintainability, and legacy constraints.
- Standardize tags before expansion: Clean naming saves time on every alarm review, historian query, and root cause analysis.
- Design network boundaries early: Segmentation shouldn't be bolted on after commissioning.
- Tune historian collection deliberately: Log critical event windows with enough resolution to reconstruct the sequence of failure.
- Rationalize alarms: Remove duplicates, suppress state-based noise, and make priorities reflect operator action.
- Test failover and communication loss: Verify what operators see when links drop, devices stale out, or servers switch over.
- Train and document: The system isn't reliable if only one programmer understands the mappings and recovery steps.
Common failure modes and quick checks
| Failure mode | Quick troubleshooting tip |
|---|---|
| Communication timeouts | Check whether the issue is path-specific, device-specific, or load-related before replacing hardware |
| Data mismatch between PLC and SCADA | Verify scaling, tag mapping, update timing, and engineering units first |
| Alarm floods during startup | Review state-based suppression and startup permissives before changing trip points |
| Historian gaps | Check buffering, timestamp handling, and network interruption behavior |
| Remote visibility loss with local machine still running | Confirm the PLC is healthy, then inspect the supervisory network path and server services |
A plant that gets these basics right doesn't just gain better screens. It gains faster troubleshooting, cleaner failure history, and safer modernization. Teams that want an outside review of architecture, alarm strategy, historian design, or OT reliability risk should consider a no-cost assessment before the next outage forces the issue.
Forge Reliability helps industrial teams build practical reliability programs around condition monitoring, predictive maintenance, root cause analysis, and asset strategy. If a plant is planning a PLC with SCADA upgrade, struggling with repeat faults, or trying to reduce blind spots in alarm and historian data, request a free reliability assessment to identify the highest-risk gaps before they become downtime.