A plant can have a vibration program on paper and still miss a failure in the field.
That usually happens the same way. A critical pump, fan, compressor, or gearbox gets measured on schedule. Overall readings look acceptable, or at least not urgent. Then the machine comes apart between routes, and the review after the fact shows the program had data but not diagnostic data. The wrong sensor was used, the mounting point filtered out the signal, the cable added noise, or the acquisition settings buried the fault.
That's why vibration analysis sensors deserve more attention than they usually get. The sensor isn't just a purchase. It defines what the team can and can't see. A program that collects convenient data will often confirm obvious faults late. A program that collects the right data can catch bearing wear, imbalance, looseness, gear issues, and shaft motion early enough to plan work instead of reacting to it.
The discipline itself has been evolving for a long time. Vibration sensing in condition monitoring traces back to the early 20th century, with electrodynamic velocity sensors developed in the 1930s and the AVM-1 introduced around 1982 using an acceleration sensor with computer-based trend analysis, as described in this history of vibration measurement in predictive maintenance. Modern plants now have far more capable hardware and analytics, but the old problem remains the same. Bad inputs produce bad conclusions.
Plants trying to move from task-based maintenance to condition-based decisions often benefit from clarifying the difference between predictive vs preventive maintenance. The same logic applies outside rotating equipment too. Facilities that want to prevent door and dock failures use condition indicators to act before a breakdown, not after one.
Table of Contents
- The Foundation of Predictive Maintenance
- Matching the Sensor to the Failure Mode
- Sensor Specification and Mounting Best Practices
- Cabling and Signal Conditioning for Data Integrity
- Acquiring and Validating Quality Vibration Data
- Practical Deployment Tips and Checklists
- Turn Your Data Into Downtime Avoidance
The Foundation of Predictive Maintenance
A pump trips on high vibration during the night shift. The route sheet shows acceptable overall readings from the past two months, yet the inboard bearing is already damaged when the crew opens the housing. That failure usually starts long before the alarm. The gap is not data volume. The gap is measurement strategy.
Many plants collect vibration on schedule and still miss the defect that mattered. I see it most often on pumps, belt-driven fans, and small gearboxes where technicians grab the easiest point on the motor frame, log an overall value, and move on. That method can catch late-stage imbalance or severe looseness. It often misses the earlier high-frequency activity from bearing damage, cavitation, or a developing gear problem because the sensor location and measurement type were chosen for convenience rather than fault visibility.
Predictive maintenance starts with one practical question. What failure are you trying to catch early enough to plan the work?
That question separates a calendar-based task list from a condition-based program. Teams comparing predictive vs preventive maintenance strategies usually focus on scheduling logic. In the field, the bigger difference is whether the measurement chain can see the defect before production feels it.
What changed in modern programs
Modern vibration programs improved when plants stopped treating vibration as a single overall number and started treating it as a fault-specific signal. Analysts examine time waveform, frequency content, and trend behavior to sort problems that may look similar from a distance but develop very differently in a machine. Unbalance, bearing wear, looseness, and shaft-related issues leave different patterns if the sensor, mounting method, and location preserve those patterns.
That matters on mixed assets. A sleeve-bearing turbine train does not need the same approach as a direct-drive pump or a slow-speed cooling tower fan. Good programs define the machine class, the likely failure mode, the point of measurement, and the action that follows if the reading changes. Without that discipline, teams end up with dashboards full of values that do not change lubrication plans, alignment checks, inspection scope, or shutdown timing.
Practical rule: A vibration program becomes predictive when it detects a defect while the repair can still be planned, parts can still be staged, and secondary damage is still avoidable.
The actual starting point
The foundation of predictive maintenance is sensor strategy tied to machine physics and failure behavior.
For a plant with mixed assets, that usually means answering four questions before setting routes or buying hardware:
- Which fault needs early warning: Bearing wear, imbalance, misalignment, looseness, gear mesh damage, and shaft instability do not show up the same way.
- Where will that fault appear first: The best point is usually near the bearing load zone or structural path carrying the force, not the point that is safest to reach with a handheld probe.
- Which motion matters: Some faults are clearer in acceleration, some in velocity, and some in shaft displacement.
- What confirms the finding: A vibration change should lead to a specific follow-up such as lubrication inspection, alignment verification, process review, or planned teardown.
This applies outside heavy rotating equipment too. Facilities that use condition monitoring to prevent door and dock failures follow the same logic. The useful signal is the one that matches the failure and leads to action before the asset becomes a safety or production problem.
Plants that answer these questions well get trends that support real maintenance decisions. Plants that skip them usually get plenty of readings and very little warning.
Matching the Sensor to the Failure Mode
Sensor selection should start with the fault, not with the machine category alone. A motor, pump, fan, and gearbox can all use vibration analysis sensors, but the right sensor depends on what the team is trying to find first and how that fault behaves across frequency.

For rotating equipment, accelerometers are the dominant sensor type because they capture broad-frequency vibration data. Analysis commonly uses FFT-based decomposition to separate acceleration, velocity, and displacement views for different fault classes. Acceleration emphasizes high-frequency bearing defects, velocity is often the primary severity metric, and displacement is most useful for low-frequency balancing and orbit problems, as explained in this guide to vibration analysis for rotating equipment.
Three sensor families and what they actually reveal
The practical decision usually comes down to accelerometers, velocity sensors, and proximity probes.
| Sensor Type | Measures | Best For (Frequency) | Primary Use Cases & Faults Detected | Limitations |
|---|---|---|---|---|
| Accelerometer | Acceleration | Broad frequency range, especially higher-frequency content | Rolling element bearing defects, gear mesh activity, impacting, early-stage mechanical damage, general rotating equipment diagnostics | Can be misapplied if teams only view overall values and ignore spectral content |
| Velocity sensor | Velocity | Mid-frequency machine behavior and severity assessment | General machine health, imbalance, misalignment, looseness, route-based screening on common rotating assets | Less effective for very early high-frequency bearing fault detection |
| Proximity probe | Shaft displacement relative to bearing | Low-frequency shaft motion and orbit behavior | Sleeve-bearing turbines, large compressors, shaft rub, instability, orbit analysis, balancing-related shaft movement | Not the right primary sensor for many rolling element bearing machines |
That table is a starting point, not a substitute for machine knowledge.
A plant with repeated bearing failures on belt-driven motors should usually lean toward accelerometers mounted correctly on bearing housings. A site focused on broad route screening for common pumps and fans may still rely on velocity as the main severity view. A turbine or large compressor with sleeve bearings needs shaft-relative information that a casing-mounted accelerometer cannot fully replace.
Teams troubleshooting bearing defects can go deeper with this bearing fault detection resource.
If the fault lives in the high-frequency band and the measurement chain cuts off that band, the program will report stability while the bearing continues to degrade.
A gas turbine example
A gas turbine train in power generation shows why mixed sensing is often necessary.
On the accessory gearbox and rolling element bearing locations, the program should prioritize accelerometers because the team needs broad-frequency coverage for bearing and gear-related content. On the turbine or compressor sections supported by sleeve bearings, proximity probes become essential because shaft displacement and orbit behavior matter more than casing motion alone. Velocity remains useful as a severity lens for overall machine condition and trending.
That combination prevents a common mistake. Some teams try to standardize on one sensor type across the entire train because it simplifies inventory. The data becomes simpler, but the diagnosis gets worse.
A fault-to-sensor framework
When selecting vibration analysis sensors, this sequence usually works:
List the likely failure modes by asset
A centrifugal pump in a chemical unit may face bearing wear, hydraulic instability, misalignment, and looseness. A gearbox in a paper machine may face gear mesh wear, bearing defects, and structural resonance.Match the dominant fault energy to a signal type
High-frequency defect energy points toward acceleration. General machine severity often belongs in velocity. Shaft-relative movement points toward displacement from proximity probes.Check the machine support design
Rolling element bearing machines usually favor casing-mounted accelerometers. Sleeve-bearing machines often need shaft probes to avoid missing instability or rub-related behavior.Confirm the diagnostic question
“Is the machine bad?” and “What is failing?” are different questions. The first can sometimes be answered with simpler screening. The second usually needs a better sensor strategy and higher-quality spectra.
The best programs don't chase universality. They build repeatable rules for each machine class and failure mechanism.
Sensor Specification and Mounting Best Practices
Choosing the right sensor family is only the first half of the job. The second half is specifying a sensor that fits the machine and installing it in a way that preserves the signal. Many vibration programs often experience compromised accuracy at this stage.
A common pitfall in vibration analysis is poor data quality from inadequate mounting or incomplete measurements, which can make the analysis unreliable even when the software is advanced. A practical workflow starts with selecting the correct sensor and mounting location so the data is trustworthy, as noted in this practical workflow for vibration analysis.
Plants building or correcting field installations can also review broader vibration monitoring practices.
What to specify before purchasing
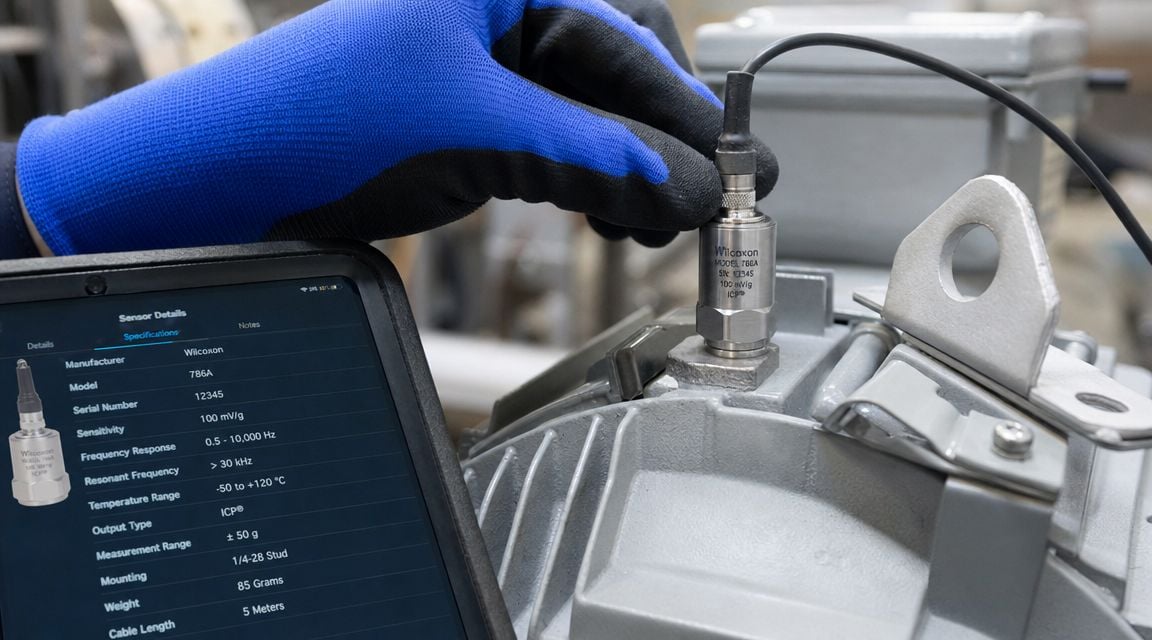
A purchase order for vibration analysis sensors should describe more than sensor type.
The team should define the expected fault range, environmental exposure, connector style, cable exit orientation, and mounting method before it buys anything. Sensitivity and dynamic range matter because the signal has to be strong enough for the analyzer without saturating in rough service. Frequency response matters because a sensor that doesn't cover the fault band won't solve the problem no matter how well it's mounted.
For a chemical processing pump, useful specification questions include:
- What fault needs early visibility: If bearing damage is the concern, the sensor needs suitable high-frequency response.
- Where will it mount: Bearing housing, pedestal, casing, or another rigid location.
- What environment will it face: Washdown, chemicals, heat, or cable abuse change connector and housing choices.
- How will data be collected: Permanent wiring and route-based measurements place different demands on connectors and repeatability.
Mounting choices that change the spectrum
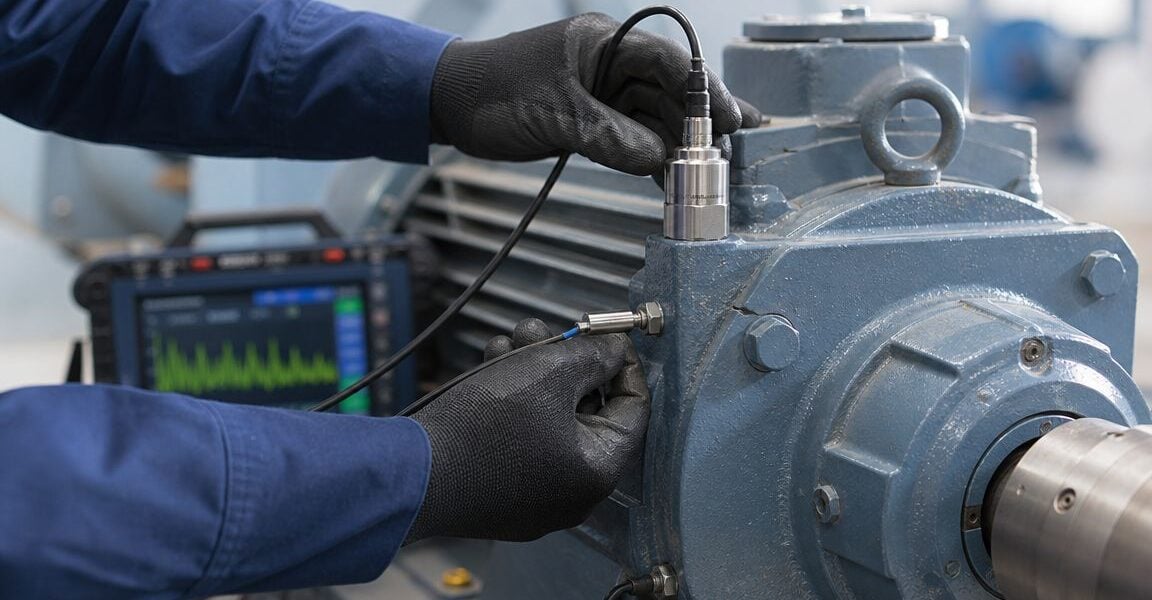
Mounting method isn't a detail. It changes what the sensor sees.
A rigid stud-mounted accelerometer on a clean, flat bearing housing will usually give the most faithful transmission of vibration into the sensor. Adhesive mounting can work when drilling isn't practical, provided the surface is properly prepared and the adhesive layer is controlled. Magnetic bases are convenient and common in route work, but they can reduce fidelity, especially at higher frequencies. Handheld probes are fast for screening and poor for precision.
That matters most when a plant is trying to catch early bearing defects. A magnetic base on a painted motor fin may still show running speed and gross machine motion. It may blunt or distort the very high-frequency content the analyst needs.
Field note: If the plant can only collect one point on a machine, that point should be rigid, repeatable, and close to the bearing load zone.
A pump example from chemical processing
Consider a process pump with repeated outboard bearing replacements. If the technician places a magnetic sensor on the motor fan cover because it's easy to reach, the spectrum may show a clean running-speed peak and little else. If the same machine is measured with a properly mounted accelerometer on the pump bearing housing, the data may reveal higher-frequency activity that better supports a bearing diagnosis.
The machine didn't change. The mechanical path between the fault and the sensor changed.
A good installation standard usually includes these practices:
- Prepare the surface: Remove paint, rust, scale, and burrs so the sensor contacts solid metal.
- Mount near the bearing: Distance and structural joints weaken fault transmission.
- Keep orientation consistent: Trend quality drops when each route uses a slightly different position or angle.
- Avoid weak structures: Guards, thin covers, and cooling fins often add their own response.
- Document every point: Point photos, sketches, and mount details keep route data repeatable across technicians and shifts.
Plants often spend heavily on software and dashboards, then accept casual mounting methods in the field. That's backwards. Data quality starts at the metal.
Cabling and Signal Conditioning for Data Integrity
A clean measurement can still be corrupted before it reaches the analyzer. That happens in cable trays, junction boxes, flexible conduit, and quick-connect points more often than many teams expect.
Why clean signals get lost in the field
The most common field issue is noise introduced by cable routing and cable damage. Variable frequency drives, large motors, power conductors, and poorly grounded enclosures can all contaminate a low-level vibration signal. If the cable is routed alongside electrical noise sources or allowed to flex repeatedly near the sensor head, the reading can drift, smear, or produce a spectrum that looks like a machine problem but isn't one.
A food and beverage facility illustrates the point well. Conveyor motors near washdown areas often have sensor cables exposed to frequent handling, moisture, and cleaning. A damaged cable jacket or stressed connector can create a sloping noise floor in the spectrum. Teams sometimes chase that as bearing roughness when the machine is mechanically sound.
Good cable practice is simple and often ignored:
- Use shielded cable suited to industrial vibration service: The cable should survive movement, moisture, and cleaning conditions.
- Separate signal and power routes: Don't parallel low-level sensor wiring with motor power any longer than necessary.
- Secure the cable close to the sensor: Movement at the connector increases wear and intermittent signal problems.
- Protect washdown and high-traffic areas: Strain relief, conduit, and protected routing matter more than neat appearance.
IEPE and field troubleshooting
Many industrial accelerometers use IEPE, which stands for integrated electronics piezoelectric. In practical terms, that means the sensor contains internal electronics and needs a data collector or interface that supplies constant current excitation. If the analyzer doesn't provide the correct excitation, the signal won't be reliable.
That requirement sounds technical, but the field implication is straightforward. The sensor, cable, and analyzer have to be treated as one measurement chain. A healthy sensor on the wrong input can produce a bad diagnosis just as easily as a damaged cable can.
A troubleshooting sequence for suspect signal quality usually works better than jumping to conclusions:
- Swap the cable first if the pattern looks unstable or changes with handling.
- Check connector condition for moisture, corrosion, or looseness.
- Review cable routing near drives, motor leads, and switching devices.
- Verify the input type supports the installed sensor technology.
- Repeat the measurement at the same point before ordering parts.
Plants standardizing this process across route and permanent systems often reduce false calls. For teams evaluating the full measurement chain, this condition monitoring equipment overview helps connect sensor hardware, collection methods, and analysis workflow.
A noisy signal doesn't just reduce confidence. It often sends the team toward the wrong corrective action.
Acquiring and Validating Quality Vibration Data
A route can fail before analysis even starts. The sensor may be correct, the cable may be intact, and the machine may still get misdiagnosed because the data was collected with the wrong frequency span, too little resolution, or no control over operating state.
That problem shows up all the time on mixed fleets. A fan route set up for imbalance may miss bearing defect activity. A gearbox route built around high-frequency content may bury slow-speed looseness in a spectrum with poor low-end detail. Good acquisition settings have to match the failure mode the sensor was chosen to detect.
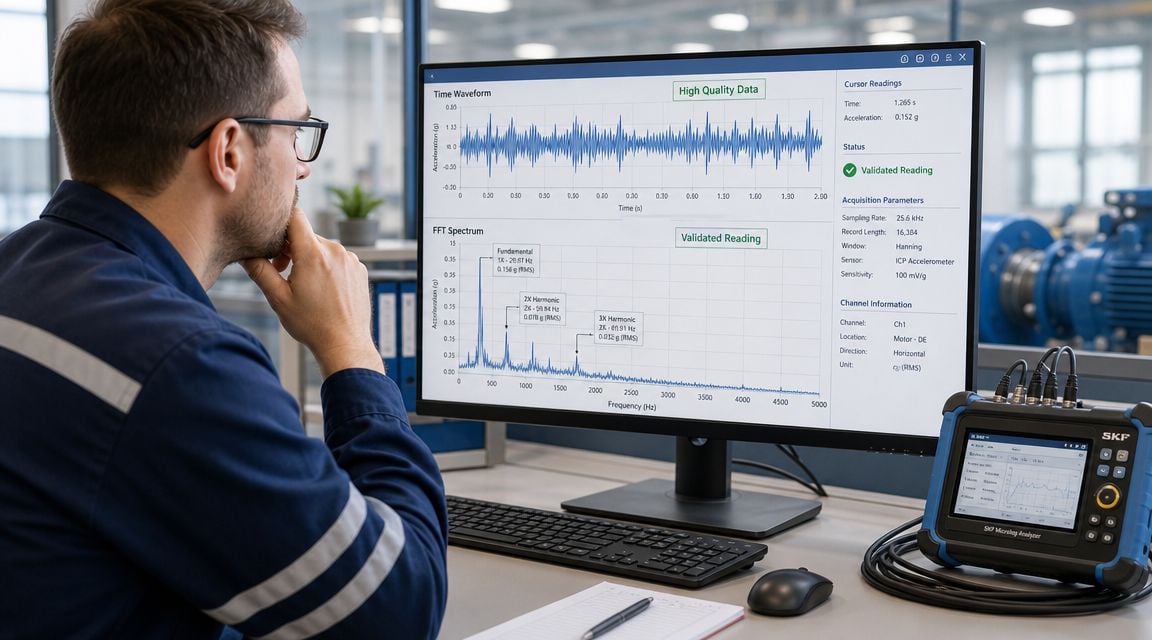
Time waveform and FFT data both matter here. The waveform helps confirm impacts, modulation, clipping, and instability. The spectrum helps separate running speed, harmonics, bearing-related energy, vane pass, blade pass, and gear mesh families so the analyst can decide whether the machine has a balance problem, a developing rolling element fault, or process-driven vibration.
Plants that want repeatable collection across routes should document those settings point by point in a standard vibration monitoring route setup guide.
Acquisition settings that shape diagnosis
Fmax sets the highest displayed frequency. Choose it from the fault you are trying to catch. Running-speed problems such as imbalance, soft foot, and many misalignment cases need clear low-frequency detail. Bearing and gear problems often need a much wider span. If Fmax is set too high for every asset by default, the spectrum can lose the resolution needed to separate close peaks.
Sampling rate has to support that span. If it does not, higher-frequency content aliases into the measured range and creates peaks that do not belong to the machine. In practice, that leads to wasted troubleshooting hours and bad maintenance calls.
Lines of resolution control peak separation. More lines help on machines where sidebands, close harmonics, or gear mesh components sit near each other. The trade-off is longer acquisition time and greater sensitivity to speed change during the capture.
Averaging should fit machine behavior. Steady equipment usually benefits from averaging because it reduces random variation between captures. Intermittent defects do not. Too much averaging can smooth out the impact activity that often gives an early warning on damaged bearings or looseness.
Baseline and validation on an industrial refrigeration compressor
An industrial refrigeration compressor is a good example because one machine can produce several vibration signatures at once. The driver may show 1x running speed and misalignment indicators. The compressor can add vane pass or mechanical looseness behavior. Bearings and couplings can contribute higher-frequency content that only shows up if the route was configured to capture it.
The first clean dataset after installation should become the baseline. Record the exact measurement point, sensor direction, machine speed, load, suction and discharge condition if relevant, and any process state that changes vibration response. Without that context, teams often trend operating changes as if they were defects.
Validation starts with repeatability.
Before trending a point, collect the same measurement twice under similar operating conditions. If the spectra move around, check whether speed changed, load shifted, or the signal clipped during acquisition. If the time waveform shows impacts that disappear in the averaged spectrum, keep both views in the review. That pattern often matters more than the overall value.
A field validation routine should include:
- Repeat the capture at the same point: Stable machine condition should produce comparable spectra and waveform shape.
- Confirm operating state: Speed, load, temperature, and process condition should match the baseline as closely as practical.
- Review the waveform before trusting the FFT: Rubs, impacts, modulation, and overload often show up there first.
- Compare all measurement directions: Horizontal, vertical, and axial data help separate structural response from true machine faults.
- Check the fault family against the sensor choice: High-frequency bearing activity on a point intended only for low-frequency velocity data may require a different sensor strategy.
Trend quality matters as much as single-spectrum quality. Teams that improve diagnosis over time usually do it by keeping route settings fixed, documenting machine state well, and reviewing changes as patterns rather than isolated alarms. For analysts interested in applying time series techniques, the useful takeaway is straightforward. Separate normal operating variation from a true condition change before assigning a fault.
Practical Deployment Tips and Checklists
A maintenance team usually feels the strain when the first twenty sensor points turn into two hundred. The hard part is not buying hardware. It is deciding where continuous data will prevent a real failure, where a route is enough, and how to keep analysts from chasing alarms that never become work.
That decision works better when it starts with failure mode, not asset count. A slow-wearing pump bearing on a non-critical service line can sit on a monthly or biweekly route if the point is easy to reach and the machine runs in a stable operating range. A high-speed gearbox feeding a bottleneck process is different. If gear mesh sidebands or bearing impacts can develop between routes, permanent sensing usually pays for itself.
Plants also get better results when they separate monitoring strategy by machine behavior:
- Route-based measurements fit machines with slower fault progression: General service pumps, fans, and standard motors often show usable trend development before failure, especially when operating conditions stay consistent.
- Continuous monitoring fits fast or disruptive failures: Critical compressors, high-speed gearboxes, turbines, and inaccessible assets need tighter visibility because a weekly route can miss the defect growth window.
- Mixed programs often work best: Keep permanent sensors on critical assets and use route collection on lower-risk machines. That keeps coverage broad without flooding the team with data.
- Sensor choice should match the fault you expect to catch: Accelerometers suit bearing defects and gear tooth damage. Velocity sensing is often more useful for general machine condition on pumps and fans. Proximity probes belong on sleeve-bearing machines where shaft motion matters more than casing response.
Route-based versus continuous monitoring
A pulp and paper mill shows the trade-off clearly. Hundreds of motors may be installed across stock prep, pumping, vacuum systems, and finishing lines, but only a fraction can justify permanent monitoring. The right question is not whether the machine is important in general. The right question is whether the fault develops fast enough, costs enough, or creates enough safety exposure to justify continuous coverage.
Use a route when the machine is accessible, the defect progression is usually gradual, and a short delay between measurements will not turn a repair into an outage. Use continuous monitoring when the machine sits in a hazardous area, runs at high speed, supports a production constraint, or has a failure mode that changes quickly with load or process conditions.
A simple screening check helps:
- How fast can the expected fault develop?
- What happens to production if this machine trips today?
- Can a technician reach the measurement point safely and repeatedly?
- Do diagnosis and alarm setting require context between route intervals?
If two or more answers point toward urgency, permanent sensing is usually justified.
How to avoid alarm fatigue
Alarm fatigue starts with generic thresholds. A 1x running speed increase from slight imbalance is not handled the same way as high-frequency bearing energy, and neither should share one undifferentiated alert limit.
Set alarms around the failure family the sensor was installed to detect. For a motor and pump train monitored with casing accelerometers, a low-frequency band can watch imbalance, looseness, or misalignment, while a higher band can watch bearing condition. For a gearbox, track overall trend plus gear mesh bands and sideband behavior. For sleeve-bearing machines with proximity probes, shaft centerline position and orbit change often matter more than a single overall value.
A practical alarm setup usually includes:
- Separate bands by fault type: This keeps bearing activity from being buried under normal low-frequency vibration.
- Advisory and action levels: One level prompts review. The next level triggers planned maintenance.
- Confirmation rules: Require a repeat measurement, process check, or supporting indicator before creating urgent work.
- Clear ownership: An alarm without an assigned reviewer usually sits open until the machine fails anyway.
The workflow matters as much as the threshold. Teams that prevent failures route validated exceptions into the maintenance planning process, with enough detail to tell the planner whether the likely issue is imbalance, bearing damage, looseness, or gear deterioration. Broader examples of this discipline appear in this verified case study on operational efficiency, where data only matters once it changes day-to-day decisions.
One practical option for plants that need engineering support across route-based and continuous programs is Forge Reliability, which provides predictive maintenance and condition monitoring services for industrial facilities.
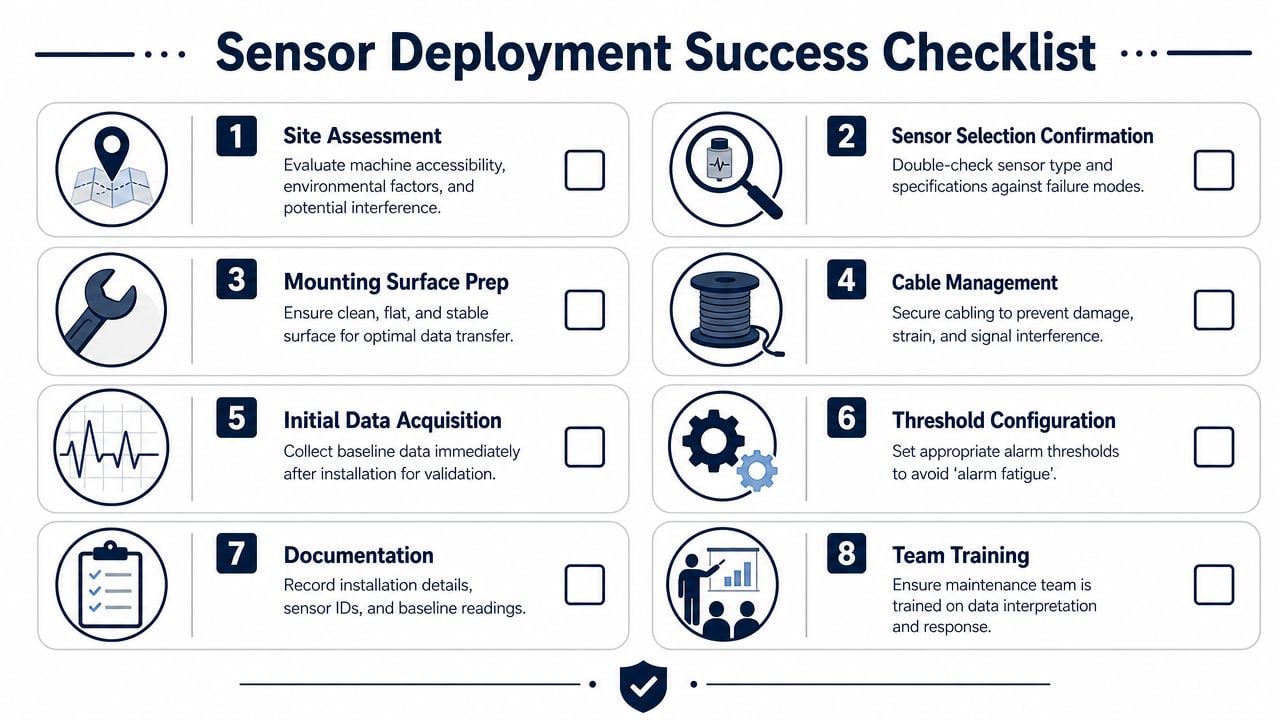
Deployment checklist for a new sensor point
Before a new point goes live, confirm the basics and the diagnostic intent:
- Defined failure target: State what the point is meant to catch, such as outer race bearing damage, pump imbalance, gear mesh wear, or shaft rub.
- Correct sensor type: Verify that the installed sensor matches the failure mode and machine construction.
- Correct mounting location: Place the sensor where the fault energy will transmit clearly, not where installation is merely convenient.
- Sound mounting method: Check surface prep, flatness, stud torque, magnet suitability, or adhesive condition.
- Known orientation: Record horizontal, vertical, or axial direction so future readings stay comparable.
- Protected cable run: Keep cables away from hot surfaces, high-current conductors, pinch points, and unsupported spans.
- Acquisition settings matched to the fault: Frequency range, resolution, and averaging should fit the machine and expected defect frequencies.
- Baseline captured at known operating state: Store speed, load, and process condition with the first accepted reading.
- Alarm and response plan in place: Define who reviews the exception and what evidence triggers a work request.
- Point documentation complete: Save sensor ID, photo, location sketch, machine train reference, and any access notes.
The common mistakes are predictable. Sensors get mounted on thin guards instead of bearing housings. Magnetic bases stay in place on machines where high-frequency bearing data is the whole reason for monitoring. A route point intended for bearing diagnosis gets collected with settings suited only for overall velocity. Those errors do not just reduce data quality. They change the fault picture enough to send maintenance in the wrong direction.
Well-run programs keep the checklist short, specific, and tied to actual failure prevention. That is what separates a growing sensor count from a useful vibration program.
Turn Your Data Into Downtime Avoidance
The biggest mistake in vibration work is treating the sensor as a commodity. It isn't. The sensor type, mounting method, signal path, and acquisition setup decide whether the plant sees a meaningful fault pattern or just a number that moves up and down.
That's why strategic deployment matters. Accelerometers, velocity sensors, and proximity probes each solve different diagnostic problems. A well-built program maps them to actual machine failure modes, installs them where the signal is strongest, validates the data before trending, and routes exceptions into maintenance action. That's how vibration analysis sensors prevent failures instead of documenting them after the fact.
A multi-site manufacturer can install wireless devices on everything and still remain reactive if no one trusts the alarms or if the CMMS never receives actionable work. On the other hand, a smaller program with disciplined point selection and strong validation can prevent repeated pump, fan, gearbox, and compressor failures. The difference is engineering judgment.
Operational examples from outside vibration work show the same principle. This verified case study on operational efficiency is useful because it reinforces a broader industrial truth. Data only creates value when teams convert it into decisions that prevent production loss.
Plants don't need more readings. They need readings that answer the maintenance question clearly enough to act.
If the current vibration program is generating data but not enough confidence to prevent failures, a free assessment can help identify the gaps. Forge Reliability can review sensor selection, mounting practices, route design, alarm strategy, and workflow integration to show where the program is missing diagnostic precision and where it can start avoiding downtime.