
Tuesday night, a centrifugal pump seal fails on a critical cooling-water line. The CMMS shows a matching kit available, but the shelf is empty because the part was issued last quarter and never reordered. Production loses eight hours and roughly $180,000 in margin while maintenance arranges an airfreight shipment from a regional supplier.
That failure isn't a purchasing mistake. It's a reliability failure caused by a stocking rule that ignored asset criticality, demand behavior, lead time, and transaction discipline. The opposite problem is just as common: a generic min-max policy fills the storeroom with slow-moving bearings, gaskets, and obsolete spares that nobody has touched in seven years.
The practical answer is spare parts optimization, where every stocking decision supports a measurable service-level target and a broader maintenance strategy. The objective isn't to minimize inventory at any cost. It's to protect equipment availability while controlling capital tied up in MRO stock, using reliability evidence rather than habit.
Table of Contents
- The Hidden Cost of a Mis-Stocked Storeroom
- Classifying Parts by Criticality and Demand
- Setting Stocking Targets With Service-Level Math
- Choosing the Right Supply Strategy by Asset
- Governing CMMS Data So the Model Can Trust It
- Measuring Results With KPIs and Lifecycle Cost
- A 30-Day Spare Parts Optimization Plan
The Hidden Cost of a Mis-Stocked Storeroom
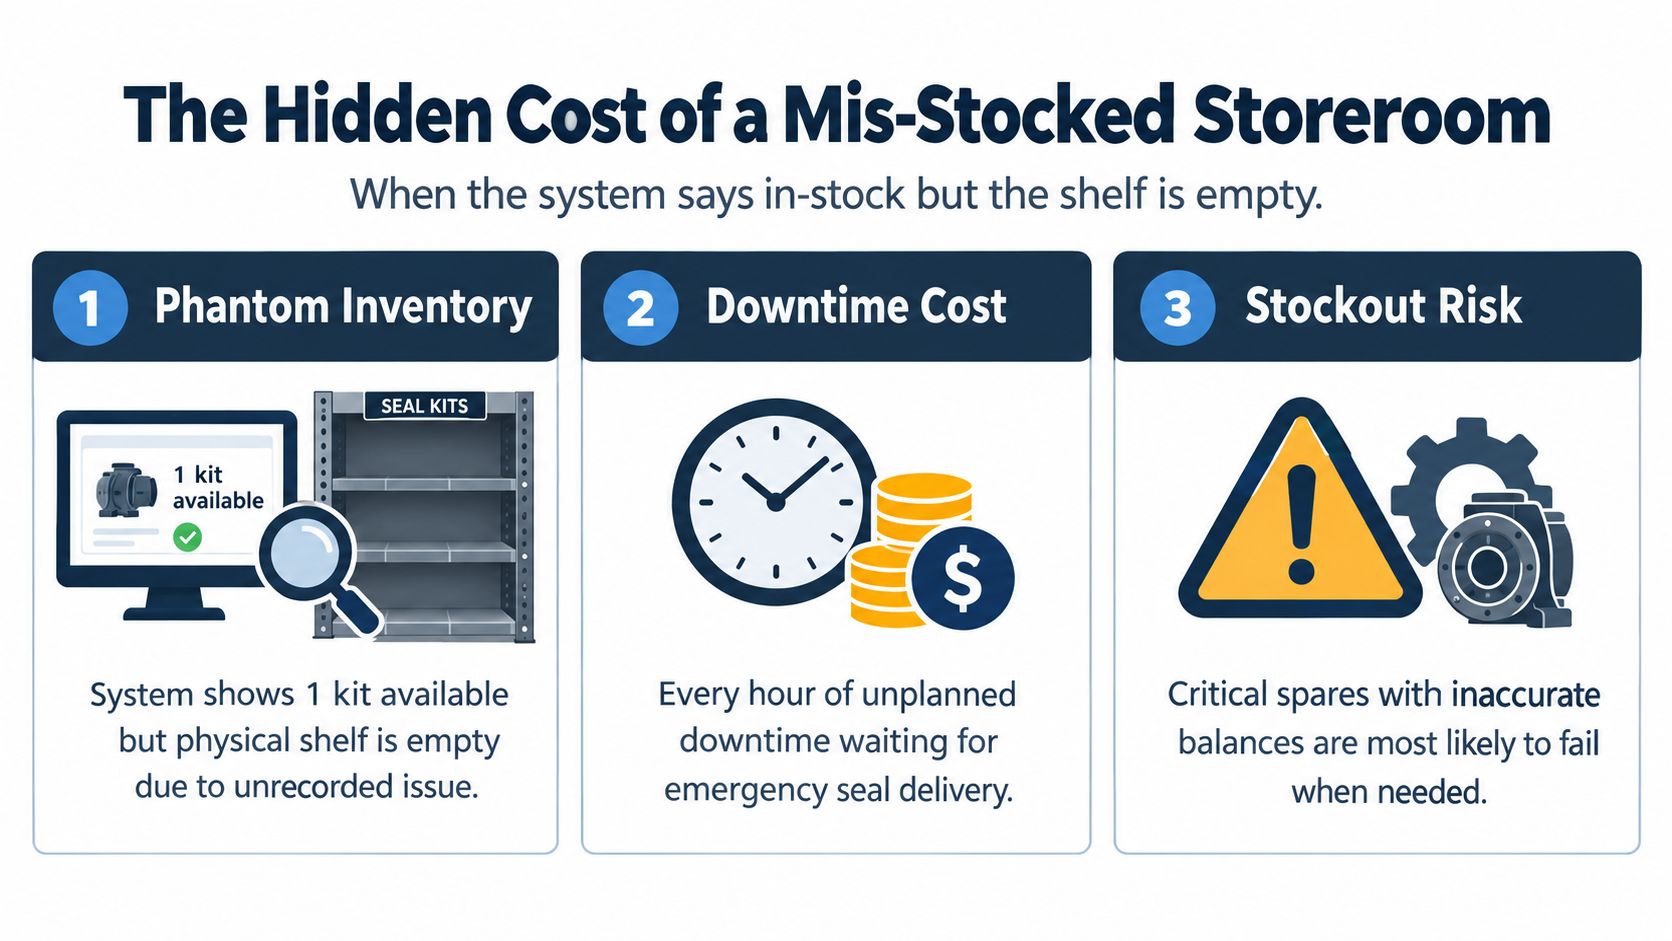
The Tuesday-night pump failure exposes a dangerous condition known as phantom inventory. The computer balance looks healthy, but the physical stock is missing, incorrectly labeled, damaged, or held in an informal cache. A planner trusts the system, schedules the repair, and discovers the shortage only after the pump is already down.
That delay creates more than an emergency purchase. The plant may need overtime, expedited freight, temporary process changes, and a second review of every related part number. For a cooling-water system, the consequence can extend beyond one pump because reduced flow may affect heat exchangers, compressors, production lines, or safety-critical support systems.
The opposite failure occurs when every part receives the same replenishment treatment. A blanket min-max setting can keep common gaskets and bearings available while also preserving expensive, obsolete items that no longer match installed equipment. That policy appears orderly in a report, but it doesn't distinguish a seal that can stop a bottleneck process from a fastener that can be purchased locally.
Practical rule: A part's stocking policy should reflect the consequence of its absence, not just its purchase price or historical usage.
A credible program starts by separating failure-critical parts from non-critical items. A failure-critical part is one whose absence stops a line, halts a process, or creates a safety risk. Guidance on MRO inventory management recommends stocking such parts at the highest service level the budget allows, while lower-consequence items can use lower service levels or on-demand replenishment through serial production MRO parts resources when appropriate.
The same principle applies to the maintenance strategy itself. A seal that repeatedly fails because of pipe strain, cavitation, shaft misalignment, or poor installation shouldn't be protected only with more inventory. The plant should investigate the failure mechanism through vibration analysis, alignment checks, operating-condition review, and root cause analysis. Inventory protects the repair window, but reliability engineering should reduce the frequency of that repair.
A useful starting point is to review maintenance cost reduction practices alongside the storeroom data. Both extremes, chronic stockouts and excessive inventory, usually come from the same root cause: stocking rules were created without a criticality anchor.
Classifying Parts by Criticality and Demand
A storeroom needs more than an alphabetical list of SKUs. It needs a decision system that connects business consequence with demand behavior. ABC/XYZ analysis provides a practical structure: ABC ranks parts by annual consumption value, while XYZ ranks demand by variability or predictability.
A maintenance-focused framework describes A items as roughly 10–20% of SKUs representing 70–80% of inventory value, B items as 20–30% of SKUs, and C items as 50–70% of SKUs representing only 5–10% of value. Those ranges are from the ABC and XYZ spare-parts strategy guide, and they should be treated as a classification starting point rather than a universal plant rule.
Score consequence before choosing a policy
Criticality scoring should include more than a maintenance team's instinct that an asset is “important.” A practical assessment weights five inputs:
- Safety consequence: Determine whether failure can expose personnel to hazardous energy, pressure, temperature, chemicals, or rotating equipment.
- Environmental impact: Identify releases, contamination, or permit risks created by loss of the component.
- Production loss per hour: Estimate the operational consequence using the plant's actual bottleneck and process dependencies.
- Redundancy available: Confirm whether a standby pump, parallel train, bypass, or temporary connection can carry the load.
- Mean time to repair: Include access, diagnosis, isolation, lifting, specialist labor, testing, and recommissioning.
A mechanical seal on a single centrifugal pump serving a bottleneck cooling-water circuit may rank high on consequence and low on redundancy. If failures are relatively predictable because the seal is replaced during planned overhauls, the item may fit the AX quadrant, high criticality with predictable demand.
A gearbox bearing can produce a different result. If the gearbox has a standby unit or a repair exchange available, and bearing failures occur sporadically, the part may fit BZ, moderate criticality with variable demand. That classification supports a different supply model from the pump seal.
Use the matrix to assign behavior
| Quadrant | Profile | Recommended Stocking Policy | Example Part |
|---|---|---|---|
| AX | High criticality, predictable demand | Min-max with safety stock and a defined service-level target | Critical-line pump seal |
| AY | High criticality, variable demand | Higher protection, condition monitoring, and reviewed replenishment assumptions | Compressor control component |
| AZ | High criticality, sporadic demand | Insurance stock, consignment, or repair-exchange agreement | Long-lead turbine card |
| BZ | Moderate criticality, sporadic demand | Vendor-managed replenishment, pooled stock, or repair exchange | Gear reducer bearing |
| CZ | Low criticality, sporadic demand | On-demand purchase and obsolescence review | Non-critical enclosure hardware |
The classification must remain connected to failure analysis. FMEA for manufacturing can help link failure modes, effects, causes, and controls before the part receives a stocking rule.
Criticality reviews also need to catch hidden single points of failure. A spare coupling for a firewater pump may look inexpensive and rarely used, yet its absence can compromise a protection system during a shutdown or emergency. Scores that ignore redundancy assumptions, common-cause failures, or inaccessible storage locations are the ones that fail under pressure.
Setting Stocking Targets With Service-Level Math
Criticality becomes useful only when it produces a measurable target. Service level is the probability that a spare-part request won't be rejected because the item is unavailable. A foundational optimization framework treats stocking as a tradeoff among cost, equipment availability, and target stock reliability, while also distinguishing repairable from non-repairable spares and instantaneous from interval reliability in its models (critical spare-parts optimization research).
For day-to-day planning, the basic relationship is:
Safety stock = Z × σLT
Here, Z is the service-level factor, and σLT is the standard deviation of demand over lead time. The same framework defines the reorder point as expected lead-time demand plus safety stock. That is the bridge between reliability policy and the min-max values maintained in a CMMS.
A worked example
Consider a pump seal with average demand of four units per quarter, supplier lead time of six weeks, and demand standard deviation of 1.2 units. Using the stated demand-over-lead-time assumption, the safety-stock calculation produces approximately 3.7 units at a 95% service level and 5.9 units at a 99% service level.
The relevant reference values are Z≈1.65 for 95% and Z≈2.33 for 99%, as described in this service-level mathematics guide. The difference between the targets is where carrying cost can expand. The plant shouldn't automatically choose 99% for every SKU, because that would impose the protection cost of a critical spare on items whose absence has little operational consequence.
| Service-Level Target | Z-Factor | Safety Stock (units) | Annual Carrying Cost Delta |
|---|---|---|---|
| 90% | ≈1.28 | Calculated as Z × σLT | Baseline comparison required |
| 95% | ≈1.65 | ≈3.7 for the worked seal example | Higher than 90% |
| 99% | ≈2.33 | ≈5.9 for the worked seal example | Higher than 95% |
The annual carrying-cost delta should be calculated from the plant's unit replacement cost, holding-cost policy, storage burden, and obsolescence exposure. No universal dollar delta is valid without those inputs.
Turn the target into a policy
A differentiated policy might assign AX parts a 99% target, AY parts a 97% target, and AZ parts a 95% target, with B-tier parts stepping down to 90% or moving to vendor-managed replenishment. Those targets are policy choices that must be approved against production, safety, supplier, and financial risk.
One practical framework gives 98% as an example service level for a critical spare and 85% for a non-critical spare, while emphasizing that classifications should be reviewed as equipment criticality, lead times, and failure consequences change. The exact target matters less than the discipline of documenting why each SKU receives it.
Mean time between failure can inform the demand assumption, but it shouldn't replace condition evidence or failure-mode analysis. A plant reviewing mean time between failure calculations should also check whether failures arise from installation quality, lubrication, contamination, electrical stress, or operating conditions. Stocking targets without that context are just numbers, not decisions.
Choosing the Right Supply Strategy by Asset
“Stock everything” is not a supply strategy. It's a reaction to uncertainty. The better approach matches the part's criticality, lead time, repairability, failure mode, and site network to the lowest-risk sourcing model.
A pump seal for a bottleneck asset may justify on-site stock because the part is relatively compact, failure stops production, and the repair window is short. A large rotor or specialized bearing may be better handled through consignment, provided ownership, inspection, preservation, response time, and transport responsibilities are written into the agreement.
| Asset / Part Type | Criticality | Typical Lead Time | Recommended Strategy |
|---|---|---|---|
| Pump mechanical seal | High | Short to moderate | On-site safety stock with service-level control |
| Gearbox assembly or bearing | Moderate to high | Moderate to long | Repair exchange, pooled stock, or consignment |
| Control card | High | Long or uncertain | On-site insurance stock or consignment with tested replacement |
| PPE and low-criticality consumables | Low to moderate | Short | Shared service-center stock or direct purchase |
Compare the alternatives
Repair versus replace works best for motors, pumps, and gearboxes when the repair process is repeatable and turnaround time is known. The decision should include inspection findings, winding or shaft condition, bearing seats, seal surfaces, balancing, testing, and the risk that repair discovers additional damage. A cheap repair that returns a misaligned or poorly balanced asset to service can increase spare demand rather than reduce it.
Consignment suits expensive, long-lead components that must be available but may remain unused. The agreement should define who pays for preservation, obsolescence, testing, and emergency release. Without those controls, consignment can create an illusion of availability while the part is not ready for installation.
Vendor-managed pooling makes sense for low-volume spares shared across sister plants. It reduces duplicate ownership, but only if the pool has reliable visibility, transportation rules, compatible specifications, and a response commitment consistent with the assigned service level.
Shared service centers fit non-critical consumables and common maintenance materials. They aren't appropriate for a single point of failure whose replenishment time exceeds the plant's tolerance for downtime.
Research on joint optimization of redundancy and spare inventory found that availability-to-cost performance improved in a Qatar public-organization case by reducing redundancy while increasing spare-parts inventories (joint redundancy and spare-parts optimization). The broader lesson is that engineering redundancy and inventory depth should be evaluated together, not optimized in separate departments.
Governing CMMS Data So the Model Can Trust It
Optimization math fails when the CMMS doesn't describe the physical plant. A duplicate OEM part number, an incorrect unit of measure, or an unlinked bill of materials can produce a mathematically precise stocking recommendation for the wrong item.
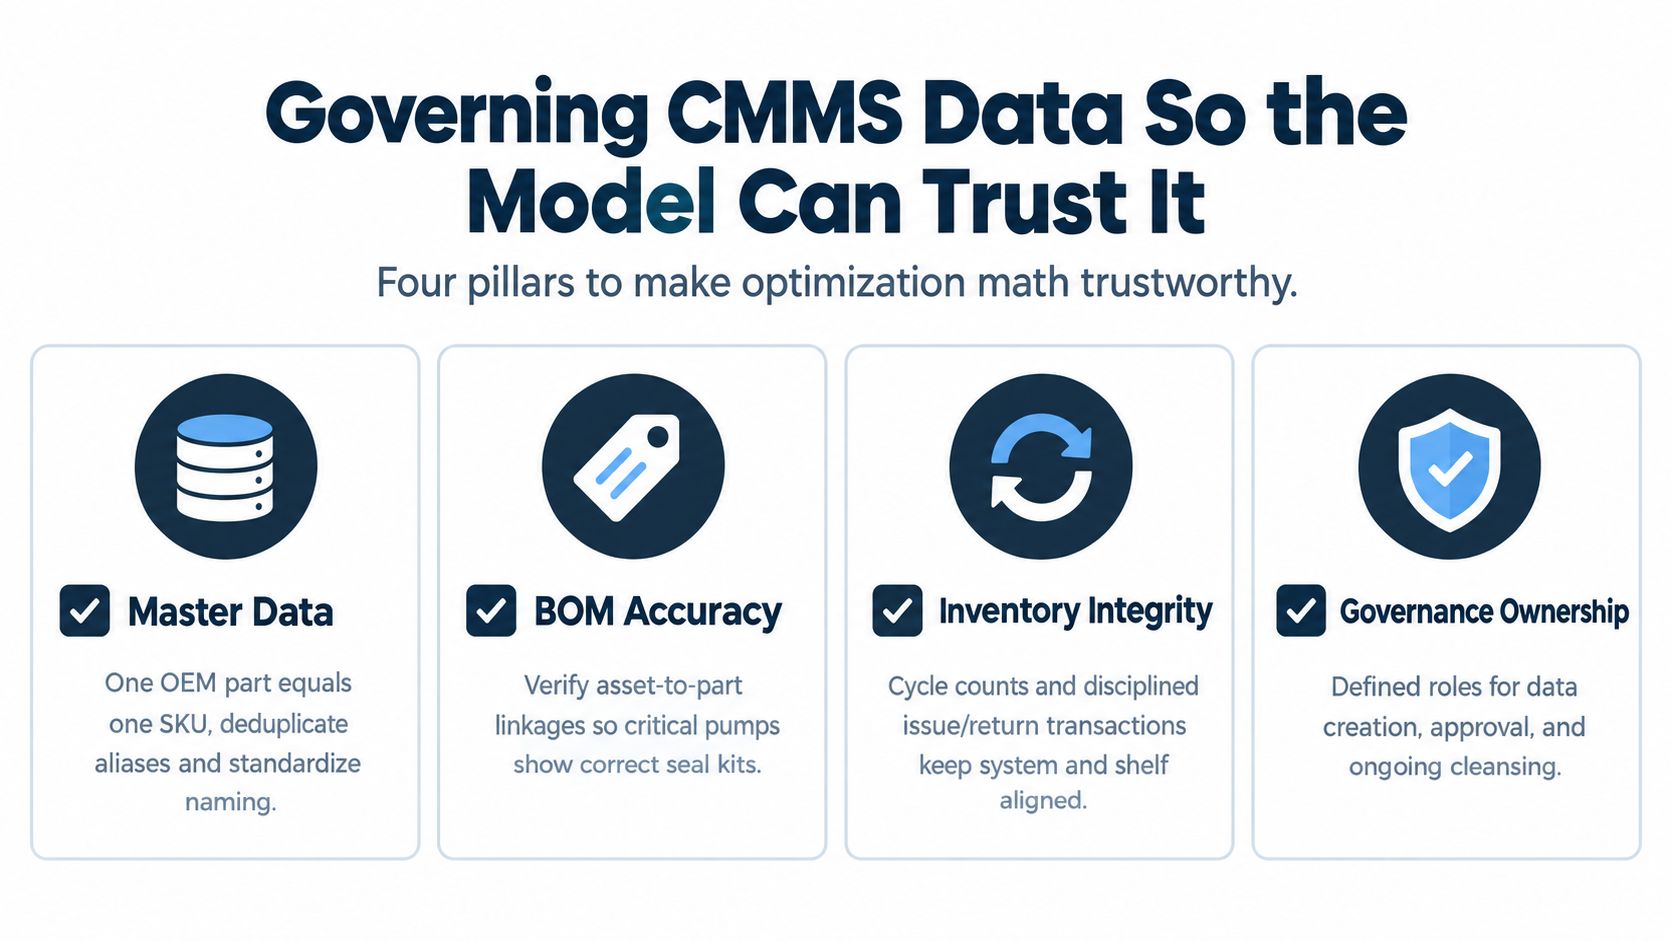
Four governance pillars deserve ownership.
Master data and BOM accuracy
Each physical part should have one controlled SKU, a normalized description, manufacturer information, specifications, approved alternatives, and a verified storage location. Duplicate records must be merged carefully so historical issues, open purchase orders, and asset links aren't lost.
The asset bill of materials must also be credible. A critical pump should show the correct seal kit, bearing set, coupling, fasteners, and installation materials. If technicians routinely search free text because the BOM is incomplete, the resulting demand history will be distorted.
Transactions and failure history
Cycle counts should be tied to disciplined issue and return transactions, preferably through work orders rather than blind adjustments. A negative quantity in the issuing process is a warning that the system and shelf have diverged, not a minor administrative nuisance.
Failure codes need to connect the asset, failure mode, cause, and corrective action. A bearing issued for lubrication starvation should not be treated as equivalent to a bearing damaged by shaft misalignment or electrical fluting. Those causes lead to different maintenance decisions and different future demand.
Practical quality checks
A maintenance manager can assign a data steward and require weekly exception reports covering:
- Duplicate parts: Identify aliases, alternate descriptions, and repeated OEM numbers.
- No-movement records: Review parts without movement at 365 days and 730 days for criticality, obsolescence, and preservation status.
- Negative balances: Investigate every negative-quantity event and correct the transaction path.
- BOM mismatches: Compare installed equipment records with manufacturer documentation and field verification.
- Last-issue reconciliation: Compare the last issue date with expected failure behavior and MTBF assumptions.
Inventory valuation also needs control. The unit of issue must match how the plant buys and consumes the part, while replacement cost should be current enough to support a realistic lifecycle decision.
CMMS asset-management practices can support the governance model, but ownership still belongs with named people. Optimization runs should be gated behind a clean-data scorecard owned by the maintenance manager. If the scorecard fails, the team should fix the data before changing reorder parameters.
Measuring Results With KPIs and Lifecycle Cost
A spare-parts program earns credibility when it connects storeroom activity to plant outcomes. Counting inventory turns alone can reward understocking. Counting service level alone can reward excessive inventory. The KPI stack must show whether the plant is buying protection efficiently.
The first layer belongs to the shop floor:
- Stockouts prevented: Track unplanned requests that could have stopped work or extended downtime.
- Working capital tied up: Compare inventory value with the service level assigned to each criticality tier.
- Planned versus emergency work orders: Check whether parts availability enables scheduled repairs instead of forcing emergency work.
- Cost to serve by criticality tier: Include purchasing, storage, handling, emergency freight, repair exchange, and downtime exposure.
Build the financial view around the asset
Lifecycle cost should be calculated for the component and the asset it supports. The calculation includes acquisition, installation labor, expected service life, energy impact, inspection or repair requirements, and disposal. This turns a repair-versus-replace argument into a payback comparison.
For example, a gearbox bearing may have a modest purchase price but require extensive crane access, alignment, oil flushing, and post-repair testing. A higher-quality replacement may cost more to acquire while reducing repeat intervention, secondary damage, and energy losses caused by poor alignment or increased friction.
Asset lifecycle management gives maintenance and operations leaders a structure for connecting those component choices to capital planning and long-term equipment performance.
Use KPI movement to adjust policy
The stocking model should be reviewed against actual failure and work-order results. If line-down hours decline for Tier A spares while Tier C inventory remains excessive, the program is moving in the right direction. If Tier A stockouts continue, the team should investigate demand assumptions, lead-time variability, physical accuracy, maintenance execution, and whether the service-level target is sufficient.
A joint research approach to redundancy and spares also demonstrates why availability should be evaluated with cost rather than treated as an isolated maximum. In one plant study from that research line, replenishment frequency needed to be synchronized with inspection cadence, showing that parts policy and maintenance scheduling cannot be managed as unrelated workstreams.
A 30-Day Spare Parts Optimization Plan
A maintenance manager doesn't need to optimize every SKU before producing useful results. The first month should focus on critical assets, high-consequence parts, and data defects that can invalidate every later calculation.
Week 1
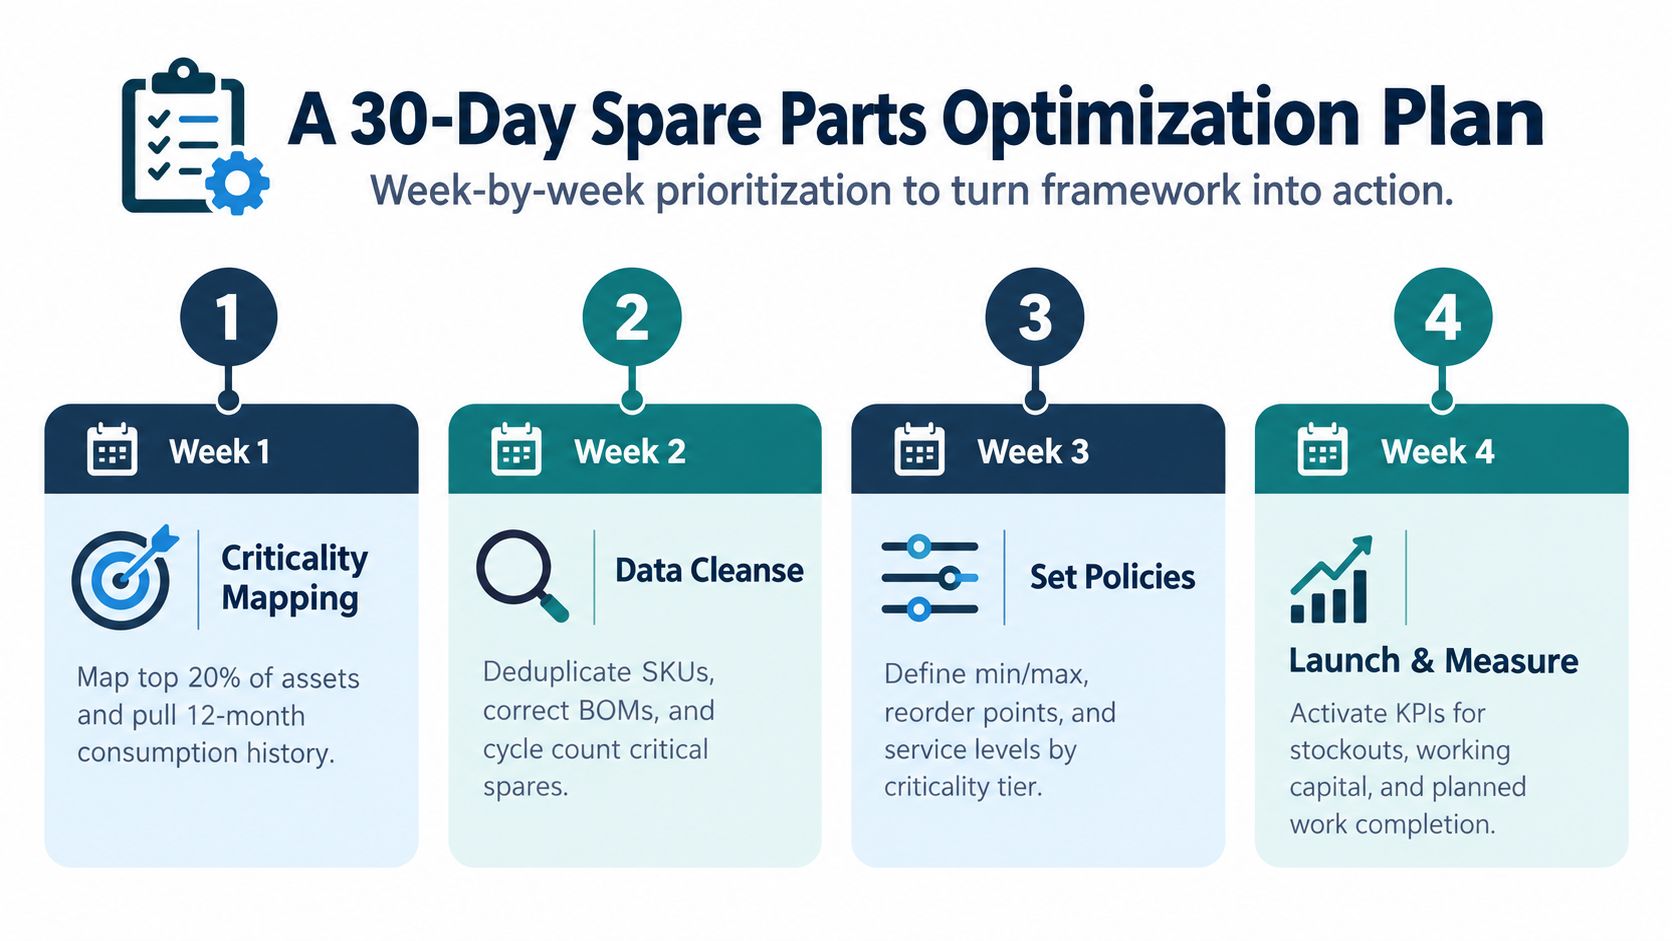
Map criticality across the top 20% of assets and pull the last 24 months of usage data from the CMMS. Verify the equipment list against the operating process, not just the asset hierarchy. A production-critical motor with no standby, a firewater pump coupling, and a cooling-water pump seal should receive a field review even if their issue history is limited.
Week 2
Clean the records that affect stocking decisions:
- Deduplicate SKUs: Close duplicate part numbers after checking open orders and historical transactions.
- Normalize units of measure: Confirm whether the part is bought, stored, and issued as an individual item, kit, set, or package.
- Validate BOMs: Confirm that critical pumps, compressors, motors, and gearboxes show the parts technicians install.
- Verify balances: Cycle count critical spares and investigate phantom inventory, negative quantities, and unapproved storage locations.
- Check lead times: Replace assumptions with supplier and internal replenishment evidence.
Week 3
Apply the service-level math to A-class SKUs and document the reason for every target. Review slow-moving critical items for repair exchange, consignment, regional pooling, or insurance stock. At the same time, examine whether recurring failures point to lubrication, contamination, alignment, cavitation, electrical stress, or installation problems that should be addressed through predictive maintenance or root cause analysis.
Week 4
Lock in the KPI definitions, assign storeroom ownership, and schedule the first quarterly review. The review should compare stockouts, planned work completion, inventory value, physical accuracy, and downtime by criticality tier. It should also approve changes to service levels, reorder points, and sourcing strategies rather than allowing parameters to drift without accountability.
The decisions for the next 30 days are specific: identify which assets cannot tolerate a stockout, clean the part records supporting those assets, set differentiated service-level targets, choose supply strategies for long-lead items, and assign one owner to sustain the data. Maintenance leaders can request a free reliability assessment from Forge Reliability to evaluate criticality, CMMS integrity, predictive maintenance opportunities, and spare-parts policies, then turn the findings into an actionable uptime plan.