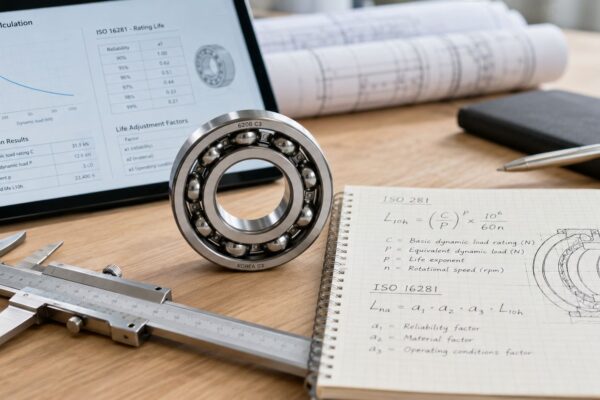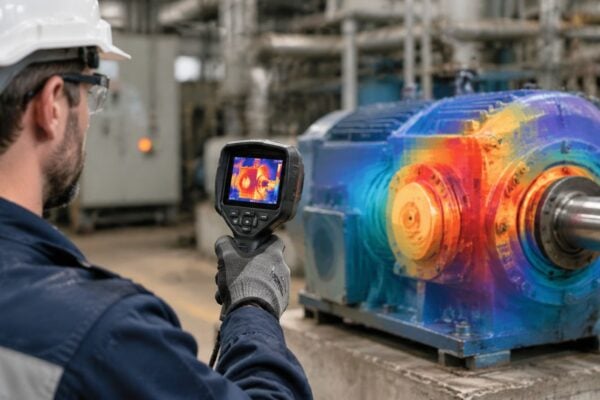
A cooling-water pump can run smoothly through an entire shift, then trip when the bearing finally loses enough integrity to stop the shaft. By the time operators hear a change or see a temperature alarm, the maintenance window may already be gone. A properly designed predictive maintenance vibration analysis program gives the reliability team an earlier mechanical signal, but only if the team knows how to interpret it and turn it into a controlled work order.
Table of Contents
- Introduction Why Vibration Tells You First
- How Vibration Measurement Actually Works
- Common Fault Signatures Every Analyst Should Recognize
- Data Collection Strategies and Sensor Selection
- From Spectrum to Work Order Analysis Workflows and Alarm Logic
- Proving Value KPIs ROI and Industry Application Notes
- Next Steps and Your Free Reliability Assessment
Introduction Why Vibration Tells You First
Vibration analysis measures the oscillating motion produced by running machinery and interprets changes in that signal. A pump, motor, compressor, gearbox, or fan always produces some vibration. The reliability question isn't whether vibration exists. It's whether the pattern has changed in a way that points to imbalance, misalignment, looseness, bearing damage, gear wear, or another developing fault.
That makes vibration-based predictive maintenance different from preventive maintenance. Preventive maintenance replaces a bearing or inspects a coupling on a fixed schedule. Predictive maintenance uses measured equipment condition to decide when inspection or repair is justified. Vibration analysis became a practical predictive maintenance discipline in the mid-to-late 1970s, and early programs relied heavily on externally accessible signals such as vibration and lubricating oil. The AVM-1 from Tecalamet Electronics appeared around 1982, an important milestone in the move from periodic inspection toward condition-based monitoring for rotating assets. Historical development of vibration measurement in predictive maintenance
For a plant leader, the value isn't a colorful spectrum on an analyst's screen. The value is a better decision. A rising 1X running-speed component may justify balance verification. A bearing defect frequency may support a planned replacement. A changing signal on a critical pump may require an immediate operating review rather than an automatic shutdown.
Practical rule: A vibration alarm is not a repair instruction. It's evidence that must be interpreted against machine design, operating state, failure mode, and consequence.
The strongest programs connect vibration with work history, lubrication records, process conditions, and complementary condition-monitoring methods. Teams assessing pumps and motors may also find acoustic monitoring for industrial reliability useful when leaks, lubrication starvation, or high-frequency distress sit outside vibration's earliest detection window.
The progression is straightforward. First, the team learns how a raw waveform becomes a frequency spectrum. Then it recognizes fault signatures, selects a repeatable collection method, establishes alarm logic, and connects findings to the CMMS. Vibration becomes the foundation of a data-driven reliability strategy, not an isolated inspection activity.
How Vibration Measurement Actually Works
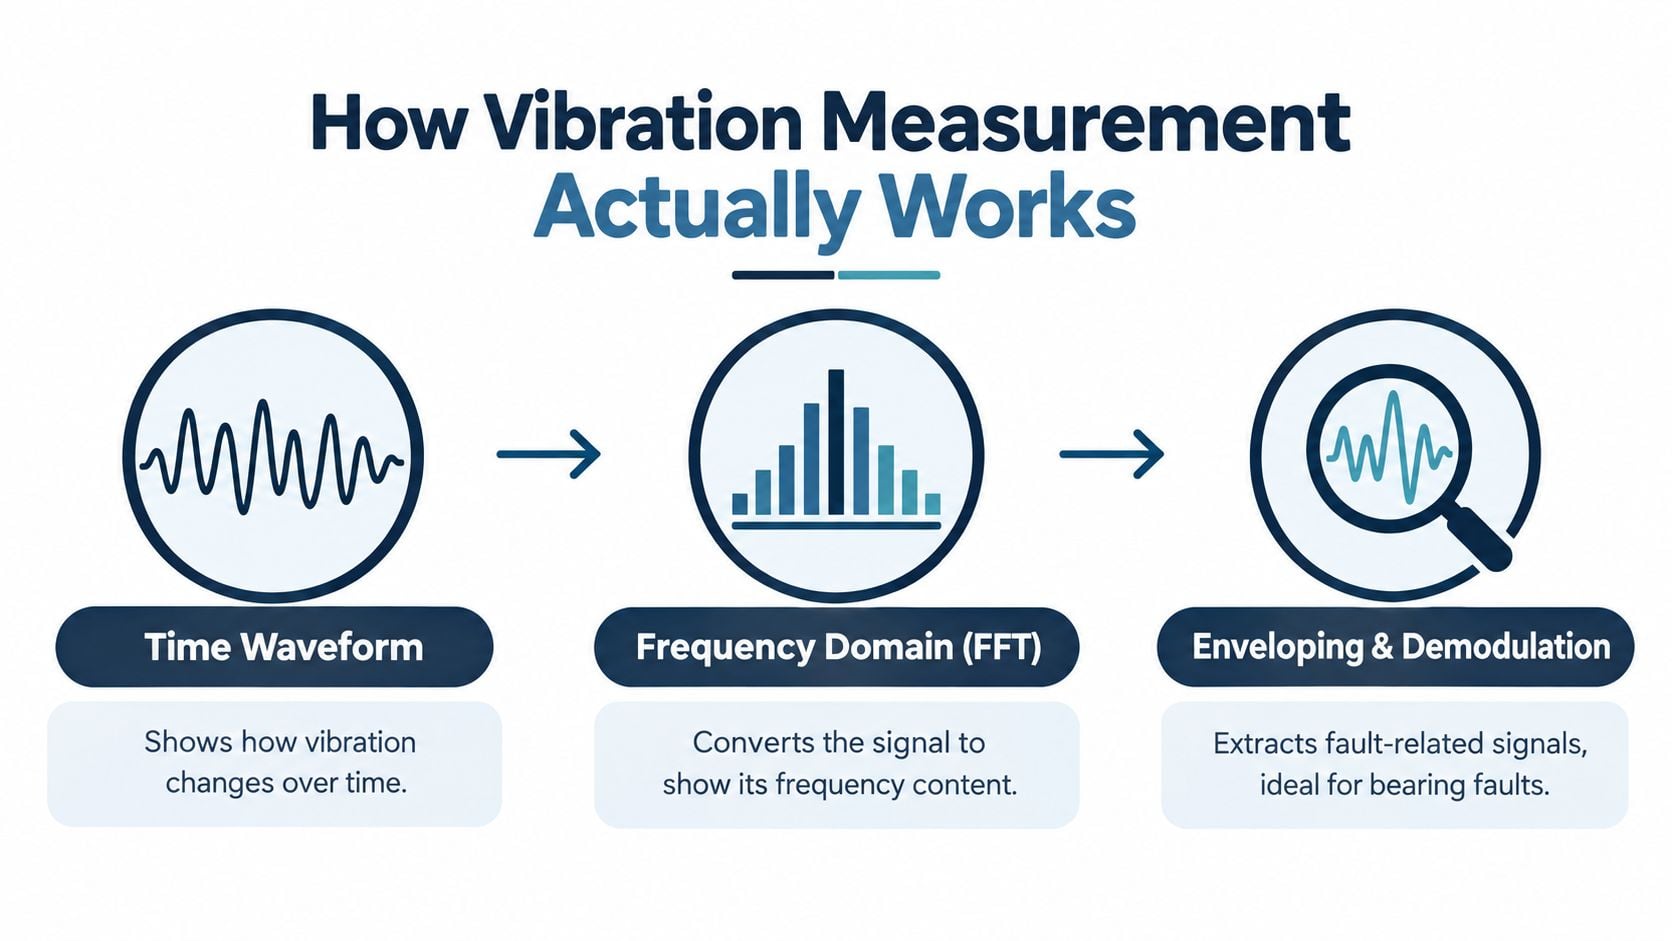
A vibration measurement starts as a time waveform. This is a record of how acceleration, velocity, or displacement changes moment by moment. A smooth repeating waveform may indicate a stable rotating force. Sharp impacts can point toward a developing bearing or gear problem.
From waveform to frequency
The raw waveform tells the analyst when motion occurs. An FFT, or Fast Fourier Transform, reorganizes that signal to show which frequencies are present and how much energy sits at each frequency. The result resembles a music equalizer. A strong bar at the shaft's running speed, called 1X, shows that the machine has a prominent once-per-revolution component. Additional bars at 2X, 3X, and other harmonics add diagnostic context.
A centrifugal pump with a dominant 1X peak may have rotor imbalance, but the spectrum alone doesn't prove it. The analyst still needs phase information, direction, machine history, and operating context. A pump that changes speed under VFD control also needs RPM tracking, because a fixed frequency alarm can become misleading when shaft speed moves.
Frequency resolution depends on the acquisition setup. A longer sample separates nearby frequency components more clearly, while a higher sampling rate captures faster events. For early bearing diagnosis using bandpass filtering and envelope analysis, one technical guide specifies a minimum 2-second acquisition window and at least 20 kHz sampling. Bearing defect frequency and envelope-analysis guidance
Finding impacts hidden in overall vibration
Enveloping, also called demodulation, isolates repetitive high-frequency impacts from a broader vibration signal. The process applies a bandpass filter to focus on a selected frequency band, then extracts the amplitude pattern of the impacts. This helps reveal a small bearing defect that may be masked by the larger low-frequency forces from the shaft, coupling, or structure.
Bearing diagnosis becomes more specific when the analyst calculates geometry-based frequencies:
- BPFO, or ball-pass frequency outer race, relates to impacts on the stationary outer race.
- BPFI, or ball-pass frequency inner race, relates to impacts on the rotating inner race.
- BSF, or ball-spin frequency, relates to a defect on a rolling element.
- FTF, or fundamental train frequency, relates to cage rotation.
These frequencies depend on bearing dimensions and shaft speed. As a raceway or rolling-element defect grows, contact produces sharper repeated impulses. Energy then rises at the characteristic frequency and its harmonics. Sidebands can indicate modulation caused by load variation, cage slip, or secondary mechanical interactions.
A dryer motor on a paper machine illustrates the distinction. Overall vibration may remain stable while an envelope spectrum shows a steadily rising BPFI peak and harmonics. That pattern supports a bearing inspection and planned replacement, even though a broad severity reading hasn't yet entered a critical zone. Teams seeking consistent field measurements can review guidance on selecting a triaxial accelerometer sensor for direction-sensitive data collection.
Common Fault Signatures Every Analyst Should Recognize
A spectrum becomes useful when it supports a physical explanation. The analyst should be able to look at a pump or gearbox signature and ask what force could create that pattern, what evidence would confirm it, and what action protects production without replacing healthy parts.
Imbalance and misalignment
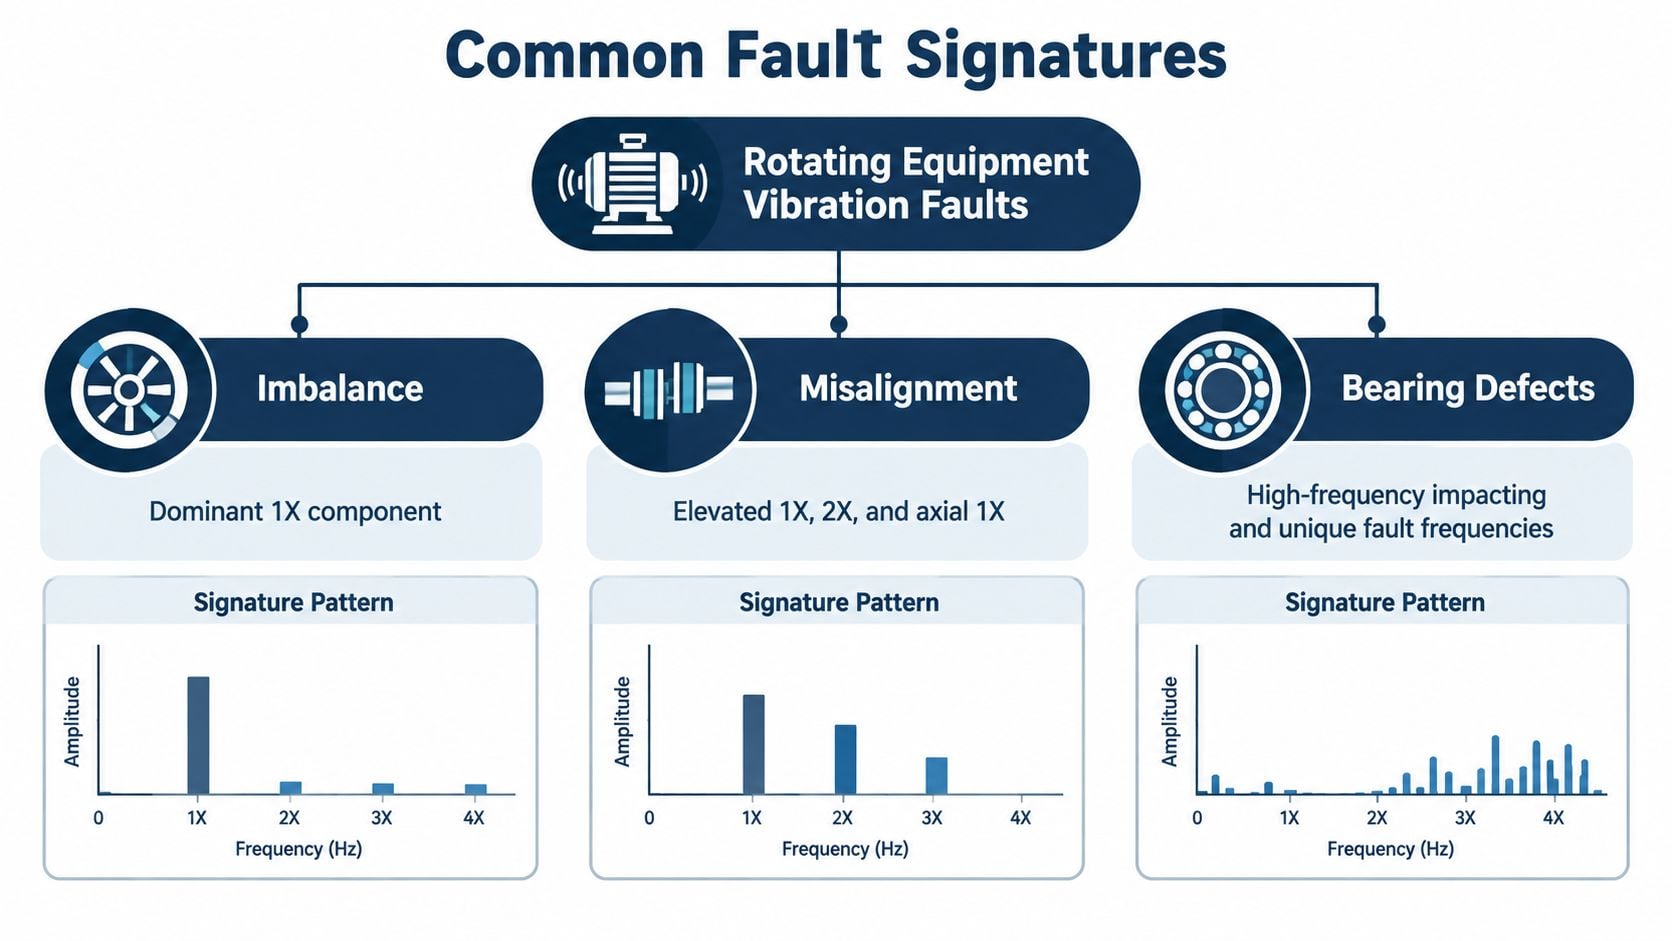
Imbalance usually produces a dominant 1X running-speed component, often strongest in the radial direction. A centrifugal pump impeller with buildup, erosion, or an uneven repair may create this pattern. Before scheduling balancing, the team should compare phase across bearing locations and trend the amplitude under consistent load. A strong 1X peak can also come from bent shafts, resonance, or process forces.
Misalignment often produces prominent 1X and 2X components, with axial vibration providing an important clue. Angular misalignment loads the coupling and can make axial measurements more prominent. Parallel offset may show stronger radial response. A coupling inspection, shaft alignment check, and phase comparison help separate misalignment from simple imbalance.
Looseness, gears, and bearings
Mechanical looseness often generates several harmonics of running speed, a raised noise floor, or irregular impacts. The source may be a loose bearing fit, degraded foundation, soft foot, cracked support, or loose hold-down bolt. A maintenance team shouldn't tighten components solely because harmonics appear. It should verify structural condition and inspect the machine's mounting surfaces.
Gear defects produce gear-mesh energy, harmonics, and sidebands around the mesh frequency. Sidebands are smaller peaks spaced around a primary frequency. They often indicate amplitude or frequency modulation from changing load, shaft rotation, cage slip, or another interaction. A gearbox with a stable overall level but growing sidebands may need oil inspection, tooth-contact review, and load assessment before the fault advances.
Bearing faults show characteristic frequencies such as BPFO, BPFI, BSF, or FTF, often accompanied by harmonics and high-frequency impacting. A useful bearing failure reference for rotating equipment can support failure-mode identification, but the machine's own geometry and speed must control the diagnosis.
Same level, different decision
Two assets can share the same overall vibration value and require completely different actions. A pump with a stable broadband value and dominant 1X may need balance correction. A gearbox with the same overall value and rising gear-mesh sidebands may need a lubrication and tooth-condition review. A motor with stable RMS but increasing BPFI energy may need bearing planning.
The analyst should confirm suspected root cause with:
- Phase data, to compare motion relationships across machine locations.
- Operating-state information, including speed, load, valve position, and process condition.
- Trend direction, because a stable level and a rapidly rising level carry different risk.
- Physical inspection, including coupling condition, fasteners, lubrication, alignment, and foundation stiffness.
Diagnosis turns a frequency pattern into a maintenance decision only when the signal agrees with the machine's mechanical story.
Data Collection Strategies and Sensor Selection
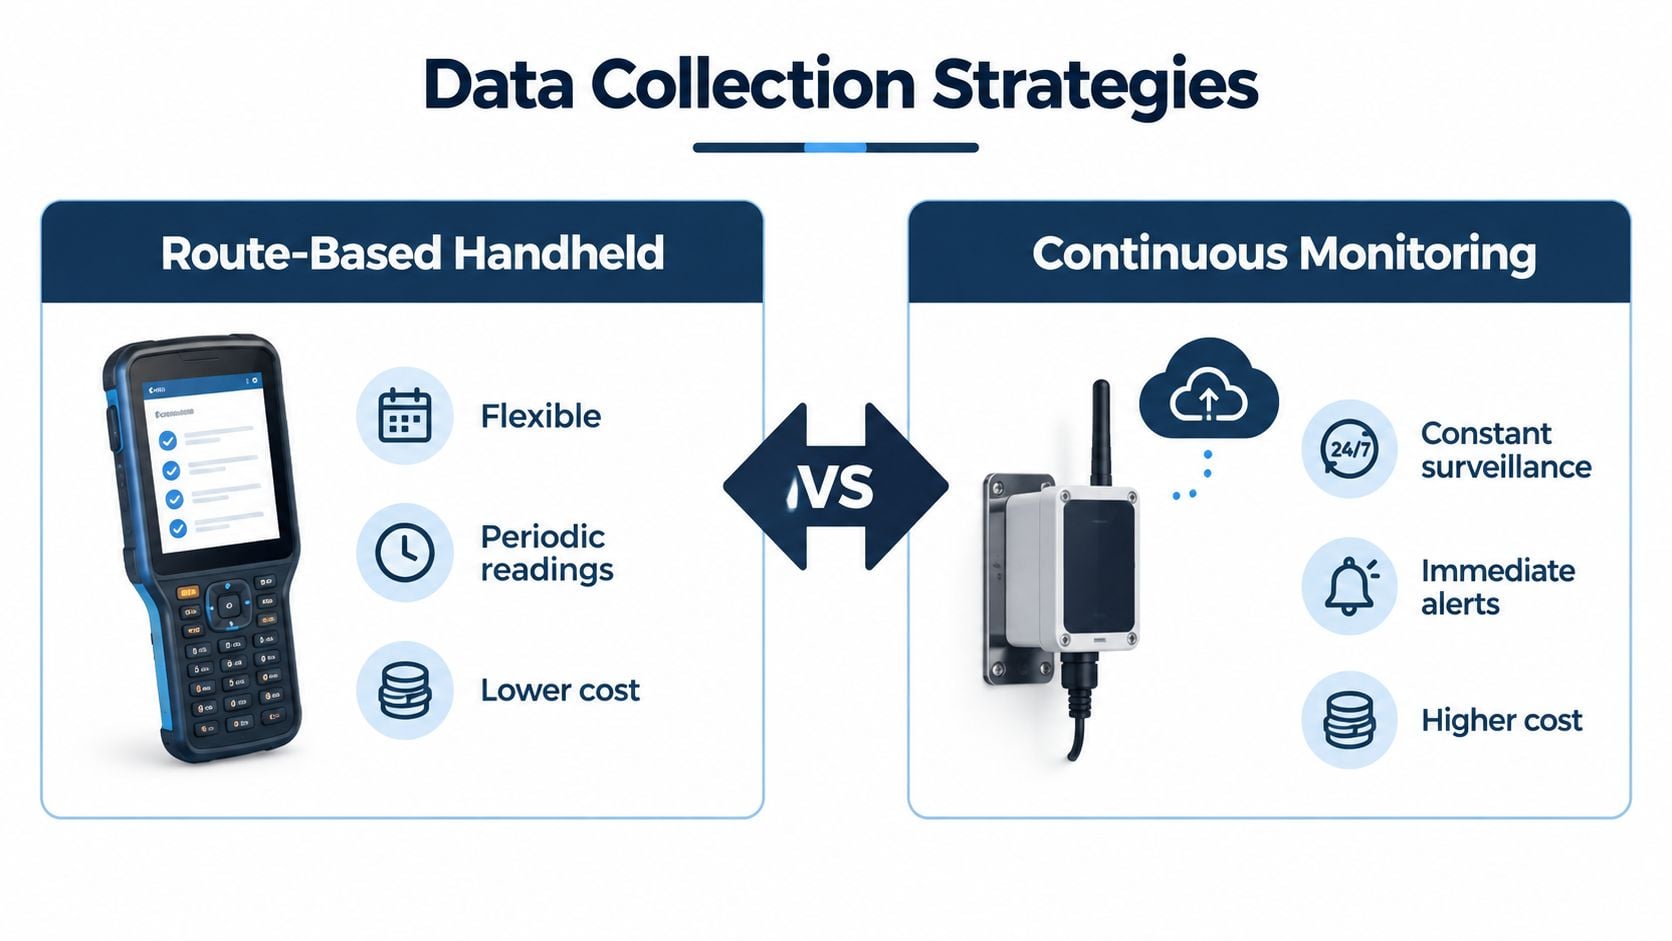
Plant leaders usually choose between route-based handheld collection and continuous online monitoring. Neither method is universally correct. The choice depends on asset criticality, failure speed, access, operating variability, environmental conditions, and the cost of missing a developing fault.
Route-based collection
A technician uses a handheld collector to visit defined measurement points and capture readings under documented conditions. This approach works well for a broad population of pumps, motors, fans, and gearboxes where faults develop gradually and technicians can safely access the bearing housings.
The weakness is repeatability. A probe placed at a slightly different angle or location can change the reading. A technician may also collect data at different speeds, loads, temperatures, or process states. Permanent mounting, consistent orientation, and clear point identification reduce that variation.
Continuous monitoring
Permanently mounted accelerometers collect data without waiting for the next route. Continuous monitoring makes more sense for a critical cooling-water pump, a compressor whose failure interrupts a process train, or equipment located in a hazardous or difficult-to-access area. It can also help variable-speed assets because the system can associate vibration with RPM and operating state.
Embedded sensing adds value when the system includes sensor health checks, stable mounting, automated alerting, and a defined response workflow. Continuous data without an owner, alarm rules, or CMMS integration only creates a larger backlog of signals.
Decision matrix
| Criterion | Route Based | Continuous Online |
|---|---|---|
| Asset criticality | Suitable for important assets with manageable failure progression | Suitable for assets where missed degradation creates major production or safety risk |
| Access | Works when technicians can reach measurement points safely | Useful where access is restricted, hazardous, or difficult |
| Speed variability | Requires careful documentation and speed normalization | Better suited to automatic RPM and operating-state correlation |
| Data repeatability | Depends heavily on mounting technique and technician consistency | Improved by permanent sensor placement |
| Coverage | Efficient for many assets with periodic review | Focused on selected high-consequence assets |
| Response | Depends on route interval and analyst review | Supports immediate exception alerts when logic is configured |
Sensor selection should match the fault being sought. Accelerometers are practical for bearing and gear impacts, velocity measurements support common machine-severity screening, and displacement or proximity measurements suit large machines where shaft motion relative to bearings matters. Sensor placement should be as close as practical to the bearing load path, with attention to mounting stiffness, cable routing, temperature, moisture, and hazardous-area requirements.
A plant team building a sensor architecture can use guidance on vibration analysis sensors to connect sensor type and placement with the intended diagnostic task. The central principle is simple: a good sensor in the wrong location still produces a poor maintenance decision.
From Spectrum to Work Order Analysis Workflows and Alarm Logic
A vibration program creates value only when a signal leads to a controlled action. The workflow should begin before data collection, with asset criticality, target failure modes, machine speed, sensor location, and the consequence of failure documented.
Build the analysis chain
A practical workflow follows this sequence:
- Define the machine state. Record RPM, load, temperature, process condition, and whether the asset is starting, stopping, or operating steadily.
- Acquire repeatable data. Use the correct sensor, mounting method, frequency range, sample length, and sampling rate for the suspected failure mode.
- Process the signal. Apply FFT analysis for frequency content. Use bandpass filtering and envelope analysis when early bearing impacts are hidden by broadband vibration.
- Screen statistical indicators. Crest factor compares peak amplitude with overall RMS, while kurtosis describes the sharpness of the signal distribution. One rolling-bearing study used a crest factor threshold of 7.49 and a kurtosis threshold of 4.11 to flag defective bearings. Rolling-bearing screening study
- Compare against severity and trend rules. Overall RMS velocity provides a fast condition screen, while spectrum and envelope trends identify the likely failure mode.
- Create the work order. State the suspected fault, evidence, risk, recommended inspection, required parts, and decision deadline.
Use ISO severity as a screen
For medium machines on rigid supports, ISO 20816/10816 severity commonly uses overall RMS vibration velocity. The long-term operation boundary associated with upper Zone B is 2.8 mm/s RMS, values from 2.8 to 4.5 mm/s RMS indicate deteriorating or unsatisfactory condition, and values above 4.5 mm/s RMS fall into a damage zone where corrective action should be prioritized. ISO 10816-3 sample standard
A broader zone framework describes values below 1.4 mm/s RMS as newly commissioned or very good, 1.4 to 2.8 mm/s RMS as acceptable for long-term operation, 2.8 to 4.5 mm/s RMS as requiring investigation and planned corrective maintenance, and values above 4.5 mm/s RMS as a damage zone. ISO vibration-severity zone guidance
ISO 10816-3 covers machine sets above 15 kW operating between 120 and 15,000 r/min, including steam-turbine or electrically driven equipment used in process plants. ISO 10816-3 application scope
Overall RMS answers, “How severe is the broadband vibration?” The spectrum answers, “What is creating it?”
Alarm logic should combine both. A rising RMS trend can trigger review, but a growing BPFO or BPFI trend may justify action even while overall vibration remains below a broad severity boundary. For VFD-driven motors, RPM tracking and operating-state detection prevent false alarms caused by normal speed changes. Temperature compensation can also separate a true mechanical trend from a process or ambient effect.
The CMMS should store the waveform, spectrum, operating conditions, analyst diagnosis, and completed repair. Teams improving the connection between condition data and execution can review resources on maximizing efficiency with asset management. FMEA, RCM, and criticality ranking then determine whether an alert becomes an immediate work order, a planned inspection, or continued observation.
Proving Value KPIs ROI and Industry Application Notes
Plant leaders should measure the program by the decisions it improves, not by the number of sensors installed. A useful dashboard links vibration findings to equipment outcomes and maintenance behavior.
Core measures include:
- Unplanned downtime: Track hours associated with rotating-equipment failures and whether vibration findings enabled planned intervention.
- MTBF: Monitor mean time between failures for pumps, motors, compressors, and gearboxes after root causes are corrected.
- Alarm-to-action time: Measure the time between a validated alarm and an approved maintenance response.
- OEE impact: Connect availability losses and production interruptions to the monitored assets.
- Repeat failure rate: Check whether the same misalignment, looseness, lubrication, or bearing problem returns after repair.
A manufacturing plant may use route monitoring on production-line motors and continuous sensing on a critical compressor. A chemical processor may prioritize pumps whose failure interrupts a batch. A power-generation site may focus on turbines, generator auxiliaries, and cooling fans. Water and wastewater facilities often need a practical balance between wide pump coverage and continuous monitoring for assets that cannot fail without affecting service.
The technical performance of modern vibration analytics can be meaningful when signal processing and model design are appropriate. One recent industrial fault-diagnosis study reported a macro-average F1-score of approximately 0.80, with the strongest class performance reaching 87.5%. Another IoT-based study reported average results with a standard deviation below 2.5%, indicating stable behavior across runs. Recent industrial vibration fault-diagnosis research
Those results don't remove the need for engineering judgment. Early bearing damage may remain weak in vibration, especially when lubrication film breakdown or microscopic surface defects haven't created a strong mechanical response. Vibration-only programs can also struggle with electrical faults, some VFD-related behavior, leaks, and process conditions. Ultrasound, thermography, oil analysis, motor current signature analysis, and process data can close those gaps.
Decision principle: Vibration is strongest as a decision layer inside a broader condition-monitoring stack, not as the entire predictive-maintenance strategy.
A maintenance manager standardizing inspections can pair the vibration workflow with a practical resource to extend tool life with this template. For manufacturing teams, a structured predictive maintenance program for manufacturing can connect failure modes, sensor data, planning, and production priorities.
Next Steps and Your Free Reliability Assessment
A reliable vibration program starts with the asset, not the sensor. The team identifies critical pumps, motors, compressors, gearboxes, and fans, defines the failure modes that matter, establishes a baseline under known operating conditions, and selects route-based or continuous monitoring according to consequence and access.
The analysis path should remain disciplined. The waveform shows the event pattern. FFT reveals frequency content. Envelope analysis exposes early bearing impacts. RMS severity provides a screening framework, while defect-frequency trends, phase, RPM, temperature, and process state support diagnosis. The CMMS then records the evidence and assigns a maintenance response with the right priority.
Alarm limits must be calibrated to machine class, support stiffness, speed range, and duty cycle. A generic threshold can produce nuisance alerts on one asset and miss meaningful degradation on another. The right program also identifies when vibration should be paired with ultrasound, thermography, oil analysis, motor current analysis, or process monitoring.
Forge Reliability provides predictive maintenance and condition-monitoring programs that combine vibration analysis with complementary technologies, criticality ranking, FMEA, RCM, and CMMS-focused execution. A free reliability assessment can review the plant's critical assets, existing data, sensor coverage, alarm logic, and the maintenance actions needed to reduce unplanned downtime and extend equipment life. The assessment includes a 24-hour response, giving reliability engineers, maintenance managers, and operations leaders a practical starting point for prioritization.
Forge Reliability can evaluate the vibration signals, failure modes, alarm limits, and work-order workflows across the plant's rotating assets. Visit Forge Reliability to request a free reliability assessment and turn predictive maintenance vibration analysis into planned, measurable maintenance action.