
Weibull analysis is a statistical method for modeling time-to-failure data with shape, scale, and location parameters to diagnose failure modes and improve replacement decisions. The scale parameter marks the characteristic life, when approximately 63.2% of the population has failed, while beta values below 1, equal to 1, or above 1 indicate decreasing, constant, or increasing failure rates.
A maintenance manager usually encounters Weibull analysis after the same pump, motor, or gearbox has failed often enough to attract attention, but not consistently enough to make the cause obvious. The CMMS contains work orders, removed components, operating hours, and inspection notes, yet the records may use different failure descriptions for the same problem. A clean textbook curve is easy to fit. A defensible plant decision requires much more discipline.
Table of Contents
- Why Weibull Analysis Matters for Plant Reliability
- Understanding Weibull Parameters and Failure Patterns
- Fitting Life Data and Handling Censored Records
- Reading Weibull Plots and Interpreting Results
- Applying Weibull Analysis to RCM and Capital Planning
- Modern Approaches – Hybrid Models and Condition Monitoring
- Getting Started with Weibull Analysis Tools
Why Weibull Analysis Matters for Plant Reliability
A production line stops after a centrifugal pump trips on high vibration. The crew replaces the bearing, aligns the motor, and returns the pump to service. Months later, the seal leaks. Later still, another bearing fails after a lubrication issue. A simple count of pump failures treats all these events as equivalent, even though they may represent unrelated mechanisms and require different maintenance responses.
Weibull analysis turns those failure times into a reliability diagnosis. It helps a reliability engineer determine whether a population is experiencing early-life defects, random failures, or age-related deterioration. The method doesn't merely estimate when the next component might fail. It connects the observed failure pattern to decisions about commissioning quality, root-cause elimination, inspection, condition monitoring, and replacement.
The underlying model is flexible because the shape parameter changes the behavior of the failure rate. Beta below 1 indicates a decreasing failure rate, commonly associated with infant mortality from defects, installation errors, commissioning problems, or inadequate repairs. Beta equal to 1 represents a constant failure rate, while beta above 1 indicates an increasing rate consistent with wear-out mechanisms such as fatigue, corrosion, erosion, insulation degradation, or bearing damage. NIST describes Weibull as a flexible reliability model because it can represent these distinct behaviors rather than assuming failures occur at a constant rate.

From failure counts to maintenance choices
Suppose a pump population shows a decreasing failure rate shortly after overhaul. The immediate response shouldn't be to shorten the replacement interval. The stronger response is to investigate assembly quality, shaft alignment, seal installation, lubrication, and commissioning procedures. Replacing parts earlier may conceal the problem without removing its cause.
A population with an increasing failure rate supports a different strategy. The team can compare an age-based replacement task with inspection or condition monitoring, then weigh the consequences of an in-service failure against the cost of intervention. Low-consequence items may still remain run-to-failure, even when their data reveals a pattern, because statistical insight doesn't automatically justify a preventive task.
Practical rule: Weibull analysis should explain why an asset fails before it dictates when the asset is replaced.
The method becomes most useful when it sits inside a broader operation and maintenance program. Failure coding, root-cause analysis, inspection quality, and planner discipline determine whether the fitted distribution reflects equipment behavior or merely reflects inconsistent records.
Waloddi Weibull's 1951 paper, “A Statistical Distribution Function of Wide Applicability,” established the technique as a broadly recognized reliability method. The paper included examples involving yield strength, size distributions, and fatigue life, demonstrating that the approach was not restricted to one equipment class or one failure mechanism. The historical account of Weibull's work reinforces the practical lesson: life, strength, and failure data can all vary statistically, but the analysis only becomes valuable when engineers connect that variation to action.
Understanding Weibull Parameters and Failure Patterns
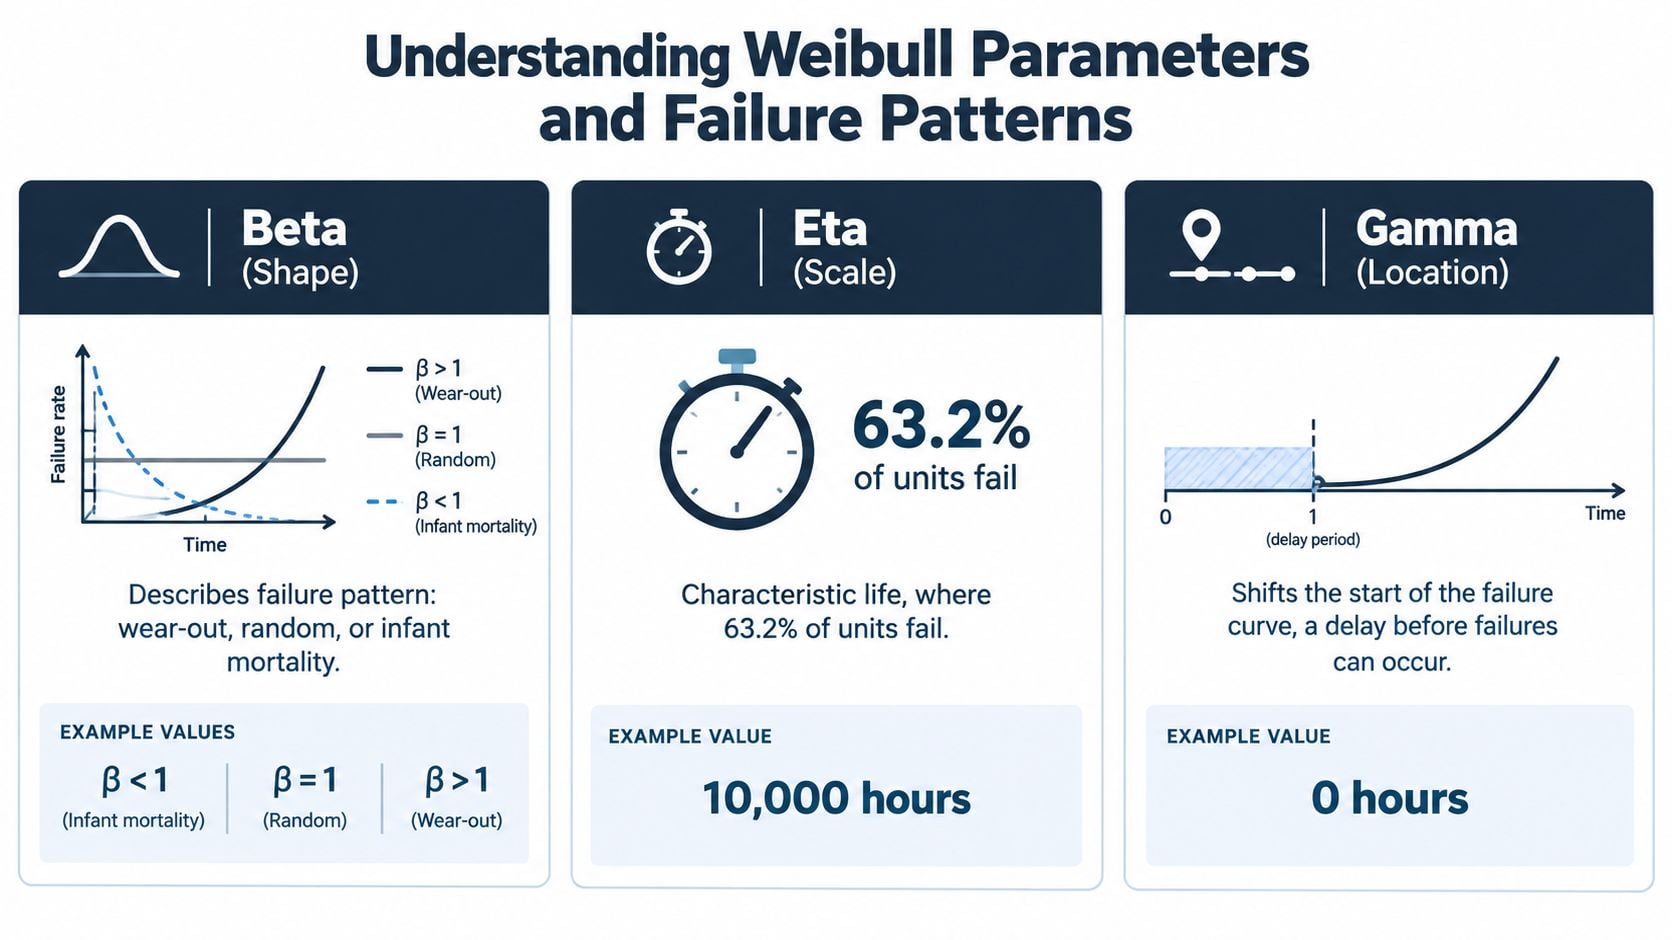
A Weibull model is easiest to use when each parameter has a physical interpretation. The shape parameter beta describes the failure pattern. The scale parameter eta establishes the time scale. The location parameter gamma shifts the beginning of the distribution when failures cannot occur before a particular point.
Beta reveals the dominant failure behavior
Beta is the parameter that usually deserves the first engineering discussion. It doesn't identify the exact root cause by itself, but it tells the team what kind of investigation makes sense.
- Beta below 1: Failures become less frequent with age. Investigate manufacturing defects, incorrect installation, commissioning errors, contamination, or poor repairs.
- Beta equal to 1: Failures occur at a constant rate, and the Weibull model becomes the exponential distribution. External events, random overstress, or unrelated causes may dominate.
- Beta above 1: Failures become more frequent with age. Examine fatigue, corrosion, erosion, insulation degradation, bearing damage, and other wear-out mechanisms.
Eta establishes characteristic life
Eta is the characteristic life, not a guaranteed replacement point. By definition, approximately 63.2% of the population has failed by eta, regardless of the beta value. That makes eta useful for comparing populations, but it must always be read alongside beta.
The same characteristic life can describe very different operational risks. A population with early-life failures needs defect elimination, while a population with an increasing failure rate may justify targeted replacement or condition monitoring. Eta supplies the scale, but beta supplies the diagnostic meaning.
Gamma is useful when the failure process has a meaningful delay. For example, a component may not be physically capable of failing from a particular mechanism until it has accumulated some operating exposure. A three-parameter fit can represent that nonzero origin, but gamma shouldn't be added just to improve a curve visually. The engineering team needs evidence that the delay reflects the asset or failure physics.
Translating parameters into maintenance action
| Beta Value | Failure Pattern | Likely Cause | Maintenance Strategy |
|---|---|---|---|
| Below 1 | Decreasing failure rate | Defects, installation errors, commissioning problems, inadequate repairs | Improve quality control, installation, testing, and root-cause elimination |
| Equal to 1 | Constant failure rate | Random events or unrelated external causes | Consider run-to-failure, functional checks, or targeted protection |
| Above 1 | Increasing failure rate | Fatigue, corrosion, erosion, insulation degradation, or bearing damage | Use condition monitoring, age-based replacement, or a validated preventive task |
The table is a decision aid, not a substitute for failure analysis. A pump population may show beta above 1 only because several wear mechanisms have been combined. If seal leakage, bearing fatigue, cavitation, and misalignment are coded together, the fitted pattern may describe no actual physical population.
For teams building a practical interpretation guide, the equipment failure patterns and maintenance curves resource provides useful context. The central discipline remains simple: segment the data by failure mode before assigning a maintenance strategy.
Fitting Life Data and Handling Censored Records
The hardest part of Weibull analysis usually occurs before the software opens. A CMMS may show a pump removed at a certain date, but that doesn't prove the pump failed at that time. It may have been removed for an inspection, a project, a process change, or a planned overhaul. Treating every removal as a failure distorts the population.
Start with the population definition
A defensible analysis begins by defining which assets belong together. “All process pumps” is rarely specific enough. A stronger population might be identical centrifugal pumps operating in the same service, with comparable speed, fluid, seal arrangement, and duty cycle.
Then establish the time origin. The clock might begin at new installation, overhaul, bearing replacement, commissioning, or entry into a particular operating regime. Mixing these origins creates artificial variation in life. Unknown asset age must be recorded as unknown rather than treated as zero.
Failure-mode coding comes next. A useful code should distinguish the failed component and the physical mechanism, such as bearing fatigue, seal leakage, cavitation erosion, shaft misalignment, or lubrication contamination. “Pump failed” is an event description, not a failure mode.
Use suspensions instead of discarding survivors
A censored record, often called a suspended record in reliability work, represents an asset that has not failed during the observation period or was removed for a reason other than the failure under analysis. Its operating time still contains information. A pump that has run through the analysis date without a bearing failure tells the model that the bearing survived at least that long.
Right-censored records are common in field populations. A unit may still be operating, may have left the plant, or may have been replaced during a capital project while its target component remained healthy. The analysis should preserve the last known operating time and the record status.
The CMMS data used for MTBF calculations should be governed with the same care. Mean time between failure and Weibull life analysis answer different questions, but both depend on accurate event dates, operating exposure, repair classification, and consistent treatment of suspended assets.
Fit separate populations before combining them
For a fleet of identical-looking centrifugal pumps, the first pass might separate bearing failures, seal failures, and process-induced failures. A bearing population can then be assessed for fatigue and lubrication effects, while seal records can be examined for installation quality, dry running, pressure excursions, or chemical compatibility.
If the data set is small, the analysis isn't automatically useless. It may still provide directional evidence, but uncertainty and decision consequences must be visible. A weak fit with broad uncertainty shouldn't be used to justify an irreversible capital decision without corroborating inspection, operating, and failure-analysis evidence.
The MIT Weibull handbook identifies censored data, missing early-life information, nonzero time origins, unknown ages, unidentified failed units, and mixed failure modes as core practical problems. These aren't unusual exceptions. They are normal plant-floor conditions that determine whether the result deserves engineering trust.
Reading Weibull Plots and Interpreting Results
A Weibull probability plot is useful because a single Weibull population tends to form an approximately straight line. The slope represents beta, so a shallow downward or upward pattern must be interpreted according to the plot convention used by the software. Engineers should verify the axis labels and transformation before drawing conclusions from the angle alone.
Consider a chemical processing facility with several centrifugal pumps serving similar duties. The reliability engineer extracts bearing-related work orders, verifies operating exposure, marks still-running pumps as suspended, and plots the records. The first visual question isn't “What replacement interval does this produce?” It is “Do these records behave like one population?”
Look for curvature and changes in slope
A straight trend supports a single dominant failure behavior, subject to goodness-of-fit and uncertainty checks. A curve, dog-leg, or abrupt change in slope suggests mixed populations, a changing failure mechanism, or a data problem. For the pump fleet, an early cluster of failures might reflect poor installation or contaminated grease, while later failures could reflect rolling-contact fatigue.
Outliers deserve investigation rather than automatic deletion. A bearing that failed shortly after a process upset may be a valid event from a different mechanism. A failure recorded before the asset was installed may indicate a CMMS date error. A unit with an impossible operating duration may have been transferred between equipment records.

A practical interpretation sequence
- Verify the records. Confirm the asset identity, installation or overhaul date, operating hours, failure mode, and whether the event was a true functional failure.
- Review the plot shape. Check for a broadly linear population, curvature, clusters, or isolated points.
- Compare the pattern with physical evidence. Bearing raceway damage, fluting, lubricant degradation, and shaft alignment measurements should support or challenge the statistical interpretation.
- Test alternative segmentations. Compare all bearing records with subsets divided by pump train, service, lubrication practice, or failure mechanism.
- Report uncertainty. A parameter estimate without confidence information can create false precision, particularly when the number of confirmed failures is limited.
A bearing population with an increasing failure rate may support an age-based intervention, but that doesn't prove every bearing should be replaced on the same calendar schedule. If vibration monitoring identifies one pump with accelerating defect energy, that asset needs an individual decision even when the population plot suggests a later intervention point.
Applying Weibull Analysis to RCM and Capital Planning
Reliability-centered maintenance works best when the maintenance task matches the failure consequence and the failure behavior. Weibull analysis contributes evidence about the behavior, but it doesn't decide the task in isolation. The RCM process still asks whether the failure is detectable, whether a condition-directed task is technically feasible, and what happens if the function is lost.
Match the pattern to the consequence
A high-consequence gearbox failure with increasing age-related risk deserves a different treatment from a low-cost guard fan that can be replaced during a routine repair. For the gearbox, the team might combine oil debris analysis, vibration trending, inspection findings, and a population life model. For the fan, run-to-failure may remain the rational choice if the failure has no safety or production consequence.
A beta below 1 points planners toward defect elimination rather than routine replacement. Repeated early failures after pump overhaul may justify a torque-control standard, alignment verification, flush-plan inspection, or commissioning hold point. A calendar replacement task would spend labor on symptoms while leaving the installation error intact.
The replacement interval is a decision under uncertainty, not a number revealed by the Weibull plot.
Support capital decisions with segmented evidence
Capital planning often fails when leaders receive a single failure count without knowing which mechanisms drive it. A segmented Weibull analysis can show that a pump's seal failures arise from service conditions while its bearings show a separate age-related pattern. That distinction affects whether the plant needs a seal-system redesign, a process change, a monitoring program, or additional spare equipment.
The analysis can also help prioritize assets for engineering review. Populations with increasing failure rates and severe consequences deserve earlier attention than populations with random, low-consequence events. The result may be a replacement project, a redesign, a duty reduction, or a monitoring investment rather than a blanket replacement program.
Build the recommendation around competing risks
A single asset can face several risks at once. A compressor may experience bearing fatigue, oil contamination, seal degradation, and process-induced trips. Combining every event into one curve may produce an average result that is inappropriate for each failure mechanism.
A stronger capital and RCM review includes:
- Failure consequence: Rank safety, environmental, production, quality, and repair consequences.
- Failure mechanism: Separate degradation processes before comparing life behavior.
- Detection opportunity: Determine whether vibration, oil analysis, thermography, ultrasound, or motor current can reveal developing damage.
- Intervention economics: Compare inspection, repair, redesign, replacement, and run-to-failure without assuming that preventive work is automatically cheaper.
- Data confidence: State whether the recommendation rests on verified records, suspended units, physical inspection, or a limited sample.
The RCM maintenance framework gives the analysis a decision structure. Weibull results are most valuable when they rank actions and expose uncertainty, not when they generate a fixed interval that planners copy into every work order.
Modern Approaches – Hybrid Models and Condition Monitoring
Traditional Weibull analysis describes a population over time. Industrial assets, however, operate under changing loads, temperatures, contamination levels, speeds, and process regimes. A population average can be useful for segmentation while still being the wrong basis for deciding what to do with one deteriorating machine.
A gearbox provides a clear example. The fleet may show an age-related increase in failures, but one gearbox may develop a rapidly growing vibration signature after a lubrication problem. Waiting for the population replacement age would ignore direct evidence from the individual asset. In that case, condition monitoring should override the calendar expectation.
Compare the decision roles
| Approach | Best use | Main strength | Main limitation |
|---|---|---|---|
| Population Weibull analysis | Segmenting assets and identifying broad failure behavior | Shows whether failure risk decreases, stays constant, or increases with age | Doesn't describe every asset under changing conditions |
| Condition monitoring | Detecting degradation in an individual asset | Uses current evidence from vibration, oil debris, thermography, ultrasound, or motor current | Requires reliable sensors, thresholds, interpretation, and response discipline |
| Covariate or hybrid model | Accounting for operating regime and observed condition together | Connects life behavior with stressors and current signals | Needs better data governance and more specialized analysis |
A covariate is an operating or environmental factor that changes risk, such as load, temperature, contamination, or duty cycle. A hybrid workflow can use Weibull analysis to divide assets by service and failure behavior, then use sensor data to prioritize individual interventions within each group.
Separate failure prediction from degradation detection
Weibull analysis estimates the behavior of failure times across a population. It doesn't necessarily identify the current health state of a particular bearing. Condition monitoring detects evidence of deterioration, but a signal trend doesn't automatically provide a reliable failure date without a degradation model and an appropriate threshold.
Recent research reflects this distinction. A 2026 wind-turbine study combines a generalized Weibull model with neural-network predictions from SCADA data and bootstrap control charts for real-time reliability and anomaly monitoring, while noting the limited adaptability of traditional Weibull models to changing operational and environmental stressors. A 2025 study combines Weibull behavior for failure initiation with a gamma process for degradation propagation, recognizing that failure risk and measurable deterioration aren't always the same phenomenon. The research on dynamic and hybrid reliability modeling provides useful context for engineers designing these workflows.
The practical sequence is clear. Use life data to identify populations and prioritize assets. Use current condition evidence to decide whether an individual machine needs inspection, repair, derating, or replacement now.
Getting Started with Weibull Analysis Tools
A first analysis should begin with a narrow equipment question, not an enterprise-wide data project. Choose one population where the assets have a common function, the failure consequence matters, and operating exposure can be reconstructed. A fleet of process pumps with recurring bearing failures is more useful than a broad export labelled “all rotating equipment.”
Prepare the records before fitting a curve
A practical preparation checklist includes:
- Define the population: Group assets by comparable design, duty, environment, and maintenance history.
- Set the time origin: Record whether time begins at installation, overhaul, component replacement, or commissioning.
- Code the mechanism: Distinguish bearing fatigue, seal leakage, cavitation, misalignment, lubrication, electrical, and process-related events.
- Mark suspensions: Preserve assets that are still operating or were removed without the target failure.
- Validate exposure: Use operating hours, cycles, starts, throughput, or another defensible measure instead of elapsed calendar time when duty varies.
- Review the plot: Check for mixed populations, outliers, curvature, and implausible dates before accepting any parameter estimate.
Choose tools according to the decision
A spreadsheet can support initial sorting, coding, and visual checks when the population is small and the analysis is exploratory. Specialized reliability software becomes more appropriate when the team must handle censored records, multiple failure modes, confidence bounds, competing risks, or formal reporting. The tool should support the engineering question rather than encourage the team to fit every available record.
A reliability consultancy can combine CMMS data governance, root-cause classification, life-data modeling, and condition-monitoring evidence when the plant lacks the time or internal expertise to establish the workflow. The Weibull analysis software resource can help maintenance leaders evaluate the capabilities required for their implementation.
Turn the first result into a controlled decision
The first fitted distribution should produce a documented action, such as improving pump installation, separating seal and bearing populations, adding vibration routes, reviewing spare strategy, or starting a capital justification. It should also record what remains uncertain and which new data will test the conclusion.
The most valuable outcome isn't a polished probability plot. It's a maintenance program that knows which failures to prevent, which assets to monitor, which components to replace, and which records need better governance before the next analysis.
Forge Reliability offers a free reliability assessment that can review CMMS failure records, classify recurring failure modes, and connect Weibull analysis with condition-monitoring and maintenance decisions. Visit Forge Reliability to discuss a practical assessment for pumps, motors, gearboxes, compressors, or other critical plant assets.