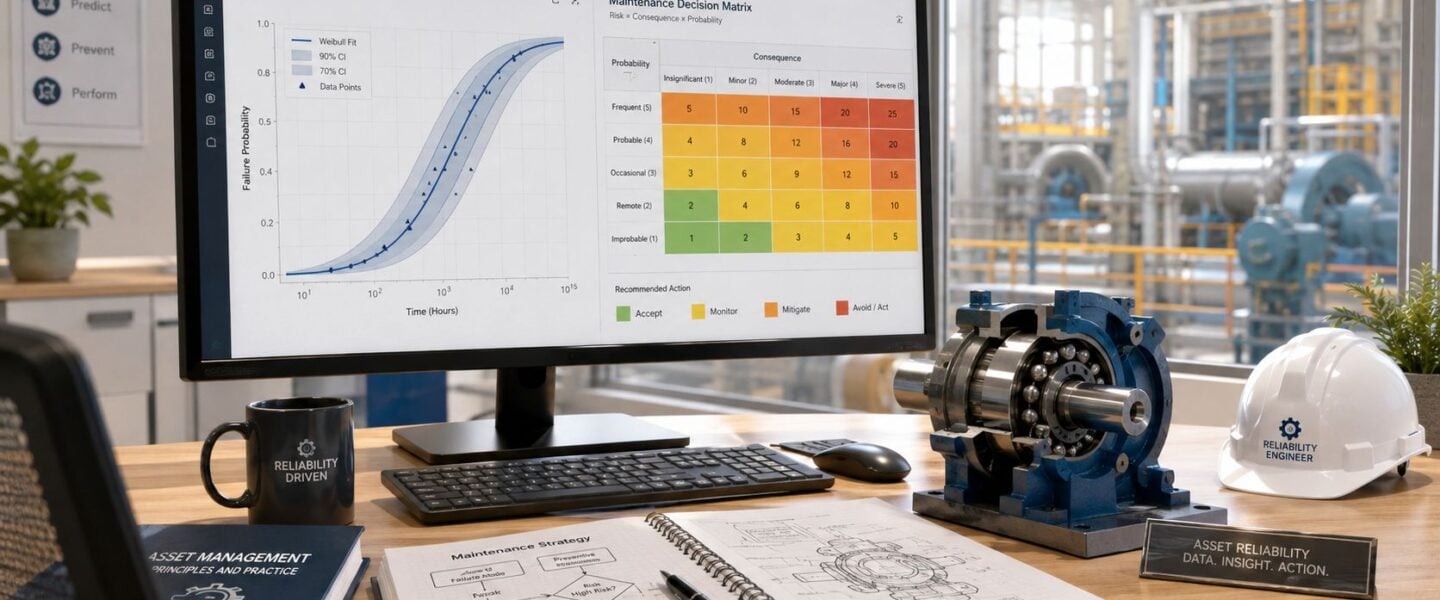
A plant manager usually starts looking for Weibull analysis software after the same meeting happens one too many times. A critical compressor trips again. A pump train keeps eating bearings. Production asks for a firmer replacement interval. Finance asks why another overhaul is needed. Maintenance history exists, but it lives in work orders, operator notes, spreadsheets, and PLC runtime tags that don't line up cleanly.
That's where most software evaluations go wrong. Teams buy a package based on plots and dashboards, then discover the actual problem isn't drawing a Weibull curve. It's turning messy plant data into a defensible maintenance decision. Good Weibull analysis software doesn't just calculate parameters. It helps reliability teams sort suspensions, separate mixed failure modes, and decide whether a PM interval should be tightened, extended, or replaced with condition-based work.
The table below gives a practical short list of what matters first.
| Selection factor | What to look for | Industrial example |
|---|---|---|
| Data handling | Imports from CMMS exports, runtime logs, and manual inspection data | Chemical pump seal failures with work order comments and run-hour gaps |
| Censoring support | Right censored, left censored, and interval data entry | Steam turbine auxiliaries still operating at the end of the review period |
| Parameter fitting | Multiple fitting methods and goodness-of-fit checks | Gearbox failures with a small failure population |
| Decision outputs | Reliability at time, mean life, expected failures, confidence bounds | VFD fan replacement planning across a plant fleet |
| Workflow fit | Reporting that supports FMEA, RCA, and maintenance planning | Conveyor motor failures feeding a criticality review |
| Usability | Clear plots and low friction for engineers who aren't statisticians | Food plant maintenance planners reviewing pump bearing history |
Table of Contents
- Why Your Failure Data Demands a Better Tool
- Decoding Core Software Capabilities
- Integrating Real-World Plant Data
- Commercial vs Open-Source Software
- Example Workflow Analyzing Pump Bearing Failures
- Future-Proofing Your Analysis with Advanced Methods
- Your Decision Matrix and Implementation Checklist
Why Your Failure Data Demands a Better Tool
A maintenance manager trying to justify a strategy change on a large displacement compressor rarely has perfect evidence. There are some confirmed failures, some rebuilds that happened during shutdowns, and several units still running with no end-of-life event recorded. That's enough to make a decision, but only if the software can handle reality instead of assuming textbook data.
Weibull analysis became the standard in reliability engineering for a reason. The Weibull distribution is mathematically valid for approximately 85% to 95% of all life data, and it can represent decreasing, constant, and increasing failure rate trends in one model, covering early life failures, random failures, and wear-out conditions according to ReliabilityWeb. For plant teams, that matters because compressor valves, pump bearings, and motor insulation don't all fail the same way.
Practical rule: If a plant needs one method that can support infant mortality, random events, and wear-out analysis across mixed asset classes, Weibull is usually the first place to start.
In a food plant, that might mean separating early seal failures caused by installation damage from later bearing failures driven by lubrication breakdown. In a refinery, it might mean identifying whether exchanger fan motors are failing randomly or aging into wear-out. The software needs to help the team decide which pattern they're seeing, not just print a probability plot.
Plants also need a bridge between Weibull outputs and broader reliability work. Teams building a PdM strategy often start with runtime trends, condition data, and failure history together. A useful primer on the broader benefits of predictive maintenance helps frame where Weibull fits. It isn't a replacement for vibration, oil analysis, or thermography. It's the statistical layer that turns observed failures into life-based decisions.
For teams that need a refresher on how failure behavior shifts over time, the classic equipment failure patterns and six curves framework is still useful. It keeps a plant from forcing every asset into an age-based PM when the actual pattern may be random.
Decoding Core Software Capabilities
A lot of Weibull analysis software looks similar during a demo. The differences show up when a reliability engineer tries to evaluate gearbox failures, include suspended assets, and explain the result to operations in one meeting.
What the software must calculate
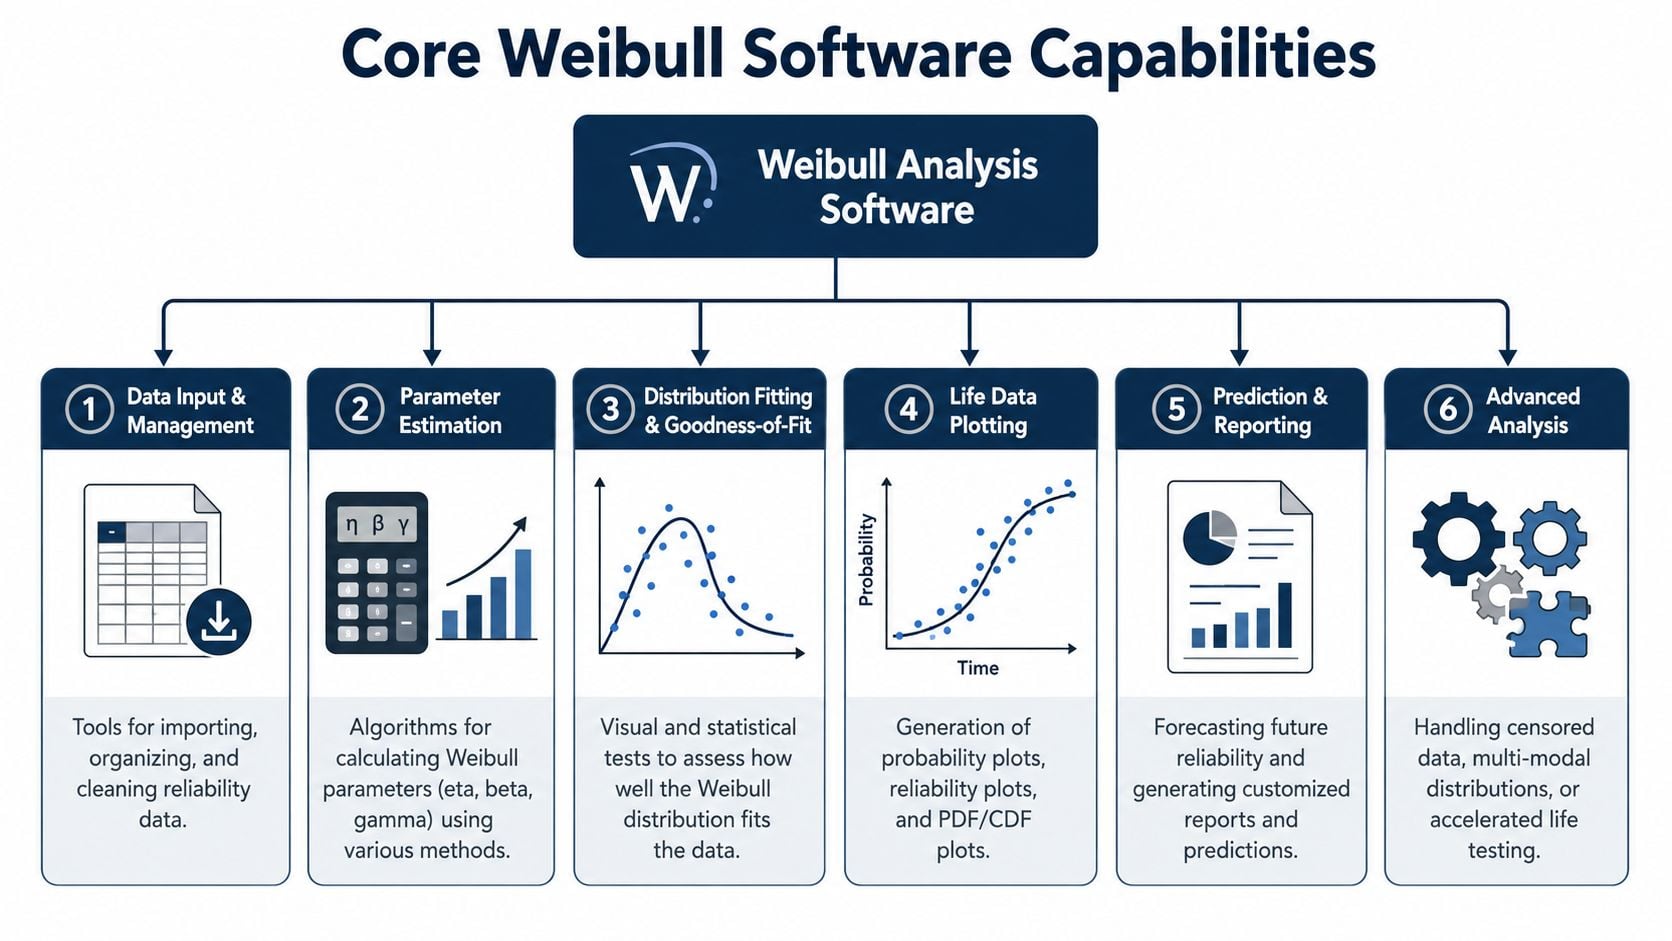
At minimum, the software should calculate the metrics that drive action. Effective software allows precise calculation of mean life (MTTF) and the number of failures expected over a period, while Characteristic Life (Eta) and Weibull Slope (Beta) provide the core inputs for FMEA and criticality ranking as outlined by Relyence.
Those terms need to mean something on the plant floor:
- Beta is the shape parameter. It helps identify failure behavior. For an industrial gearbox, a higher wear-out trend pushes teams toward age-based replacement or closer condition monitoring.
- Eta is the characteristic life. It gives a practical life reference point for planning overhaul timing on assets like pump bearings or fan sheaves.
- MTTF helps planners estimate average life for non-repairable components such as seals, sensors, or control relays.
- Expected failures over time helps spare-parts planning. A plant with a fleet of similar motors can use that output to avoid both stockouts and overbuying.
A useful complement to Weibull work is understanding how MTBF is calculated in maintenance programs. The two measures aren't interchangeable, but teams often need both when reviewing repairable assets such as conveyors and non-repairable subcomponents such as bearings.
What separates analysis from charting
Good software also needs more than one fitting method. Most plant data isn't neat, so the tool should support parameter estimation methods such as Maximum Likelihood Estimation and Rank Regression. That matters when a conveyor drive has only a handful of confirmed bearing failures, or when many units are still operating and the data set is censored.
The essential capabilities are these:
- Censored data handling: Right censored, left censored, and interval data should be built into the workflow. A steam turbine lube pump that hasn't failed yet still contributes useful life information.
- Goodness-of-fit checks: The team needs evidence that the chosen distribution is reasonable. Without that, the maintenance interval becomes a guess with a formula attached.
- Confidence bounds: These matter when extending PM intervals on assets like VFD cooling fans. The point estimate may look safe, but the risk band may say otherwise.
- Plotting options: Reliability plots, cumulative probability plots, and density views help engineers explain failure behavior to supervisors and planners.
- Small-sample usability: Plants often don't have large failure populations. The software has to stay useful when the data set is thin.
Software that only draws a curve is a graphing tool. Software that helps an engineer defend a maintenance decision is a reliability tool.
For example, in a paper mill, a dryer section gearbox may have limited historical failures but many operating units. If the software can't treat those in-service units correctly, the result will exaggerate wear-out and trigger premature replacements.
Integrating Real-World Plant Data
Most reliability teams don't have a data problem. They have a data classification problem. The CMMS contains work orders, but one technician records “seal leak,” another writes “pump changeout,” and a third closes the event under a shutdown code that has nothing to do with failure.
That's why so many Weibull studies produce misleading answers. A 2025 study by Reliability Analytics Toolkit found that 68% of industrial failure datasets contain censored data, yet most software tutorials ignore that preparation step, which leads to inaccurate reliability predictions and flawed maintenance intervals as reported by SixSigma.us. In plant terms, the software can only be right if the data entering it is tagged correctly.
Why CMMS exports mislead teams
A chemical processing pump is a good example. A maintenance planner exports work order history for mechanical seal replacements across a bank of similar pumps. The raw file may contain four different event types:
- True failure events where the seal leaked and the pump was removed.
- Suspensions where the pump left service for a process change, not because the seal failed.
- Censored records for pumps still running at the end of the observation window.
- Mixed failure modes where bearing failure and seal failure were both coded under one generic repair line.
If a suspended pump is entered as a failed pump, the software will pull the life curve left and make seals look worse than they are. That drives an overly conservative replacement interval. In a high-cycle process area, that can mean unnecessary labor, unnecessary parts consumption, and more intrusive maintenance than the asset needs.
Plant-floor lesson: Bad censoring practice usually doesn't create an obvious error. It creates a believable but wrong interval.
Teams cleaning CMMS history should also review CMMS implementation guidance for maintenance teams, especially where failure coding, asset hierarchy, and runtime capture are inconsistent.
A practical formatting standard for pump seal data
For pump seal analysis, the software input should be stripped down to a few decision-grade fields:
- Asset identifier: Keep it to one physical pump or one clearly defined interchangeable population.
- Failure mode: Use one mode per study. “Mechanical seal leakage” is usable. “Pump repair” is not.
- Start point: Installation date, last overhaul date, or accumulated run hours since reset.
- End point: Failure date, suspension date, or current age at study close.
- Event type flag: Failed, suspended, or still operating.
- Operating context: Optional, but useful if flush plan, duty cycle, or process chemistry differs.
For a set of caustic transfer pumps, the software should also separate seal failures caused by dry running from those caused by abrasive contamination. They may belong to different populations. Combining them often produces a blended curve that looks statistically acceptable but isn't mechanically meaningful.
Commercial vs Open-Source Software
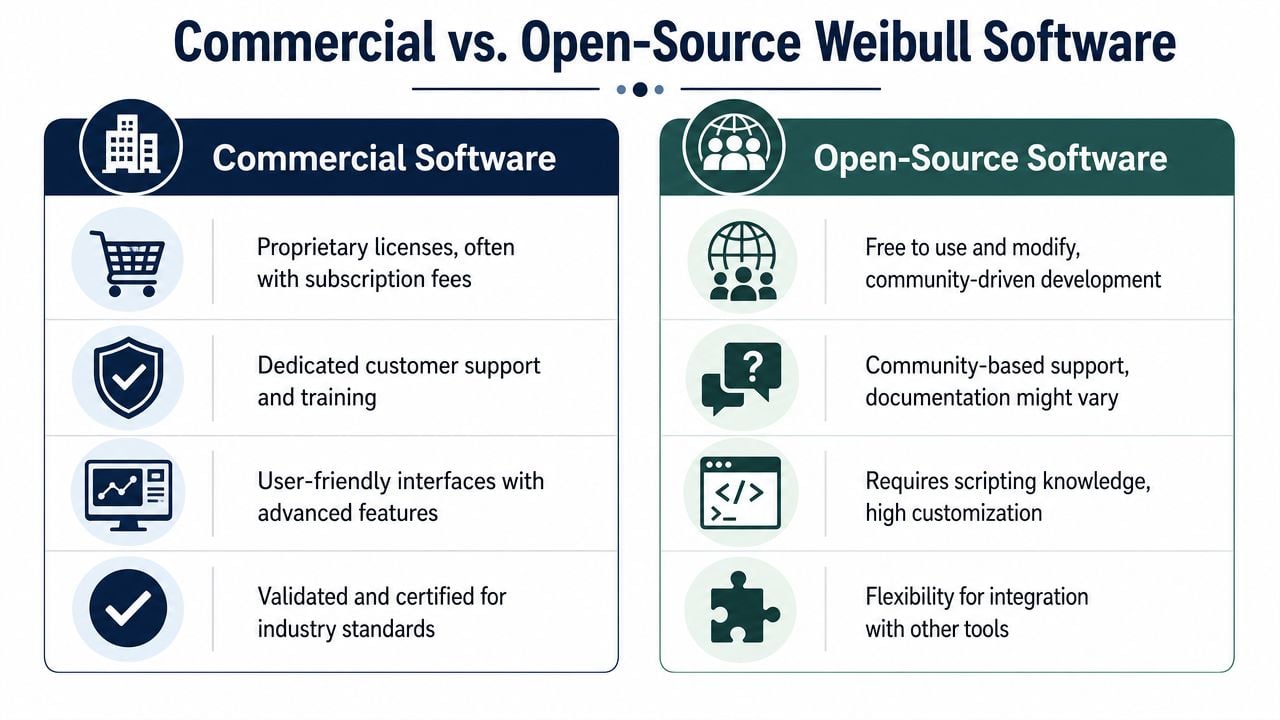
The practical decision isn't “paid versus free.” It's whether the plant needs a packaged reliability workflow or a toolkit that an engineer can assemble and maintain.
Where commercial tools earn their cost
Top-tier commercial software enables detailed life data analysis across multiple lifetime distributions and includes best-fit analysis that systematically evaluates error to choose an optimal model, a capability that takes significant statistical expertise to reproduce in open-source code according to HBK.
That matters most in high-consequence work. Consider a power generation auxiliary pump serving a steam turbine support system. The reliability engineer doesn't just need a curve. The engineer needs repeatable data handling, consistent reporting, traceable assumptions, and outputs that can be shared with maintenance, operations, and engineering leadership.
Commercial value shows up when the risk of a wrong answer is expensive.
Commercial environments usually fit best when a plant needs:
- Structured workflows: Easier onboarding for maintenance engineers who know failure modes but aren't specialists in statistics.
- Built-in plotting and reporting: Faster communication to planners, operations managers, and site leadership.
- Validation support: Better for regulated or highly scrutinized environments such as pharmaceuticals or energy.
- Connection to broader reliability tasks: Easier movement from Weibull outputs into FMEA, maintenance planning, and asset criticality reviews.
Where open-source fits best
Open-source approaches fit plants with engineering depth, scripting capability, and patience for setup. They can work very well for a metals facility analyzing roll-bearing life or a water plant reviewing motor failures across a standard fleet, especially when the team wants custom workflows and direct control over data preparation.
The trade-offs are operational, not mathematical. An open-source stack may be perfectly capable, but the plant has to own version control, documentation, internal training, and result verification. If the engineer who built the scripts leaves, the method often leaves with them.
Open-source is strongest when the plant wants flexibility and already has people who can audit the analysis, explain the assumptions, and maintain the workflow.
A useful way to decide is to ask who will run the software six months from now. If the answer is a reliability specialist with coding skill, open-source may be practical. If the answer is a planner, maintenance supervisor, or rotating equipment engineer with limited time, a more structured environment usually wins.
Example Workflow Analyzing Pump Bearing Failures
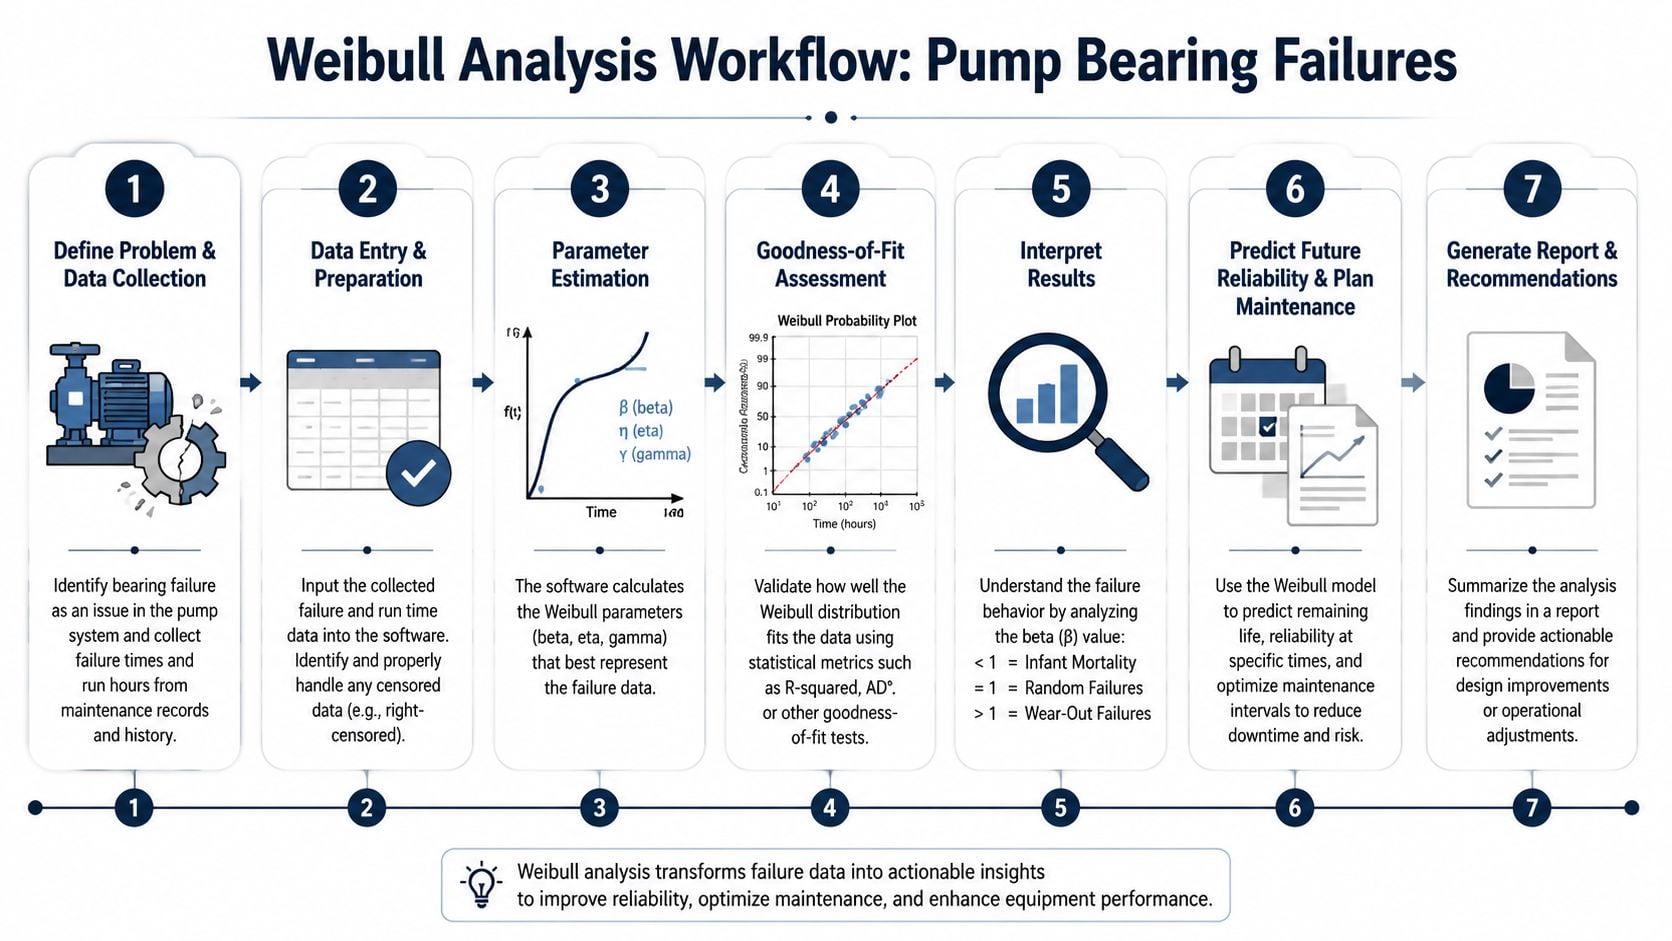
A food and beverage site with multiple centrifugal pumps often sees the same pattern. Bearings fail early on a subset of pumps serving washdown-heavy areas, while similar pumps in dry service last longer. The plant needs more than anecdotal suspicion. It needs a repeatable workflow that converts bearing history into a PM decision.
From work orders to a usable data set
The first step is narrowing the population. The team should isolate one pump family with similar duty, bearing arrangement, and maintenance practice. If the population includes pumps with different load paths, the life model loses meaning. That's why understanding radial versus axial load in rotating equipment matters when reviewing pump bearing failures. Different load conditions can produce very different failure behavior.
Then the team exports:
- bearing replacement dates,
- operating hours or estimated runtime,
- pumps still in service with no failure,
- notes indicating contamination, lubrication issues, or alignment findings.
The data should be cleaned so each record represents one bearing life. A planned motor swap that didn't follow a bearing failure should be treated as a suspension, not a failed bearing.
Turning the plot into a maintenance action
Once the data is loaded, the software fits the distribution and generates the reliability plot. The reliability engineer then checks whether the fitted behavior matches what the mechanics are seeing. If the plot suggests wear-out behavior and the failed bearings show lubricant breakdown, race damage, or contamination-related distress, the model is mechanically credible.
The output is then used in a way operations can act on:
- Set an inspection trigger: Move vibration and temperature review earlier for pumps in washdown zones.
- Adjust lubrication practice: Tighten grease selection, contamination control, and regrease discipline where water ingress is common.
- Create a replacement threshold: Use the reliability curve to define when planned replacement makes more sense than run-to-failure.
- Split the population if needed: If clean-service and washdown-service pumps behave differently, model them separately.
A conveyor system in the same plant may need a different answer. There, bearing life may be dominated by misalignment or over-tension instead of washdown contamination. The workflow stays the same, but the maintenance action changes because the physics of failure are different.
Future-Proofing Your Analysis with Advanced Methods
Traditional Weibull fitting still works well in many industrial settings. It remains the practical default for routine life data analysis, especially when failure behavior is reasonably stable and the plant has a clear definition of the failure event. But some environments push that approach hard.
Chemical processing is a good example. A reactor circulation pump may see temperature swings, changing viscosity, variable solids loading, and inconsistent start-stop behavior. That kind of variability can distort standard assumptions, even when the software produces a clean-looking curve.
When traditional estimation starts to struggle
A 2025 JMP study found that AI-based parameter estimation reduced failure prediction errors by 32% compared to traditional Maximum Likelihood Estimation for high-variability datasets, which highlights a real limitation in older fitting approaches for volatile environments according to JMP.
That doesn't mean plants should abandon MLE. It means teams should know when conventional fitting is under stress. Common warning signs include:
- Mixed operating regimes: The same asset runs under very different process conditions.
- Strong non-linearity: Failures don't track cleanly with age or runtime alone.
- Repeated refits: Small data updates cause large swings in predicted life.
- Mechanically inconsistent outputs: The plot says one thing, teardown evidence says another.
Plants using broader machine learning methods in predictive maintenance should treat advanced estimation as a supplement, not a replacement, for engineering judgment. AI can improve fit quality in volatile data sets, but it still needs sound failure definitions and clear population boundaries.
A validation checklist before changing maintenance intervals
Before using any software output to move a PM interval on assets like turbines, VFDs, or process pumps, the team should verify five things:
- The population is mechanically consistent. Don't mix assets with different failure drivers.
- Censored records are correctly flagged. Suspensions must stay suspensions.
- The fitted trend matches observed damage. A wear-out pattern should align with real wear-out evidence.
- Sensitivity has been checked. Remove questionable records and see whether the recommendation changes materially.
- Operations can execute the result. A mathematically elegant interval that the shutdown schedule can't support won't hold.
A Weibull model is useful only when the statistics and the failure physics point in the same direction.
Your Decision Matrix and Implementation Checklist
Most plants don't need the “best” Weibull analysis software in the abstract. They need the one that their team can use consistently on the assets causing real downtime. For one site, that may be compressor valves and pump seals. For another, it may be motors, gearboxes, and fan bearings spread across several production lines.
Weibull Software Decision Matrix
A simple weighted matrix keeps the decision grounded in plant needs instead of feature lists.
| Criterion | Weight (1-5) | Commercial Option A | Commercial Option B | Open-Source (Python/R) |
|---|---|---|---|---|
| Data integration from CMMS and runtime systems | 5 | |||
| Censored data handling | 5 | |||
| Ease of use for maintenance and reliability staff | 4 | |||
| Statistical transparency and validation | 5 | |||
| Reporting for FMEA, RCA, and planning | 4 | |||
| Flexibility for custom workflows | 3 | |||
| Training and support availability | 4 | |||
| Total cost of ownership | 3 | |||
| Scalability across multiple asset classes | 4 | |||
| Fit for pilot deployment speed | 4 |
This table works best when scored by a small cross-functional group. Reliability should score technical fit. Maintenance should score usability. Operations should score reporting clarity and decision usefulness. If everyone scores separately first, weak spots show up quickly.
The wrong software choice usually fails in adoption, not in math.
Implementation checklist for a plant pilot
A pilot should start with one failure problem that hurts production and has enough history to model. Pump bearings, cooling fan motors, and gearbox failures are common starting points because the failure definition is usually clear.
Use this checklist:
- Choose one asset family: Keep duty, environment, and construction reasonably consistent.
- Define one failure mode: Don't start with a broad label like “pump failure.”
- Pull all relevant records: CMMS history, runtime data, inspection notes, and current in-service units.
- Tag censored and suspended records: This step decides whether the model reflects reality.
- Review mechanical evidence: Confirm that the failure mode in the data matches what teardown or inspection found.
- Run the first model and challenge it: Ask whether the output fits plant knowledge.
- Translate the result into one action: Inspection interval, replacement threshold, spare strategy, or task redesign.
- Train the users who will repeat it: The process has to survive beyond the pilot.
- Write a standard for data entry: If technicians don't code failures consistently, the next study will degrade fast.
- Revisit after the first maintenance cycle: Compare predictions with what occurred and refine the model.
For a packaging line, that might mean selecting one conveyor drive family and redefining the lubrication route based on the output. For a chemical plant, it might mean splitting one pump population by service severity before changing seal replacement timing.
A free reliability assessment from Forge Reliability can help a plant team evaluate whether Weibull analysis software will solve the actual failure problem, prepare CMMS and runtime data for analysis, and build a practical pilot around pumps, motors, gearboxes, compressors, or other critical assets.