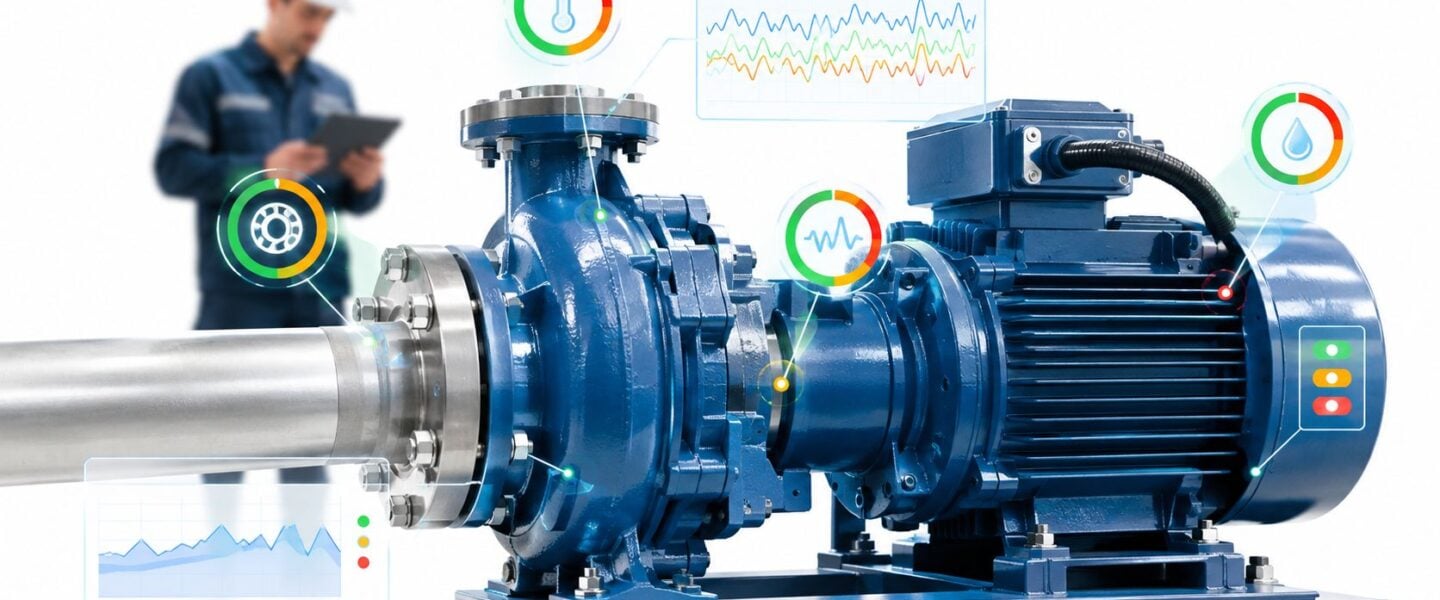
A product changeover is underway when a centrifugal pump starts to sound rough. Within minutes, the bearing locks, the transfer line stops, and operators scramble to protect the batch. The scheduled PM was completed on time, but it never addressed the failure mode that developed. The maintenance manager now has an emergency repair, a quality investigation, and a production schedule that no longer fits the shift.
That situation exposes the actual purpose of a maintenance strategy. It isn't a list of recurring tasks. It's a documented, risk-based plan that decides which assets deserve preventive work, which need condition monitoring, which can safely run to failure, and which require redesign. A sound strategy prioritizes assets, matches tasks to failure behavior, and feeds field results back into future decisions.
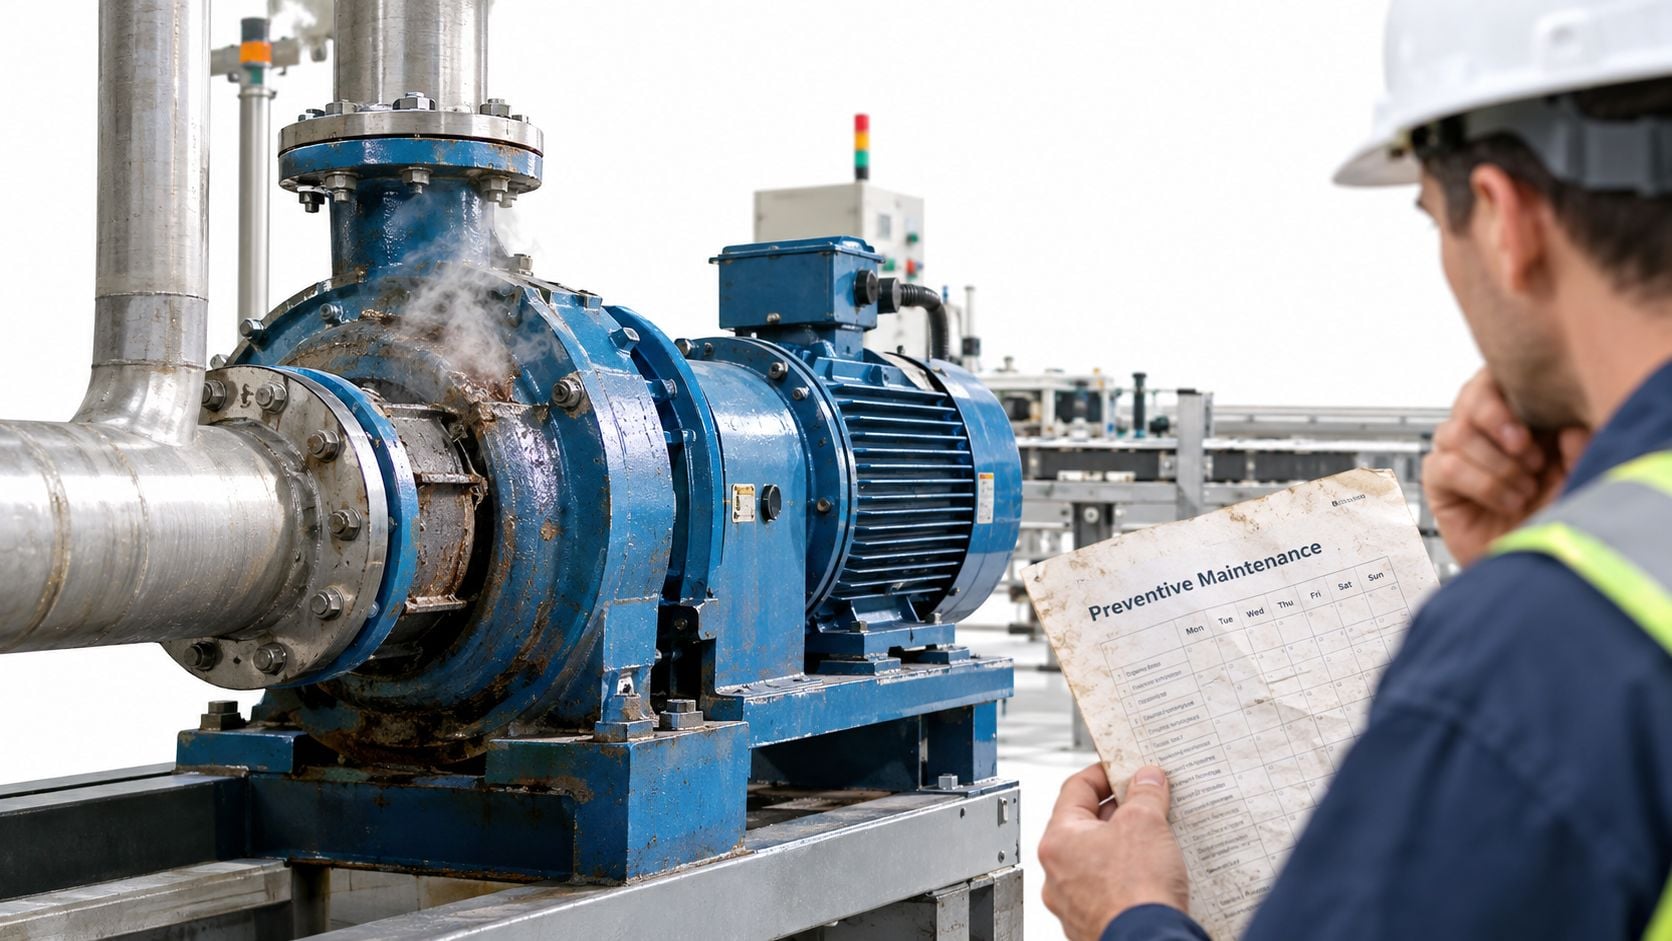
The financial and operational case is substantial. A 2021 NIST study of U.S. manufacturing maintenance estimated average annual maintenance-related costs and production losses of $222.0 billion across the sector. Establishments relying more heavily on preventive and predictive work experienced 52.7% less unplanned downtime and 78.5% fewer defects than the more reactive half of plants.
Table of Contents
- The Moment a Pump Seizes and Why Strategy Matters
- The Four Maintenance Strategy Types Compared
- Criticality Ranking and FMEA as the Decision Lens
- Matching Condition Monitoring Techniques to Failure Modes
- The Closed Loop from Alarm to Corrective Action
- A Compressed Air Compressor Example and the Labor Reality
- Putting the Maintenance Strategy into Practice
The Moment a Pump Seizes and Why Strategy Matters
A maintenance strategy begins with the asset, not the technology. The first question is whether a failure can threaten people, the environment, production, quality, or the plant's ability to recover. A product-transfer pump in a food facility may not present the same safety exposure as a chemical-process pump, but either can create serious consequences if its failure contaminates product, interrupts a batch, or damages connected equipment.
The strategy then assigns an intervention style. Preventive maintenance uses a calendar, operating-hour, or production-cycle trigger. Predictive maintenance uses measured condition, such as vibration, temperature, lubrication debris, or electrical signatures. Run-to-failure is appropriate where replacement is simple and consequences are acceptable. Corrective work remains necessary, but a mature program controls where and how it occurs instead of allowing emergency work to dominate.
Practical rule: A maintenance task earns its place when it controls a defined failure mode or consequence. “Because the manufacturer recommends it” isn't enough.
Three decisions should appear in every asset strategy:
Prioritize the exposure. Rank assets by safety, environmental, production, quality, repair lead time, and redundancy. A bottleneck compressor with no standby capacity needs a different plan from a small, interchangeable conveyor motor.
Choose the intervention. Match the task to the failure behavior. Use lubrication control for contamination-driven bearing damage, scheduled restoration where age-related wear is credible, condition monitoring where degradation is detectable, and redesign where the same failure keeps returning.
Close the feedback loop. A completed work order should record what failed, why it failed, what was found, and whether the task worked. Without that information, the plant repeats assumptions and keeps weak PMs on the schedule.
The seized pump is therefore not just a repair event. It's evidence that the existing plan didn't connect failure mode, consequence, task selection, and field feedback. A useful maintenance strategy turns that event into a better decision for the next pump.
The Four Maintenance Strategy Types Compared
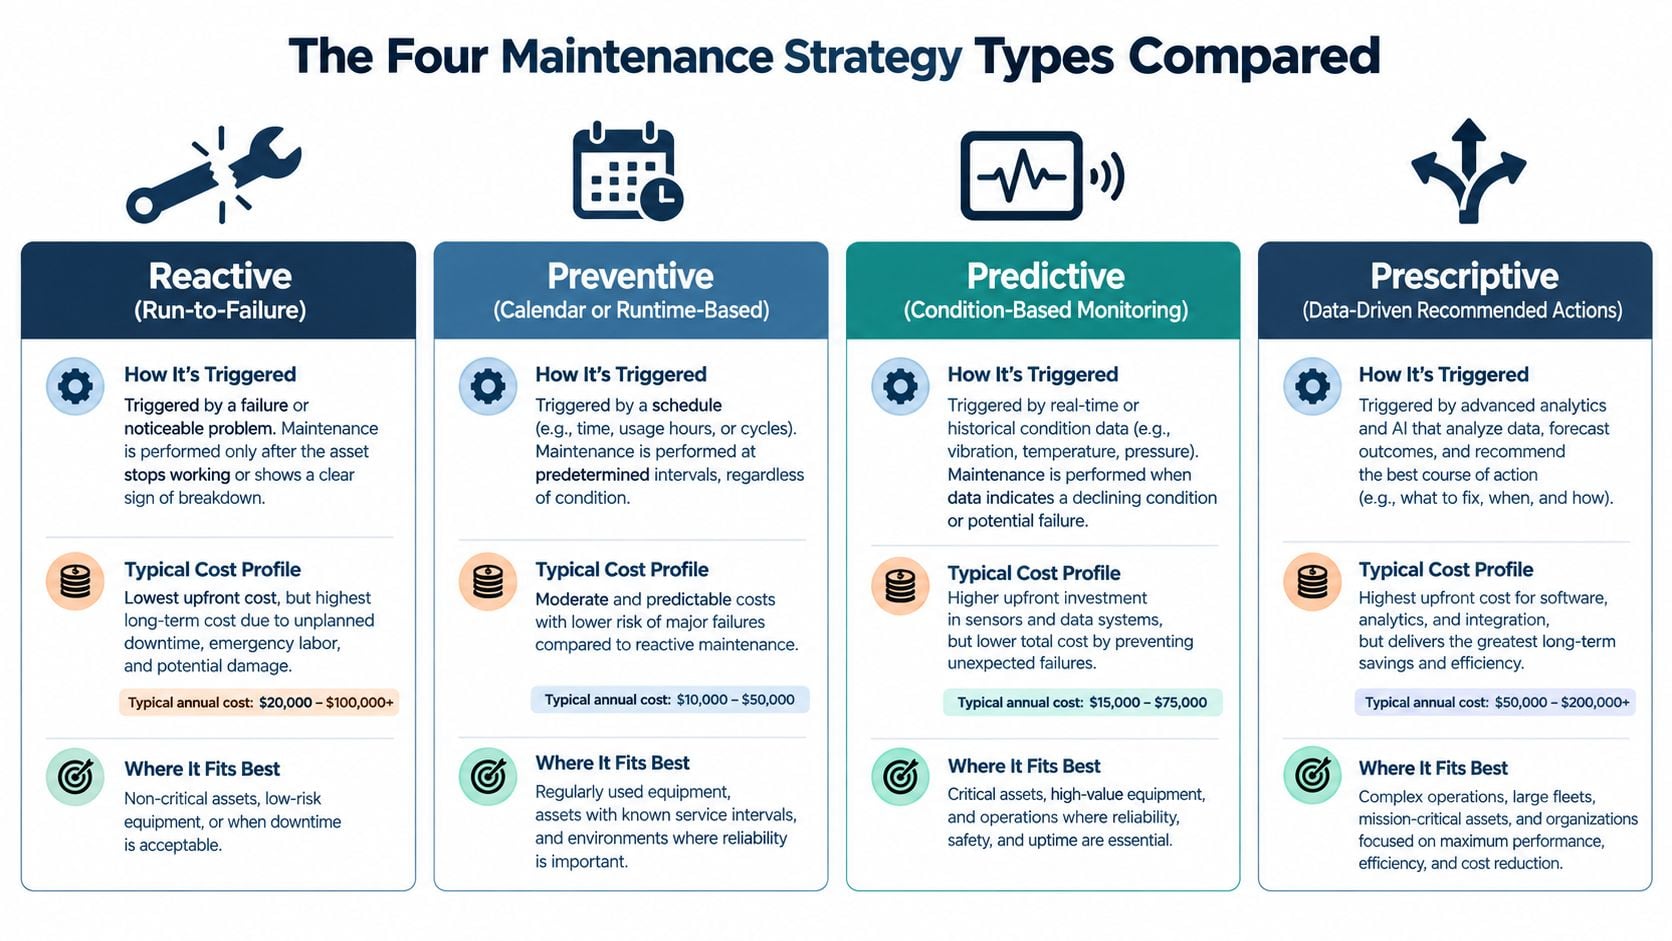
Industrial plants rarely use one maintenance strategy exclusively. They combine reactive, preventive, predictive, and prescriptive approaches across different asset classes. The mistake is treating one method as universally superior.
Reactive maintenance, often called run-to-failure, allows equipment to operate until functional failure. It fits low-consequence assets that are inexpensive, redundant, easy to replace, or difficult to monitor meaningfully. It doesn't fit a single process pump that can stop an entire production train. The hidden exposure includes emergency labor, rushed diagnosis, secondary damage, and production disruption.
Preventive maintenance schedules inspection, lubrication, replacement, or overhaul by time, runtime, cycles, or another usage measure. It works well when degradation is predictable or a known age-related failure exists. It also creates waste when teams replace healthy components because a calendar date arrived, or when the interval has no relationship to the actual failure pattern.
Predictive maintenance uses condition data to decide when intervention is justified. Vibration analysis can identify bearing or gear degradation, thermography can reveal abnormal heat, and oil analysis can expose wear or contamination. Predictive work requires more than sensors. It needs competent interpretation, an available intervention window, parts, labor, and a work-order process that can act on the result.
Prescriptive maintenance adds a recommended action to the detected condition. The recommendation may be to confirm a diagnosis, inspect a coupling, reserve a bearing, reduce load, or plan an outage. It still depends on engineering judgment and safe execution. An automated recommendation can't compensate for an incorrect asset hierarchy or a technician who lacks the required procedure.
NIST observed that the highest-reactivity quartile of U.S. manufacturing establishments experienced 3.3 times more downtime, 16.0 times more defects, and 4.89 times more maintenance-related inventory increases than lower-reactivity peers. Reactive work still represented 45.7% of average maintenance activity, according to the NIST manufacturing analysis.
That evidence argues against unmanaged corrective work, not against all corrective work. A redundant washdown fan may be cheaper to replace after failure than to monitor continuously. A critical compressor deserves a different level of attention because its failure can constrain the whole site.
A practical comparison should ask:
| Strategy | Trigger | Where it fits | Main trade-off |
|---|---|---|---|
| Reactive | Functional failure | Low-risk, replaceable assets | Unplanned work and secondary damage |
| Preventive | Time, runtime, or cycles | Predictable age-related degradation | Over-maintenance or missed failures |
| Predictive | Measured condition | Critical assets with detectable degradation | Requires data, analysis, and workflow |
| Prescriptive | Condition plus recommended action | Complex assets with defined response paths | Depends on trustworthy diagnosis and execution |
A plant's asset mix determines the portfolio. Teams comparing task choices can use this overview of industrial maintenance types as a reference, but the final decision still belongs to the site's failure data and operating consequences.
Criticality Ranking and FMEA as the Decision Lens
A maintenance strategy usually fails at the decision stage, not at the sensor stage. If a site has limited technician hours, uneven CMMS history, and more assets than it can monitor well, the first job is to decide which failures matter most and which tasks the team can realistically execute.
Criticality ranking sets that order. The point is not a perfect score. The point is a repeatable basis for deciding why one pump gets continuous condition monitoring, another gets a route-based inspection, and a third is managed with a deliberate run-to-failure plan because the consequence is low and replacement is straightforward.
The ranking should consider:
- Safety: Could failure expose workers to pressure, chemicals, heat, moving equipment, or stored energy?
- Environmental impact: Could the failure release product, oil, gas, wastewater, or another regulated material?
- Production impact: Does the asset constrain a line, batch, utility, or the whole process?
- Quality impact: Could instability create off-spec product or contamination?
- Repair lead time: Are specialist labor, long-lead parts, or permits required?
- Redundancy: Can another asset carry the duty without creating a new risk?
High-criticality rotating equipment often includes single-train process pumps, compressors, large motors, and gearboxes. Mid-criticality assets often have practical standby capacity or shorter recovery time. Low-criticality equipment can include small interchangeable motors or simple fans where failure is inconvenient but manageable.
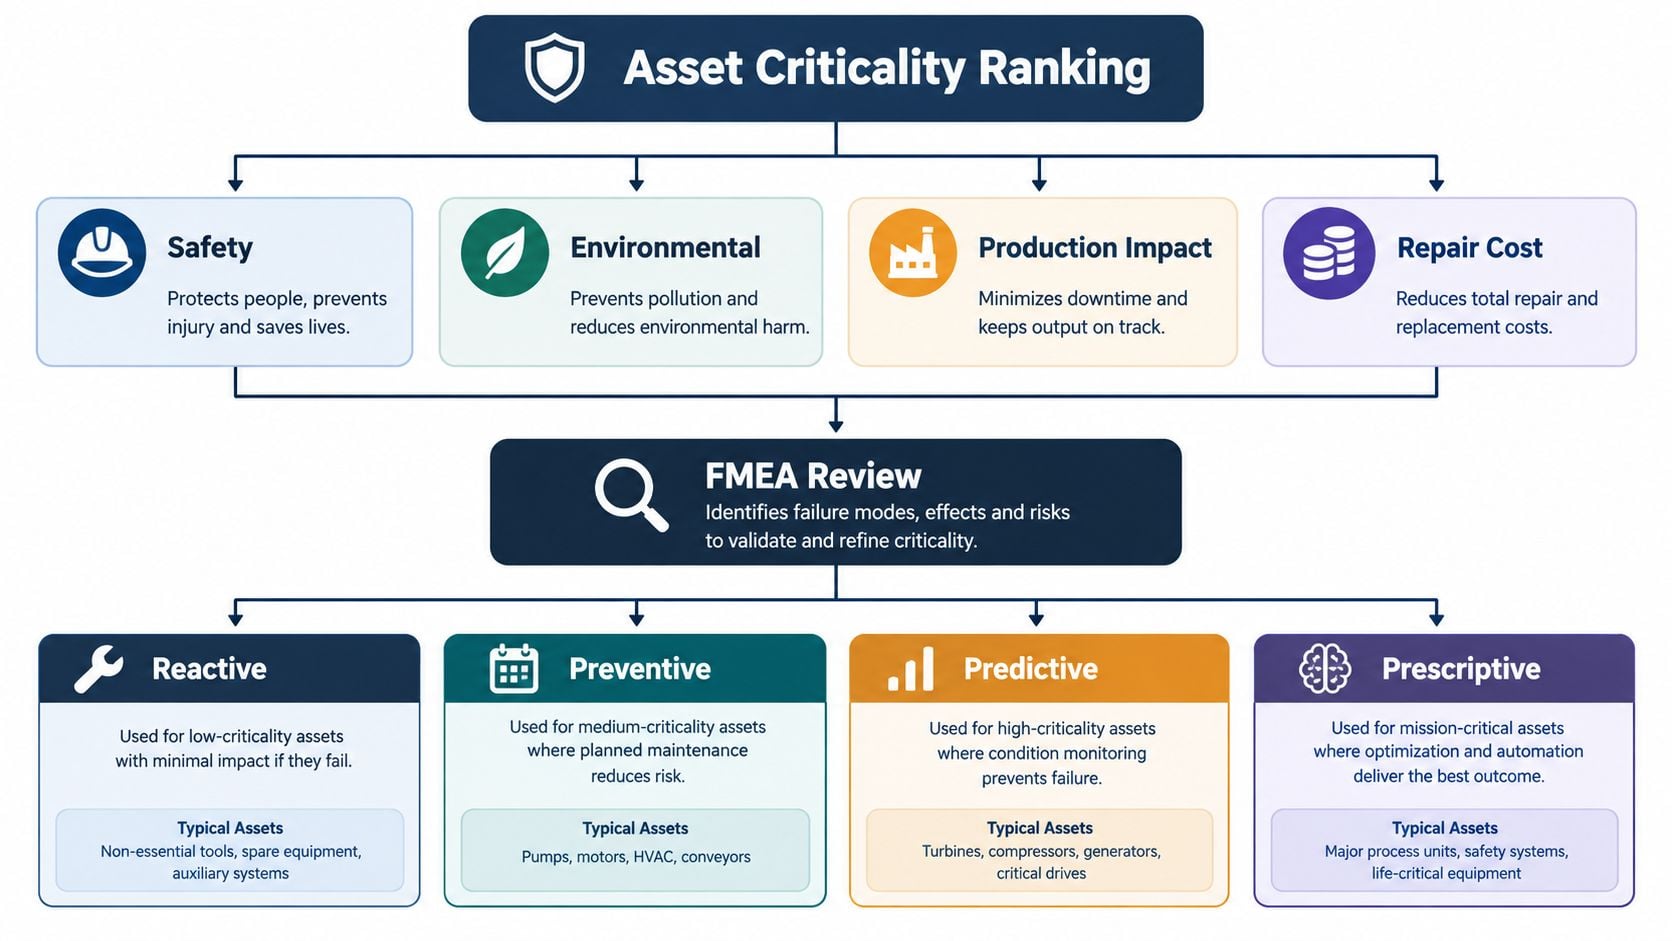
Failure Modes and Effects Analysis, or FMEA, turns that ranking into task logic. It examines how an asset can fail, what causes each failure, what the effect is, and whether the team can detect or prevent it in time. A structured FMEA for manufacturing process decisions gives planners a defensible link between failure mode, consequence, and task selection. It also stops a common error on plant floors, assigning one generic PM package to a machine with several unrelated failure mechanisms.
Take a centrifugal pump. Bearing lubrication loss may show up through rising vibration and temperature, so contamination control, lubrication standards, and vibration trending make sense. Shaft misalignment loads bearings, seals, and couplings, so precision alignment and post-installation checks matter more than another calendar-based bearing change. Impeller erosion shows up as lost hydraulic performance, where flow, pressure, power, or process response may reveal the problem before total failure. Mechanical seal failure can create leakage or contamination, which shifts attention to seal selection, installation quality, flush conditions, and leak inspection. Cavitation damages hydraulic surfaces and creates characteristic noise and vibration, so suction conditions, pressure, and operating point have to be checked.
NASA requires maintenance decisions to be chosen from scheduled restoration, condition-based tasks, redesign, and run-to-failure based on failure effects and criticality, as set out in NASA's reliability-centered-maintenance policy for selecting among scheduled restoration, condition-based tasks, redesign, and run-to-failure.
Decision test: If the team cannot name the failure mode a task controls, that task deserves review.
FMEA does not make a machine reliable by itself. It gives planners a clear link between failure mode, consequence, detection method, task interval, and response. That is what keeps a maintenance strategy grounded in plant reality instead of inherited checklists.
Matching Condition Monitoring Techniques to Failure Modes
Condition monitoring works when a measured signal changes early enough to influence a decision. NASA describes predictive testing and inspection as nonintrusive testing, visual inspection, and performance-data analysis used to assess machinery condition, schedule work before catastrophic failure, and forecast future maintenance requirements from trends. The technique must therefore match both the failure mode and the available decision window.
| Technique | Best-Detected Failure Modes | Decision Latency | Typical Asset Fit |
|---|---|---|---|
| Vibration analysis | Bearing damage, imbalance, misalignment, gear damage, looseness | Early to moderate, depending on failure development | Motors, pumps, gearboxes, fans, compressors |
| Oil and wear-debris analysis | Lubricant degradation, contamination, abnormal component wear | Moderate, with laboratory or field test turnaround | Gearboxes, hydraulic systems, compressors |
| Infrared thermography | Electrical resistance, overloaded connections, hot bearings, seal-face heat | Immediate during inspection or trend review | Electrical panels, motors, bearings, seals |
| Airborne ultrasound | Compressed-air leaks, steam-trap problems, lubrication condition, early bearing noise | Immediate route feedback | Utilities, steam systems, bearings, valves |
| Motor current signature analysis | Rotor issues, electrical imbalance, load-related anomalies, some mechanical conditions | Moderate, based on test quality and operating state | Motors, VFD-fed pumps, fans, compressors |
Vibration is a strong choice for a gearbox bearing where the failure develops gradually and the team can trend the measurement against a baseline. Oil analysis is more useful when wear particles, viscosity change, or contamination reveal internal degradation that surface measurements can't show. Thermography can identify an abnormal electrical connection or a hot mechanical seal face without intrusive disassembly.
Ultrasound suits a steam trap or compressed-air system where the high-frequency sound provides a quick indication during a route. Motor current signature analysis, or MCSA, examines electrical current behavior to identify motor and load-related anomalies, including conditions on a motor-fed pump that may not be obvious from a simple visual check.
For teams refining signal interpretation, evaluating anomaly detection methods can help frame the difference between detecting an unusual reading and identifying an actionable failure mechanism. The distinction matters. An anomaly is a reason to investigate, not automatic permission to replace a component.
Route-based inspection or continuous monitoring
Route-based monitoring gives a technician broad coverage across mid-criticality assets during a planned inspection. It works when the failure develops slowly enough for the route interval, the technician can reach the equipment safely, and the result has a clear escalation path.
Continuous monitoring earns its cost on high-consequence assets where a short detection window, changing load, or inaccessible location makes periodic inspection inadequate. It also requires alarm ownership. Someone must review the alarm, confirm the operating context, create the work, and verify the repair.
A condition monitoring system should therefore be selected after failure-mode analysis, not before it. More coverage isn't automatically more reliability if the plant can't interpret or act on the signals.
The Closed Loop from Alarm to Corrective Action
A predictive program fails at the handoff when an alarm doesn't become executable work. Detection is only the first event. The plant needs a controlled path from abnormal condition to diagnosis, planning, repair, and verified feedback.
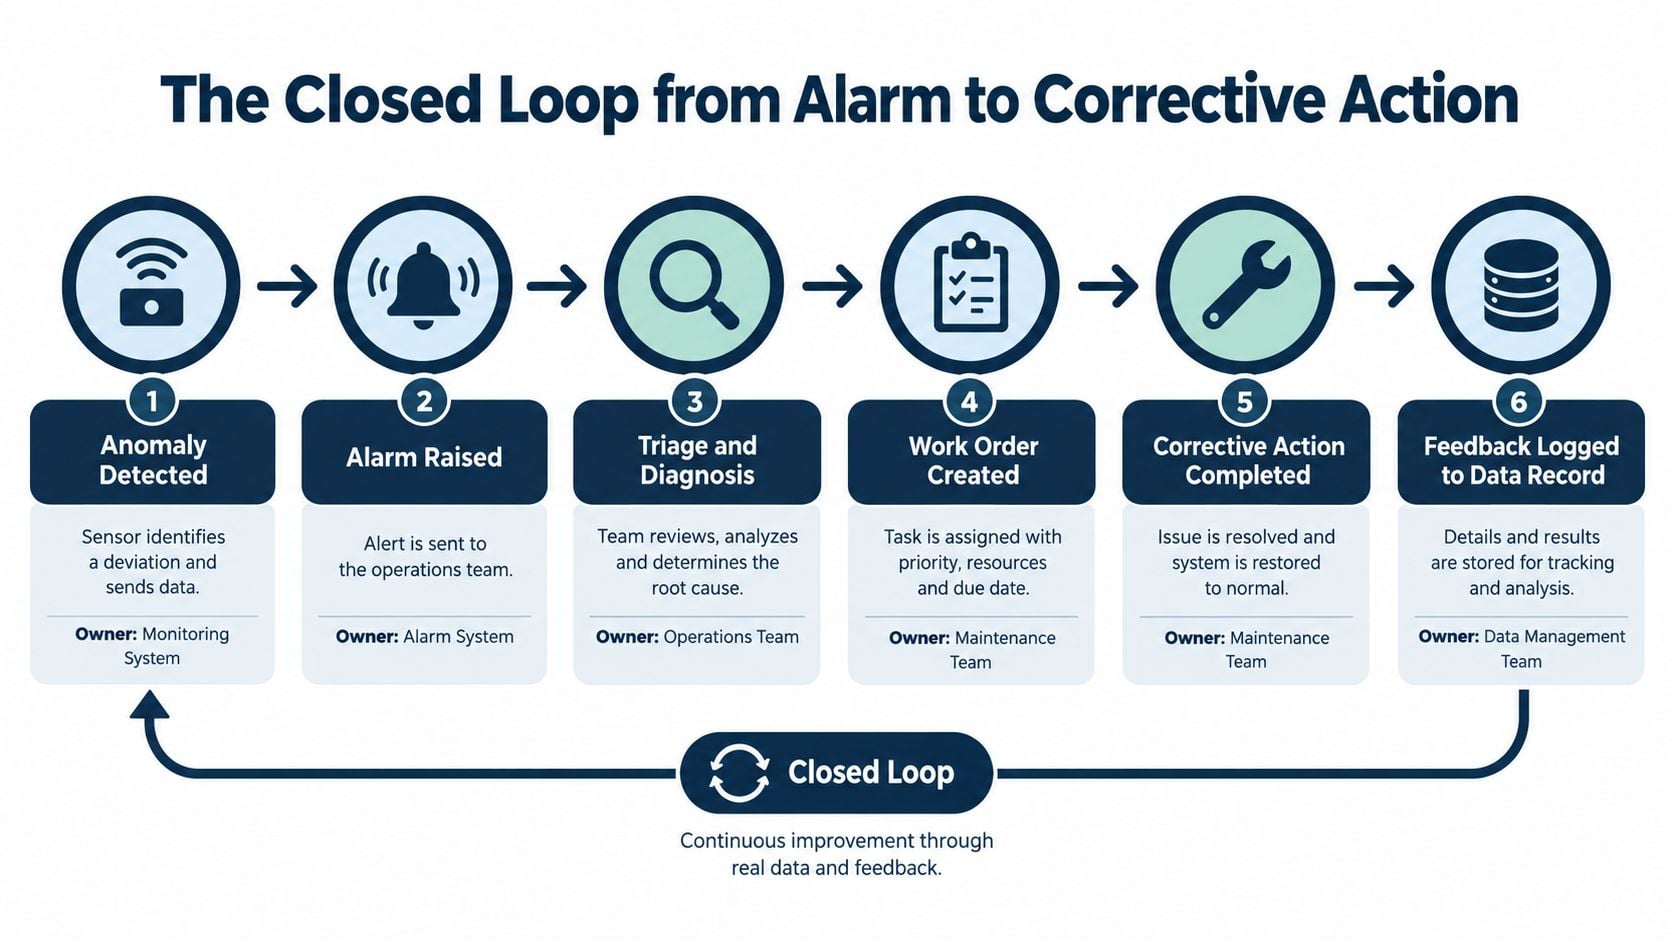
The minimum workflow should contain six ownership points:
- Anomaly detected: A route reading, online sensor, inspection, or operator observation identifies a change from the expected condition.
- Alarm raised: The severity and asset consequence determine whether the response is immediate, planned, or watch-list only.
- Triage and diagnosis: A reliability engineer or qualified analyst confirms the likely failure mode and rules out load, process, or measurement effects.
- Work order created: The finding includes the asset ID, location, failure mode, recommended action, priority, and required safety controls.
- Corrective action completed: The planner secures labor, parts, permits, access, and a production window before the intervention.
- Feedback logged: The technician records what was found, what failed, the mechanism, the repair, material use, labor, downtime, and production consequence.
A 2025 survey of 407 maintenance leaders in the UK and continental Europe found that 59% still relied on spreadsheets for execution, 41% used paper checklists, and only 6% used CMMS tools for execution. Just 28% described their processes as fully planned and preventive, according to the maintenance execution survey.
The data layer must preserve a functional-location hierarchy, unique equipment identifiers, maintainable items, operating context, failure mode, failure mechanism, detection method, corrective action, labor and material consumption, active repair time, and production consequence. These fields separate repeated pump seal failures caused by dry running from those caused by misalignment, abrasive service, incorrect selection, or installation error.
Technicians should record the failed item and mechanism at closeout. Reliability engineers should review codes weekly and reject vague entries such as “worn out.” Alert severity should map to a written escalation rule, not an individual person's memory.
Automated notification can support this handoff, and guidance on IT alert automation with DataLunix provides useful context for managing alert ownership. The plant still needs engineering judgment and a maintained data model. A disciplined work-order management process often produces more value than another sensor added to an unreliable workflow.
A Compressed Air Compressor Example and the Labor Reality
A rotary-screw compressor illustrates why a maintenance strategy must combine failure analysis, operating context, and workforce capacity. Suppose the compressor experiences repeated bearing damage, oil carryover, or aftercooler fouling. Replacing the failed bearing each time may restore service, but it doesn't explain whether lubrication, loading, contamination, ventilation, or installation caused the recurrence.
The reliability team can begin by grouping the compressor's failure history by failed component and mechanism. Weibull analysis, a statistical method used to examine failure distribution and changing failure probability, can help determine whether the events suggest early-life defects, random failures, or an age-related pattern. The result should inform the first overhaul interval, not dictate it blindly.
A repeat failure then becomes a bad-actor candidate. Bad-actor tracking concentrates engineering attention on assets or failure modes that consume disproportionate corrective effort. For the compressor, the team may compare oil condition, discharge temperature, operating load, ambient temperature, filter condition, alignment records, and rebuild quality.
Root-cause work follows. A 5-Why analysis tests the chain from symptom to system cause. Apollo, a structured root-cause method, can help separate physical causes, human decisions, and organizational conditions. The investigation may show that the specified lubricant doesn't suit the operating temperature, the compressor room lacks adequate ventilation, or the machine spends too much time outside its intended load range.
A practical response could include:
- Standardized inspections: Train technicians to check oil level, filter condition, temperature, vibration, and cooler fouling using the same route and acceptance criteria.
- Specialist support: Outsource advanced vibration interpretation, oil analysis, thermography, or MCSA when the site can't staff those capabilities safely and consistently.
- Engineering correction: Redesign ventilation, improve filtration, revise lubricant control, or correct alignment if routine tasks can't control the failure.
- Knowledge capture: Attach photographs, measurements, failure mechanisms, and repair instructions to the asset record so the next technician doesn't start from zero.
Labor constraints shape every choice. A 2025 industry analysis reported that insufficient resources and staff was the leading challenge for 45% of maintenance leaders, skilled-labor shortages affected 30%, the average U.S. maintenance technician was approximately 50 years old, and roughly one-third of the workforce was 55 or older, as detailed in the industrial maintenance workforce analysis.
A strategy that requires analysis no one can perform will fail. The right approach standardizes repeatable routes, reserves specialist support for difficult failure modes, and engineers out recurring work where possible. Compressor teams can use compressor troubleshooting guidance to structure that investigation around symptoms, operating conditions, and failure mechanisms.
Putting the Maintenance Strategy into Practice
Implementation should start with exposure, not equipment count. Review the share of reactive work, emergency downtime, recurring defects, and maintenance-related inventory disruption. Then rank the most consequential assets and focus detailed engineering effort where failure consequences justify it.
A practical rollout follows this order:
- Benchmark reactive exposure. Separate planned corrective work from emergency response so the team knows whether the problem is failure itself or poor work control.
- Rank critical assets. Apply safety, environmental, production, quality, lead-time, and redundancy criteria to the highest-risk equipment.
- Perform FMEA. Identify functions, failure modes, causes, effects, detection methods, and suitable tasks.
- Select monitoring coverage. Choose route-based or continuous monitoring according to failure development, consequence, accessibility, and available analysis capacity.
- Govern the CMMS record. Standardize asset IDs, locations, failure codes, mechanisms, detection methods, corrective actions, and closeout expectations.
- Set the review rhythm. Review bad actors, alarm conversion, task effectiveness, and recurring failures regularly, with a formal quarterly strategy review.
The KPI set should distinguish leading indicators from lagging results. Leading indicators include actionable alerts, detection-to-work-order time, planned-versus-emergency work, PM compliance, monitoring coverage, and bad-actor recurrence. Lagging indicators include unplanned downtime, maintenance cost per unit, mean time between failures, mean time to repair, production loss, quality defects, and overall equipment effectiveness.
The U.S. Department of Energy's Federal Energy Management Program reports that a properly implemented predictive-maintenance program can save 8% to 12% compared with preventive maintenance alone. Its cited industrial averages include a 10:1 return on investment, a 25% to 30% reduction in maintenance costs, a 70% to 75% reduction in breakdowns, and a 35% to 45% reduction in downtime, as reported in the Federal Energy Management Program guidance. These figures support targeted investment, not indiscriminate sensor deployment.
Procurement belongs in the same operating model. A practical MRO procurement guide can help teams connect spare-parts decisions, supplier lead times, standardization, and inventory policy to the criticality analysis. A bearing that is inexpensive but unavailable can still create a major exposure on a single-train compressor.
The final test is execution. A good maintenance strategy tells operators what to watch, technicians what to record, planners what to prepare, engineers what to investigate, and leaders what to review. When those decisions connect, condition data becomes planned work instead of another unattended alarm.
Forge Reliability offers a free reliability assessment covering reactive exposure, asset criticality, FMEA coverage, CMMS data quality, and monitoring priorities. Visit Forge Reliability to identify which assets need continuous monitoring, route-based inspections, redesigned tasks, or a more controlled run-to-failure plan.