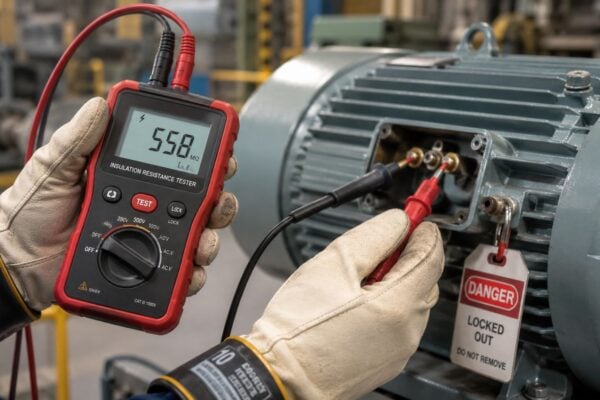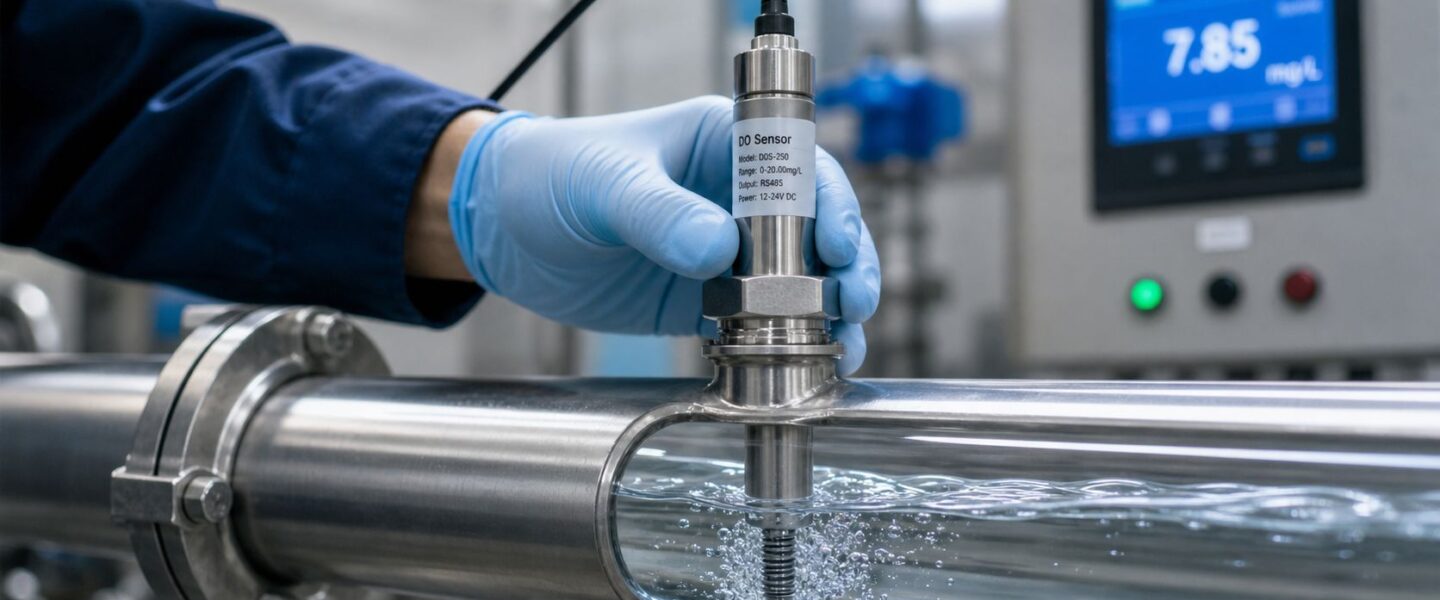
A maintenance manager usually notices the same pattern before a dissolved oxygen problem gets formal attention. Pump seals start failing earlier than expected in a cooling loop. Heat exchanger performance drifts. Operators complain that the reading “never looks quite right,” so the sensor gets recalibrated again, then ignored again. Meanwhile, the plant historian keeps collecting data that no one trusts enough to use.
That's where most dissolved O2 sensor programs stall. Teams treat the sensor as a process instrument, useful for chemical control and compliance, but not as a reliability input tied to asset health. That misses the bigger opportunity. In the right application, a dissolved O2 sensor can help expose corrosion risk, biofilm development, poor water-side control, and hidden causes of rotating equipment damage before those issues turn into downtime.
Table of Contents
- Selecting the Right DO Sensor for Your Application
- Installation and Mounting Best Practices for Reliable Data
- Executing Defensible Calibration and Verification Routines
- Diagnosing Common DO Sensor Failure Modes and Drift
- Integrating DO Data into Your Predictive Maintenance Program
- From Process Control to Asset Reliability
Selecting the Right DO Sensor for Your Application
A dissolved O2 sensor choice is a reliability decision first and a purchasing decision second. The wrong sensor doesn't just create nuisance maintenance. It creates bad data, and bad data drives wrong operating decisions around corrosion control, aeration, feedwater protection, and shutdown response.
The first split is between optical sensors and electrochemical sensors. In plant terms, that usually means choosing between lower initial complexity and higher routine care, or higher initial cost and lower day-to-day intervention.
Start with failure consequences
Electrochemical sensors still make sense in many plants, especially where technicians are comfortable maintaining membranes, electrolyte systems, and replacement schedules. But the maintenance burden matters because many DO failures begin with maintenance-induced error, not dramatic hardware failure.
Optical sensors change that trade-off. According to the manufacturer documentation, galvanic dissolved oxygen sensors have a typical operational lifespan of 3–4 years before lead electrode corrosion necessitates full sensor replacement, while optical DO sensors based on fluorescence quenching offer maintenance-free operation with a sensing cap life of 2 years from first reading (AC800PEC dissolved oxygen sensor manual). That difference affects spare parts strategy, PM task design, and how often a technician has to open the loop.
Practical rule: If the plant can't support frequent hands-on sensor care without shortcuts, an optical design usually protects data quality better than an electrochemical design.
Comparison of DO Sensor Technologies
| Attribute | Optical (Luminescent) | Electrochemical (Galvanic/Polarographic) |
|---|---|---|
| Measurement approach | Uses fluorescence quenching in a sensing layer | Uses electrochemical reaction at electrodes |
| Routine maintenance burden | Lower day-to-day maintenance | Higher hands-on maintenance |
| Consumable focus | Sensing cap replacement | Membrane, electrolyte, and full sensor replacement over time |
| Lifecycle planning issue | Cap life must be tracked from first reading | Electrode corrosion drives end of life |
| Best fit | Long-term installations, difficult access, harsher streams | Lower upfront-cost applications with strong maintenance discipline |
| Reliability concern | Optical layer aging or fouling | Corrosion, electrolyte issues, membrane damage |
A water treatment manager evaluating options for a utility or industrial system should also consider how the sensor will fit into broader condition monitoring work in water and wastewater reliability programs. The sensor shouldn't be selected in isolation from the assets it's meant to protect.
A power plant example
In a boiler feedwater application, the crucial question isn't which sensor looks better on a datasheet. The question is what happens when the reading drifts and the team misses oxygen ingress. In that service, a false low reading can let corrosion risk gradually build, while a false high reading can push operators into unnecessary intervention.
Electrochemical sensors can still work well there, especially where the plant already has disciplined calibration and replacement practices. But in many power facilities, optical sensors prove easier to support because they remove some recurring maintenance tasks that often get deferred during outages, staffing gaps, or unit startups.
What doesn't work is choosing solely on purchase price. A sensor installed on a critical corrosion-monitoring loop should be judged by its impact on equipment protection, data confidence, and technician time, not by line-item cost alone.
Installation and Mounting Best Practices for Reliable Data
A dissolved O2 sensor can be perfectly healthy and still deliver useless information if it's mounted in the wrong place. Installation errors often get mislabeled as calibration drift, which leads the team into a loop of adjustment, doubt, and repeated troubleshooting.
The core rule is simple. The sensor has to see the same fluid conditions that the equipment sees. If it sits in a stagnant pocket, a dead leg, or a high-noise location near vibration and hydraulic shock, the reading may be stable, but it won't be representative.
Mount for representative conditions
A good installation protects both measurement quality and sensor hardware. That means paying attention to location, flow pattern, immersion, cable routing, and mechanical support.
- Avoid dead legs: A branch connection with little flow will trap fluid that doesn't reflect the main process stream.
- Control insertion depth: Too shallow, and the sensor may sit in a boundary layer near the wall. Too deep, and it may take unnecessary mechanical abuse.
- Keep flow moderate: The sensor needs representative movement, but not direct hydraulic punishment from turbulence, slugs, or water hammer.
- Isolate vibration: Mounting near pump casings or unsupported pipe runs can create intermittent signal noise and stress the sensor body or connector.
- Protect cable integrity: A damaged or repeatedly flexed cable can create erratic readings that look like chemistry problems.
For teams building a broader monitoring strategy, this kind of installation discipline fits naturally with condition monitoring practices for water and wastewater assets. The same thinking applies across pressure, vibration, temperature, and chemistry inputs. Poor sensor placement always degrades decision-making.
A chemical reactor feed line example
A common mistake in a chemical plant reactor feed line is placing the dissolved O2 sensor on a convenient side branch that was never intended for representative sampling. The transmitter reads smoothly, maintenance sees no obvious fault, and operators assume the process is under control. But the branch line may hold slower-moving fluid with a different oxygen profile than the live feed entering the reactor.
A steady reading from the wrong location is more dangerous than a noisy reading from the right one.
Another frequent problem shows up near pump discharge piping. Teams want the sensor where flow is strong, but they mount it so close to the pump that pulsation, vibration, and local turbulence dominate the signal. The result is a reading that jumps around enough to trigger distrust. Then someone smooths the signal in software, which hides the installation defect without fixing it.
What works on the plant floor is a simple field check. Compare the installed reading to a grab sample or temporary portable verification point taken from a representative location. If the numbers consistently disagree under steady process conditions, the first suspect should be the mounting point, not the chemistry.
Executing Defensible Calibration and Verification Routines
Calibration is where a dissolved O2 sensor earns the right to influence operations. If calibration is rushed, undocumented, or performed with poor standards, the rest of the reliability program sits on weak ground. Teams then spend time reacting to false alarms, chasing fake process deviations, or defending data no one believes.
The calibration routine below works because it's repeatable. It gives technicians a sequence they can follow under plant conditions, and it gives managers a basis for auditing data quality.
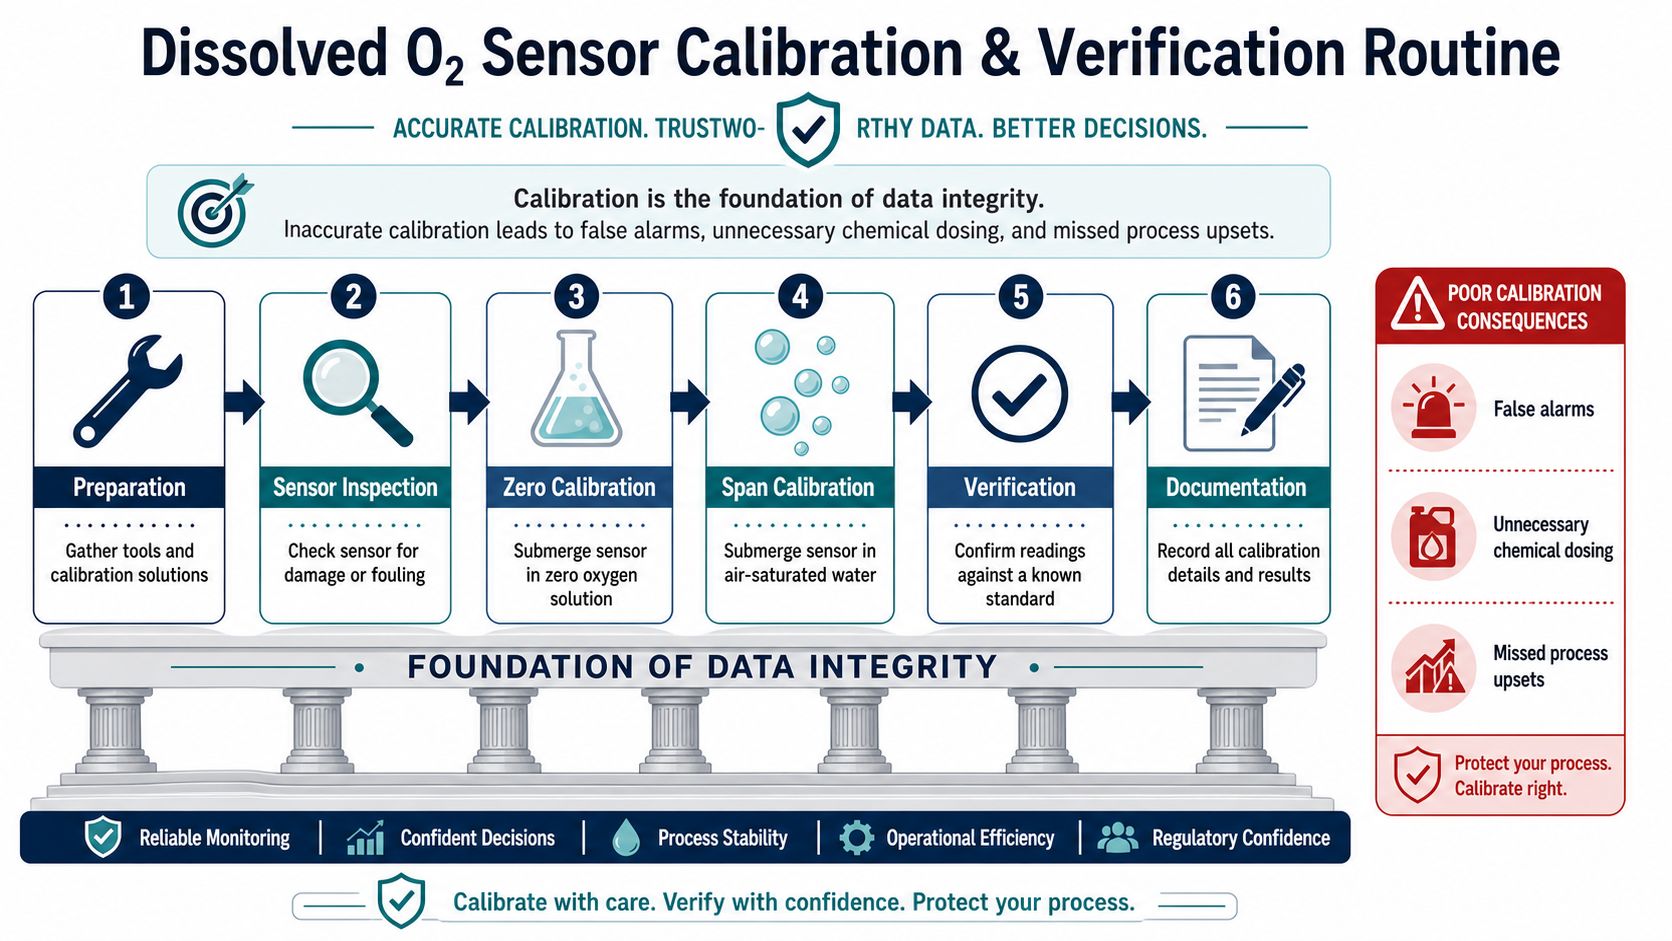
Build a routine technicians can repeat
A defensible program has two parts. Calibration sets the instrument. Verification proves the instrument is still telling the truth under expected operating conditions.
Inspect before touching settings
Check the sensor face, membrane area, optical surface, cable, connector, and any cleaning accessories. Fouling, trapped bubbles, and physical damage can invalidate the whole task before it starts.Prepare a real zero condition
Zero-point calibration requires an oxygen-free environment. One accepted method is boiling deionized water to reduce dissolved oxygen to less than 0.05 mg/L and cooling it in an oxygen-free container, or using sodium sulfite to reduce concentration near zero (Renkeer guidance on DO zero calibration). If the reading won't stabilize below that threshold during zero calibration, the optical head or protective membrane should be replaced.Run the saturation point correctly
For luminescent sensors, the standard method requires aerating the calibration water until the reading stabilizes for 4–5 minutes, then adjusting to the theoretical dissolved oxygen saturation value from oxygen-solubility tables. The instrument must read within ±0.2 mg/L of that theoretical value. The same guidance also warns that failing to remove the sensor's wiper before zero-point checks can compromise later measurements (National Environmental Methods Index procedure).Respect instrument warm-up where required
In high-performance electrochemical systems, the sensor and instrument must be powered for at least 6 hours before testing, and zero calibration using 99.995% pure nitrogen typically requires one hour to achieve a stable near-zero reading. Those systems can deliver ±1% of reading or 1 ppb, whichever is greater, with a 98% response time of 90 seconds over 0 to 10,000 ppb (Mettler Toledo high performance DO sensor documentation). In ultra-clean process water, skipping those conditions usually creates drift and false confidence.
Field note: Calibration done fast is often recalibration waiting to happen.
Teams managing treatment assets can tie this routine into broader predictive maintenance for water treatment equipment so calibration history becomes part of the asset record, not just a checkbox in the instrument shop.
A wastewater basin example
In a municipal wastewater aeration basin, a technician may complete a two-point calibration and still miss the actual problem. The sensor can pass calibration in clean water but respond too slowly in process service because fouling dampens its response.
That's why verification should include a practical response check after calibration. The team should confirm that the sensor responds cleanly to a known change and doesn't lag, overshoot, or stick. In biological treatment, a delayed DO response can distort blower control and confuse troubleshooting when operators are trying to stabilize nutrient removal performance.
What works is documenting three things every time: the condition found, the actions taken, and the final verification result. What doesn't work is recording only “calibrated OK.” That phrase helps no one when the reading is questioned a week later.
Diagnosing Common DO Sensor Failure Modes and Drift
When a dissolved O2 sensor reading looks wrong, the first job is separating process reality from instrument failure. Plants lose time when technicians jump straight to replacement. They lose even more time when they assume the process changed and leave a bad sensor in service.
A good troubleshooting path starts with symptoms. Slow response, stable offset, random spikes, and chronic recalibration all point to different failure modes.
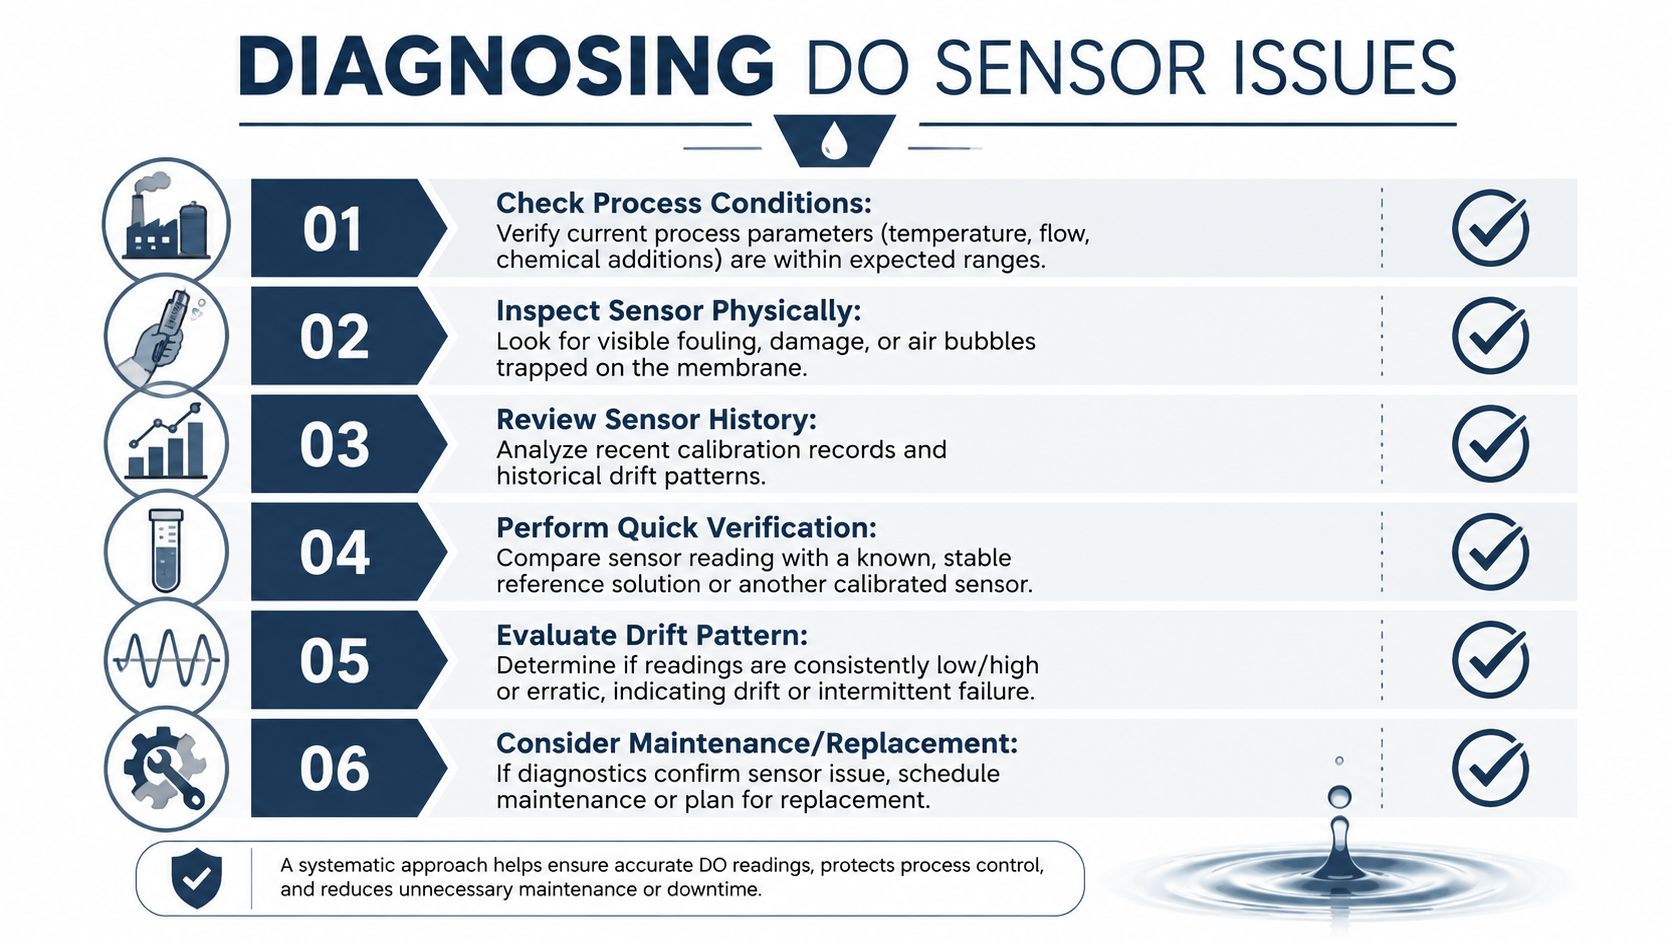
Separate process changes from sensor problems
The fastest way to sort the issue is to match the symptom to the likely cause.
- Slow, damped response: Often points to fouling, coating, biofilm, or membrane obstruction. This is common in food and beverage streams where product residue builds a barrier between process liquid and sensing surface.
- Consistently low readings: Often tied to membrane damage, electrolyte condition problems in electrochemical designs, or optical surface degradation.
- Erratic readings: Frequently caused by cable faults, loose connectors, electrical noise, vibration, or intermittent moisture intrusion.
- Repeated need for calibration adjustment: Usually indicates drift. The underlying cause might be sensor aging, optical layer degradation, contaminated maintenance practices, or installation in a location that doesn't represent the process.
For fluorescence-based sensors, the measurement principle itself matters during diagnosis. DO concentration is linearly correlated with fluorescence intensity because oxygen quenches the excited state of the fluorescent layer. That means baseline drift in the optoelectronic detection element can signal degradation of the fluorescent-sensitive material or the oxygen-permeable film, eventually creating non-linear errors in process water applications such as food and beverage sterilization lines (fluorescence DO sensor review in PMC).
A formal failure review helps once a pattern appears. Teams that need a structured way to solve business problems for good often benefit from a simple root cause template that forces separation of symptom, mechanism, and corrective action before another sensor gets swapped.
High-viscosity service needs a different mindset
High-viscosity and particulate-rich fluids create a different drift problem. Optical sensors often perform very well in clean water, then disappoint when they move into sticky, dirty, or solids-laden streams. The issue isn't always the sensor. It's often the maintenance strategy copied from a cleaner application.
Field data shows that in high-viscosity industrial process fluids, including food and beverage and pulp and paper service, optical DO sensor calibration frequency must increase 3–5x compared with manufacturer specs for clean water, and there's no standard ANSI/ISA protocol for that scenario, which leaves plants using local heuristics (ACT dissolved oxygen workshop paper).
Plants shouldn't treat drift in dirty service as a technician problem when the real issue is an unrealistic maintenance interval.
A pulp and paper example makes this clear. If a sensor in a particulate-rich white water stream starts drifting every few weeks, repeated calibration may restore the number temporarily, but it won't solve the underlying exposure conditions. The fix is usually a revised cleaning and verification schedule tied to that actual service, plus a review of mounting location and protective hardware.
For recurring bad actors, the disciplined next step is a root cause analysis process for water treatment equipment that links the sensor issue to process conditions, PM interval, and hardware design instead of stopping at “replace probe.”
Integrating DO Data into Your Predictive Maintenance Program
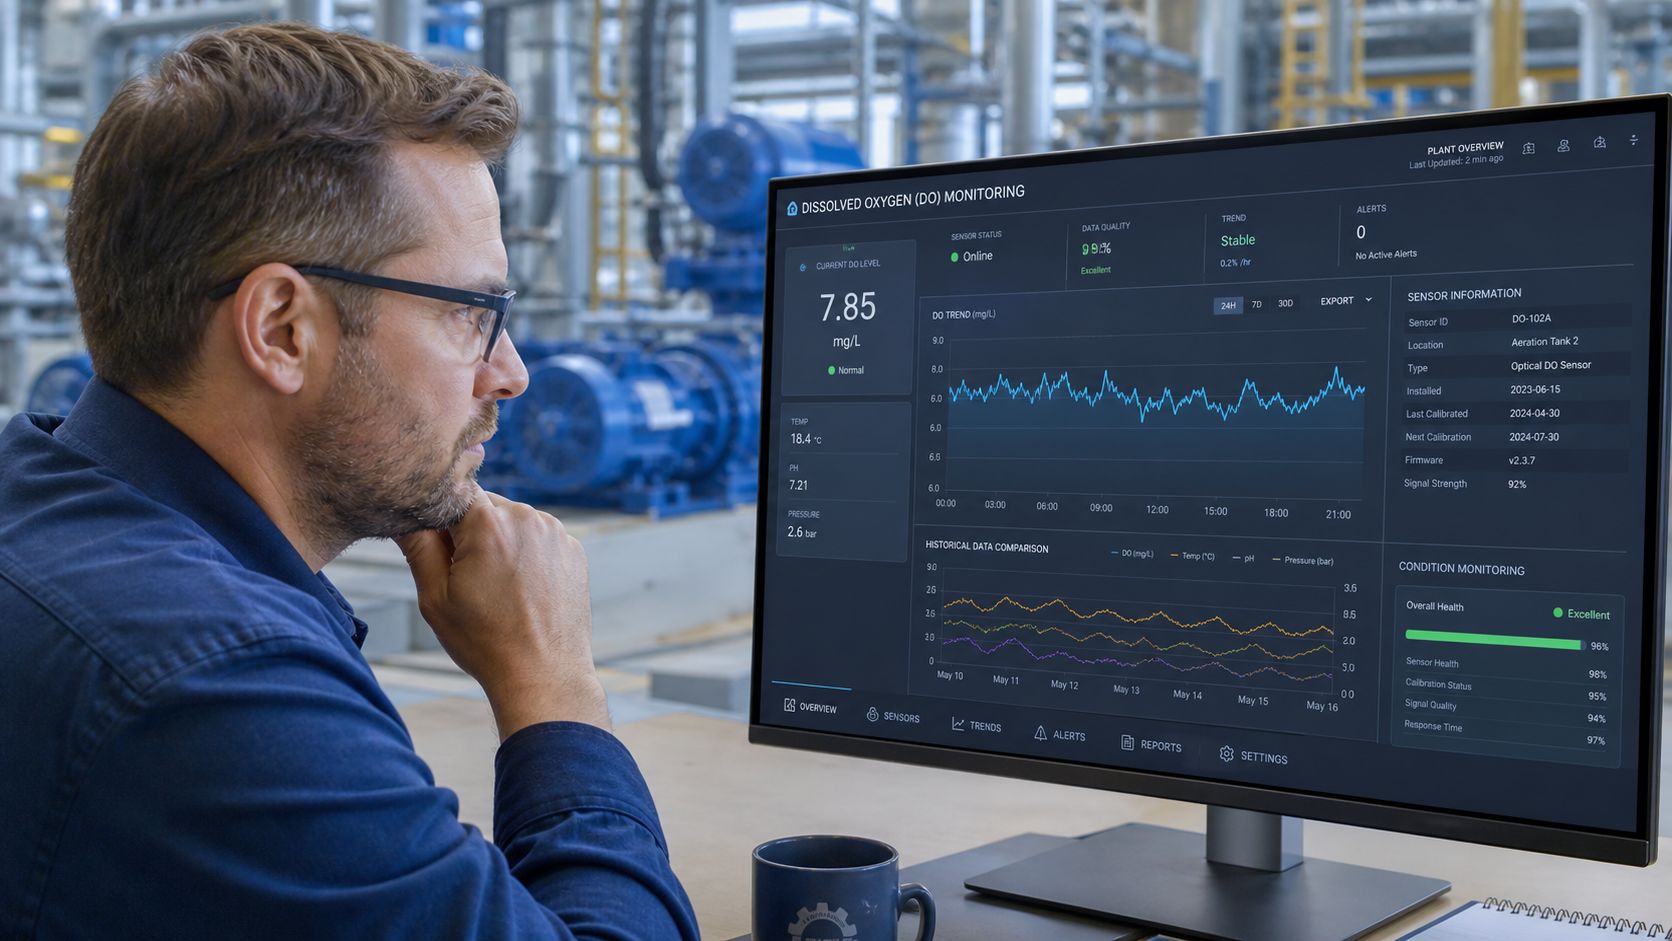
A dissolved O2 sensor becomes much more valuable when its data moves out of the instrument screen and into the plant's reliability workflow. That means trending it, comparing it against equipment condition signals, and treating excursions as possible evidence of developing failure mechanisms.
This shift matters because many plants already measure dissolved oxygen but don't use it to protect machinery. They use it to satisfy process targets and little else.
Why most PdM programs miss the signal
Recent industry surveys show that fewer than 12% of predictive maintenance programs integrate dissolved oxygen trends into root cause failure analysis for rotating equipment, creating a reliability blind spot even though DO data can provide early warning of oxygen-driven corrosion mechanisms that often precede pump and turbine damage (USGS technical manual reference).
That gap shows up in cooling water loops, seal water systems, and auxiliary circuits around critical assets. Reliability teams trend vibration, bearing temperature, motor current, oil condition, and process throughput. But they often leave out the chemistry indicator that can explain why corrosion, pitting, deposit formation, or heat transfer loss is starting in the first place.
Key takeaway: A DO trend isn't just a water-quality number. In the right loop, it's an asset-risk indicator.
A useful program puts dissolved oxygen into the historian and CMMS with context tags. The reading should be visible alongside equipment vibration, exchanger performance, motor temperature, and maintenance events. Teams using advanced analytics can also connect it to broader predictive maintenance and machine learning workflows so chemistry trends help sharpen failure prediction instead of sitting in a separate silo.
A rotating equipment cooling loop example
Consider a closed-loop cooling system supporting pumps and a turbine auxiliary skid. If dissolved oxygen begins trending downward over time, that may look harmless at first glance. In some systems, though, a falling DO pattern can align with biofilm development and oxygen consumption inside the loop. The practical result is reduced heat transfer, localized corrosion conditions, and gradual overheating risk at the equipment level.
That's where correlation matters. If the DO trend changes, and the team also sees rising bearing temperatures, worsening cooler approach temperatures, or vibration changes associated with thermal instability, the plant has a stronger basis for intervention. The sensor hasn't diagnosed the machine alone, but it has improved the failure narrative.
Reliability leaders should also connect this to asset performance metrics. A maintenance planner reviewing repeat cooling-related failures can use the SaberTask MTBF guide as a practical refresher on failure interval tracking, then compare those intervals against water-side condition trends such as dissolved oxygen excursions, fouling events, and corrective work orders.
What doesn't work is waiting for the post-failure review to ask whether water chemistry data existed. By then, the historian usually shows the warning signs that no one assigned to reliability ownership.
From Process Control to Asset Reliability
Plants get more value from a dissolved O2 sensor when they stop treating it as a standalone analyzer and start treating it as part of the asset protection system. Its primary function isn't just measuring oxygen in water. Its essential role is protecting pumps, exchangers, feed systems, cooling loops, and production stability from the damage that bad oxygen control can trigger.
The lifecycle view matters. Sensor selection affects maintenance burden and replacement planning. Installation determines whether the reading reflects reality. Calibration and verification determine whether anyone should trust the number. Failure analysis determines whether the team replaces parts blindly or fixes the actual cause of drift. Integration into predictive maintenance determines whether the data helps prevent downtime or just fills another trend screen.
A food and beverage plant offers a useful example. If the dissolved O2 sensor in a viscous process water application is mounted poorly, calibrated casually, and reviewed only by operations, the site will fight recurring alarms and doubtful readings. If that same sensor is installed well, maintained to the service conditions, and trended with pump health and exchanger performance, it becomes a practical reliability tool.
The plants that make this shift usually reduce confusion first. Better decisions follow.
If recurring sensor drift, cooling loop corrosion, nuisance alarms, or unexplained equipment failures are limiting uptime, Forge Reliability can help identify the failure mechanisms, tighten the monitoring strategy, and connect instrument data to a practical maintenance plan. Request a free reliability assessment to find where dissolved oxygen data can improve asset protection and reduce unplanned downtime.