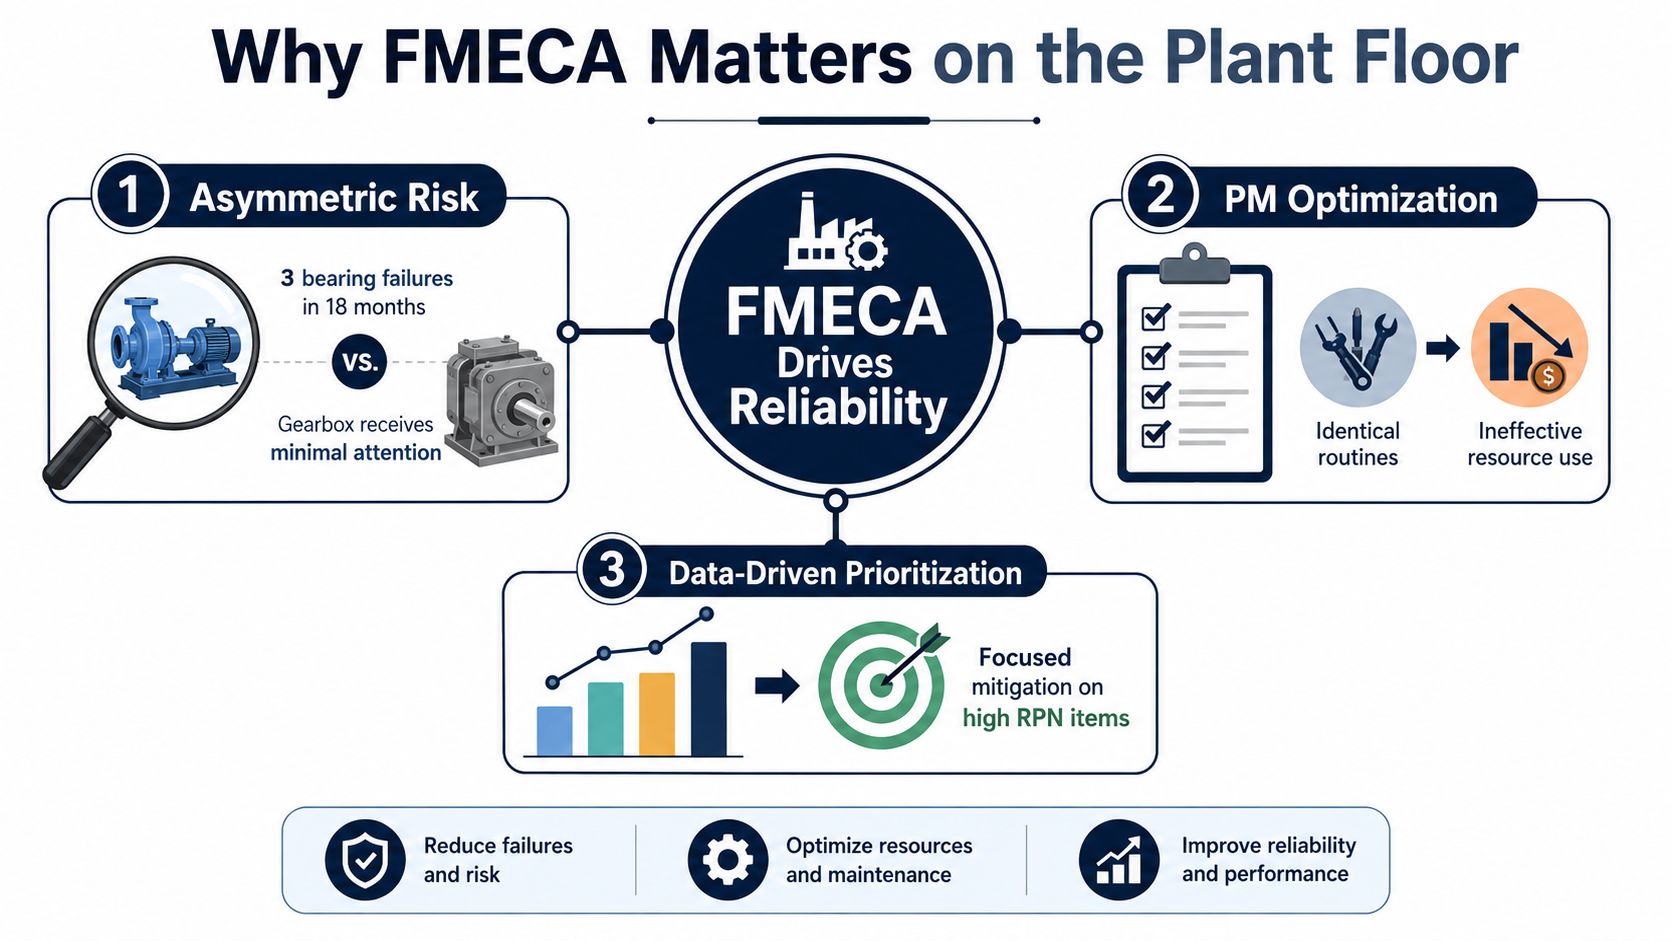
A centrifugal pump has failed three bearings in eighteen months. The maintenance team has performed the same scheduled lubrication and inspection routine each time, yet the breakdown pattern hasn't changed. A gearbox beside the pump receives little attention and continues to run without incident. The plant still has to decide where limited technicians, monitoring routes, spare parts, and planning hours should go.
Failure Modes, Effects, and Criticality Analysis, usually abbreviated as FMECA, provides a disciplined way to make that decision. It separates what can fail from why it fails and what happens afterward, then ranks the resulting risk using defined logic rather than the loudest opinion in the room. The method is especially useful when a frequent nuisance failure competes with a rare failure that could stop production or create a safety event.
FMECA was formalized in U.S. military standards through MIL-STD-1629A, published on 24 November 1980, which superseded the ships standard from 1 November 1974. The standard defined a structured method for evaluating effects on mission success, personnel safety, system performance, maintainability, and maintenance requirements, and explicitly separated FMEA from criticality analysis. It was later cancelled on 4 August 1998, as the discipline moved beyond military codification into international standards and industrial practice. MIL-STD-1629A
Table of Contents
- Why FMECA Matters on the Plant Floor
- How FMEA and FMECA Work
- Criticality Calculation Methods Compared
- Worked Example on a Pump and Motor Train
- Connecting FMECA to RCM, CMMS, and PdM
- Common FMECA Mistakes and How to Avoid Them
- Implementation Roadmap and KPIs
Why FMECA Matters on the Plant Floor
The pump in the opening example doesn't automatically deserve the highest priority just because it has failed repeatedly. The gearbox may have a lower observed occurrence rate but a more severe consequence if it contains a single train with no standby capacity. A maintenance manager needs to compare those conditions consistently, not rely on familiarity with the pump or the fact that its work orders are more visible.
FMECA forces that comparison. For each function, the team identifies the failure mode, traces its local and system effects, records likely causes, and assigns a criticality ranking. The result helps planners decide which assets should receive vibration routes, oil analysis, thermography, or more frequent inspections, and which low-consequence failures can remain run-to-failure with suitable spares.
Risk must follow the function
A pump bearing doesn't fail in isolation from the process. Bearing wear can increase vibration, damage a seal, reduce flow, trigger a trip, contaminate a product stream, or force an entire production unit offline. The team should therefore record effects at several levels:
- Local effect: The bearing develops clearance or surface damage.
- Next-level effect: The rotor becomes unstable and the pump loses hydraulic performance.
- System effect: The process receives insufficient flow or the train trips.
- Plant consequence: Production, safety, quality, or environmental performance is affected.
That chain makes the ranking defensible. It also gives the maintenance team a clear reason to inspect a bearing, correct alignment, verify lubrication, or redesign the installation instead of replacing the component after each breakdown.
Practical rule: A FMECA worksheet is valuable only when every high-ranked row leads to a decision someone can execute.
FMECA also gives operations a common language with maintenance. Operators can explain suction pressure changes, process upsets, and abnormal sounds. Technicians can add failure mechanisms and repair history. Reliability engineers can connect those observations to risk ranking and monitoring tasks. A practical operation and maintenance framework then becomes more focused because work is tied to defined failure consequences.
The strongest plant-floor practice pairs the formal worksheet with evidence. Vibration spectra can confirm bearing defects, oil analysis can reveal gearbox wear, thermography can expose loose electrical connections or coupling heat, ultrasound can identify lubrication and compressed-air issues, and motor current signature analysis can identify electrical or rotor-related abnormalities. FMECA supplies the priority. Condition monitoring supplies evidence about what is happening now.
How FMEA and FMECA Work
A centrifugal pump serving a process cooling loop may show rising vibration before it trips. The maintenance team needs more than the observation. It must identify the function at risk, the failure mode producing the symptom, the likely cause, the process effect, and the action that reduces the risk. FMEA supplies that structure. It identifies how an item can fail, what effect follows, and what causes can produce it. FMECA adds criticality analysis, ranking failure modes by severity and occurrence or probability, with detectability or other importance measures where the site's method requires them.
NASA described FMEA as a qualitative analysis of possible hardware failure modes and criticality analysis as the quantitative step that ranks modes by probability of occurrence. The distinction remains useful: a team can identify failure modes before deciding which ones deserve work. NASA's FMEA publication provides the historical foundation for that separation.
A seven-step workflow
Define the boundary. Include the pump, motor, coupling, lubrication arrangement, seal, suction and discharge interfaces, and relevant controls. A narrow boundary can hide a utility or control-system single point.
State each function. The pump may need to deliver process flow, maintain pressure, contain fluid, and support stable rotor operation. Functions are more useful than component names because one item can perform several jobs.
Identify failure modes. Examples include fails to start, insufficient flow, excessive vibration, mechanical seal leakage, bearing seizure, and loss of containment.
Trace effects. Record the local effect, then the effect on the pump train and process. “Bearing damaged” describes a condition. “Pump trips and cooling flow is lost” describes a system effect.
Record causes. Possible causes include poor alignment, contamination, inadequate lubrication, cavitation, electrical imbalance, pipe strain, and an incorrect operating point. Condition-monitoring evidence can support the assessment: vibration may show bearing or imbalance patterns, oil analysis may indicate gearbox wear, thermography may expose coupling heat or loose electrical connections, ultrasound may identify lubrication issues, and motor current signature analysis may reveal electrical or rotor abnormalities.
Assign scores and criticality. Apply the site's approved severity, occurrence, and detection logic. IEC 60812 defines FMEA and FMECA as methods that should be planned, documented, and maintained, and identifies FMECA as the variant where ranking includes severity and other importance measures. IEC 60812
Assign an action. The result may be an on-condition task, design change, process control, spare-parts decision, or accepted run-to-failure strategy. The ranking sets priority; monitoring evidence helps determine whether inspection intervals and predictive-maintenance tasks match the actual failure behavior.
The worksheet row
| Item | Function | Failure Mode | Effect | Cause | S/O/D | Criticality | Action |
|---|---|---|---|---|---|---|---|
| Pump bearing | Support rotor | Excessive wear | Vibration rises and pump may trip | Contamination or misalignment | Team-defined scores | Combined ranking | Vibration route, alignment verification, lubrication review |
The worksheet must preserve the difference between mode, cause, and effect. A bearing failure is not contamination, and neither is loss of cooling flow. Teams reviewing manufacturing and inspection controls can use the Evo Dyne Products QA process as a reminder that controls should be documented and traceable. A practical FMEA for manufacturing applies the same discipline by connecting each function and failure mode to an accountable action.
Criticality Calculation Methods Compared
No single scoring method fits every plant. A site screening thousands of components needs a fast way to separate low-consequence items from assets requiring deeper analysis. An aerospace program or high-consequence process unit may need probability and failure-rate data that a routine workshop doesn't have.
Three practical approaches
A qualitative risk matrix places severity and occurrence into broad bands such as low, medium, and high. It works well for screening a large asset population, especially when the team has limited reliable failure-rate data. Its weakness is resolution. Several very different failure modes can occupy the same cell.
The classical Risk Priority Number, or RPN, multiplies severity, occurrence, and detection, commonly using 1 to 10 scales in industrial FMEA practice. It adds more detail, but the multiplication can create misleading ties. For example, 8 × 3 × 3 = 72 and 8 × 9 × 1 = 72. The first mode is less frequent and less detectable, while the second is frequent but highly detectable. Treating both as identical can frustrate planners.
A quantitative criticality number uses a formula such as Cm = α × β × λ × t, where the terms represent factors such as failure-mode ratio, conditional probability, failure rate, and operating time. It requires credible data and is better suited to aerospace, defense, or high-consequence process applications where formal probability analysis justifies the effort.
| Method | Formula | Input Required | Best Use Case | Key Limitation |
|---|---|---|---|---|
| Qualitative matrix | Severity × occurrence bands | Workshop judgment and consequence categories | Screening broad asset populations | Limited resolution |
| Classical RPN | S × O × D | Severity, occurrence, and detection ratings | Component-level workshops | Ties can hide different risk profiles |
| Quantitative criticality | Cm = α × β × λ × t | Failure-rate and probability data | High-consequence or data-rich systems | Data and modelling effort are substantial |
Handling a tied score
The answer isn't to argue over whether a rating should be one point higher. The team should apply an action threshold and review the individual dimensions directly. A catastrophic consequence, a single-point function, or poor detection may require action even when the composite score isn't the highest.
Classical RPN also ignores the relative importance of its factors. Research on fuzzy FMECA describes expert judgment and linguistic risk labels as sources of uncertainty, while technical reviews identify missing occurrence and time-based information as persistent weaknesses. The discussion of RPN limitations supports using the score as a conversation starter, not as an automatic work-order queue.
A practical selection rule is straightforward:
- Use a qualitative matrix for initial population screening.
- Use RPN for structured component workshops where consistent scales exist.
- Use quantitative Cm where failure-rate data, operating time, and consequence modelling justify the rigour.
Teams working with tied rankings can also use this risk priority number guidance to keep the discussion focused on action rather than arithmetic.
Worked Example on a Pump and Motor Train
A process plant operates a centrifugal pump driven by an electric motor through a gear reducer. The train feeds an air compressor system, so the analysis boundary includes the pump, motor, coupling, gearbox, and compressor interface. The main functions are to deliver the required flow and head, contain process fluid, transmit torque, support the rotating elements, and keep the compressor available.
The initial workshop uses generic team ratings. These values are illustrative decision scores, not plant history, and they should be replaced with site data before maintenance intervals are set.
| Function | Failure Mode | Cause | Effect | S | O | D | Criticality (S × O) | Rank (Generic) | Rank (Data-Driven) |
|---|---|---|---|---|---|---|---|---|---|
| Support rotor | Bearing wear | Lubrication contamination | Vibration and eventual train trip | 8 | 3 | 6 | 24 | 4 | 2 |
| Contain fluid | Mechanical seal degradation | Dry running or poor flush | Leakage and possible process interruption | 9 | 2 | 5 | 18 | 5 | 3 |
| Transmit torque | Coupling misalignment | Soft foot or pipe strain | Heat, vibration, and coupling damage | 7 | 4 | 5 | 28 | 3 | 4 |
| Reduce speed | Gear tooth spalling | Lubricant contamination or overload | Loss of torque transmission | 8 | 2 | 7 | 16 | 6 | 5 |
| Deliver flow | Inner-race bearing defect | Surface fatigue | Rising vibration followed by pump trip | 8 | 2 | 8 | 16 | 6 | 1 |
| Drive equipment | Motor winding fault | Thermal stress or insulation degradation | Motor trip and compressor unavailability | 9 | 2 | 6 | 18 | 5 | 6 |
The table shows why S × O alone isn't enough. A mode can have a modest generic occurrence rating but still deserve attention because detection is poor or the consequence is severe. The team can combine the qualitative matrix with an action threshold based on S × O × D, provided the scoring rules are documented and applied consistently.
Replacing assumptions with evidence
The data-driven reranking uses actual CMMS work orders, failure codes, repair findings, and vibration spectra. If the spectrum contains a credible inner-race defect pattern and the CMMS shows repeated bearing-related interventions, occurrence should no longer remain a generic assumption. The inner-race defect moves from rank 6 to rank 1 in the example because the evidence changes the decision, not because the component name sounds important.
That change should alter the maintenance plan. The pump bearing becomes a candidate for a defined vibration route, alarm limits, confirmation inspection, lubrication review, and spare-bearing readiness. The gearbox still deserves oil analysis and inspection, but its lower evidence-based priority may prevent the plant from spending the same route time on both machines.
Evidence changes the ranking only when it enters the worksheet as a documented input.
Vibration should be paired with other techniques where the failure mechanism demands it. Oil analysis can identify gearbox wear particles and lubricant degradation. Thermography can reveal coupling or motor-terminal heating. Motor current signature analysis can support investigation of electrical and rotor-related faults. Process data, such as suction pressure, discharge pressure, and flow, can distinguish hydraulic problems from mechanical defects.
A detailed centrifugal pump reliability and failure prevention resource can help teams connect those failure modes to practical inspection and prevention tasks. The FMECA output shouldn't end as a spreadsheet. It should identify the measurement, owner, trigger, and response for each high-priority mode.
Connecting FMECA to RCM, CMMS, and PdM
FMECA earns its place on the plant floor when each row leads to a maintenance decision. Reliability-centered maintenance, or RCM, asks which task can control a particular failure mode. The answer might be scheduled restoration, scheduled discard, an on-condition inspection, or run-to-failure supported by suitable spares and a recovery plan.
For a pump bearing defect, a high criticality ranking commonly supports an on-condition task. Gearbox tooth spalling may call for oil sampling, vibration analysis, or inspection during a planned outage. A low-consequence coupling-guard issue may need only a visual check. A noncritical auxiliary fan can remain run-to-failure if its loss does not create an unacceptable consequence.
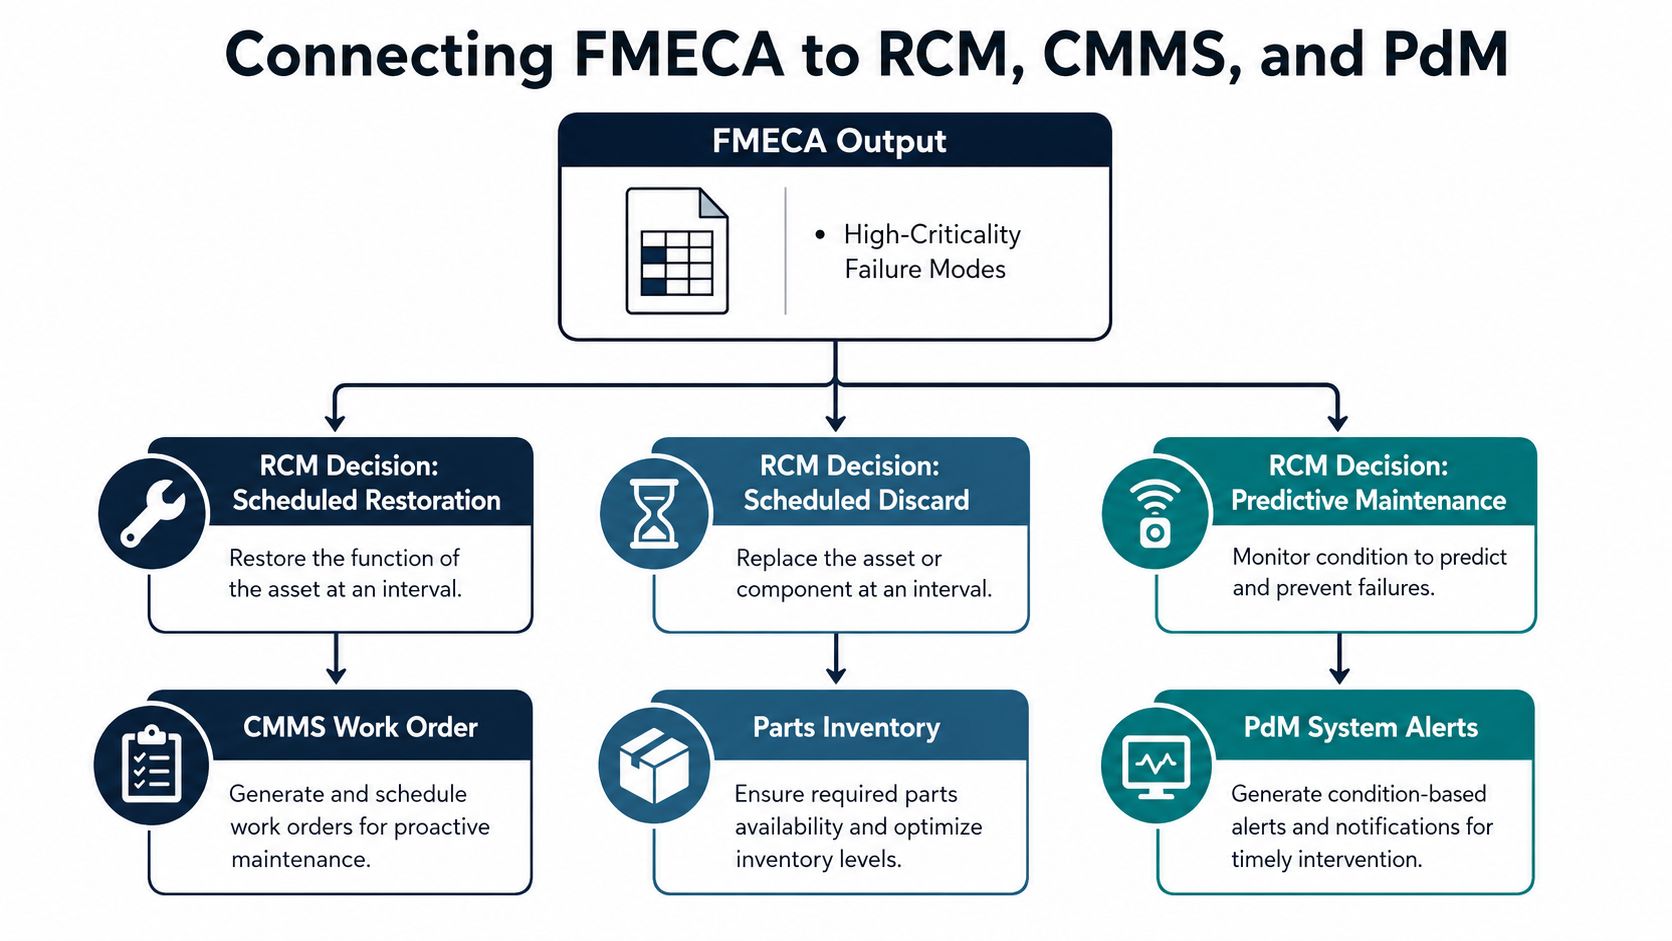
Convert detection into a measurement route
A detection score should specify a measurement, owner, trigger, and response. “Monitor condition” is not a usable maintenance task.
- Bearing defects: Collect vibration at defined measurement points. Review spectra for defect frequencies, harmonics, sidebands, and changes in overall energy.
- Gearbox damage: Use oil analysis to examine particles, viscosity, contamination, and wear evidence. Correlate the result with vibration findings.
- Electrical faults: Apply motor current signature analysis when the suspected mechanism involves rotor bars, electrical imbalance, or load-related behaviour.
- Thermal abnormalities: Use thermography on motor terminals, couplings, bearings, and accessible electrical connections.
- Leaks and flow restrictions: Use ultrasound, process pressure, flow, and operator observations when those signals can expose a developing fault.
The detection rating also tests whether the control is fast enough. A monthly visual inspection may miss a rapidly developing bearing defect, while continuous temperature data may provide earlier warning of motor overheating. Formal scoring supplies structure, but condition-monitoring evidence determines whether the interval works in practice.
Load the decision into the CMMS
Each selected task should become a CMMS record linked to the asset and failure mode. Include the procedure, frequency or trigger, required tools, acceptance criteria, and escalation path. Parts planning should follow the same logic. A single-point gearbox bearing may justify a reserved spare, while a low-consequence guard fastener may not warrant equivalent stock.
work order automation for manufacturers can connect approved task logic with assignment, scheduling, completion records, and escalation. The important control is traceability from the FMECA row to the maintenance plan, inspection result, and action taken.
A practical reliability-centered maintenance framework helps preserve that chain. For example, a time-based pump intervention can become vibration-monitored, condition-based maintenance when the failure mode is detectable and the monitoring route is reliable. Predictive maintenance intervals should therefore reflect defect development, measurement quality, and consequence. More inspections alone do not improve reliability. The task must match the failure mechanism.
Common FMECA Mistakes and How to Avoid Them
The equipment isn't always the source of a weak FMECA. The analysis itself can fail through generic scoring, incomplete boundaries, or excessive confidence in a tied RPN. Those process failures create a polished worksheet that still sends technicians toward the wrong work.
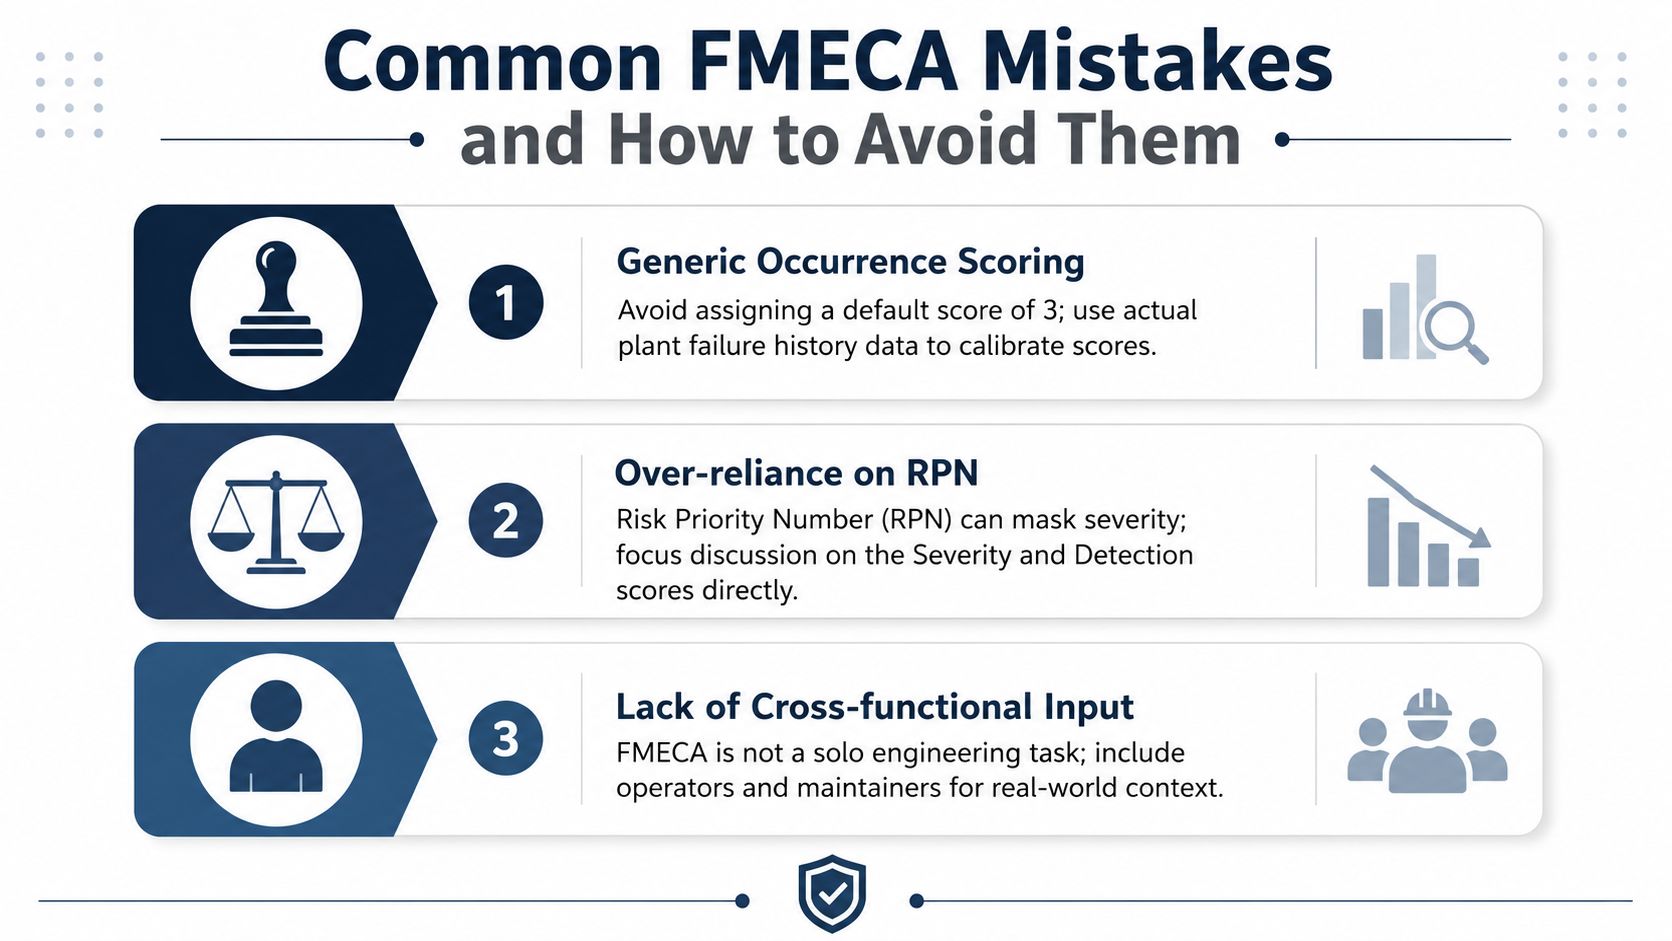
Generic occurrence scores
Some teams assign Occurrence = 3 to nearly every row because failure history is difficult to extract. That shortcut invalidates the ranking. A motor bearing with repeated work orders and a gearbox with no recorded failure evidence shouldn't receive the same occurrence assumption because the workshop lacks time to search the records.
The correction is practical:
- Mine the CMMS: Review work orders, failure codes, repair notes, and repeat interventions.
- Check field evidence: Include warranty claims, supplier findings, and service reports.
- Use condition data: Compare vibration, oil, thermography, ultrasound, and motor-current findings with the failure mode.
- Document uncertainty: If the evidence is sparse, record the limitation rather than presenting judgment as fact.
NASA guidance emphasizes using the best available data when ranking probability and criticality. The plant should therefore improve the occurrence term as its own data quality improves, rather than treating a workshop estimate as permanent.
Missing single points
A component-level review can miss the one relay, isolation valve, cooling fan, control-power supply, or utility connection that has no backup. The pump and motor may be mechanically healthy, but loss of a single cooling-water valve can still stop the train.
Operations personnel should walk the system boundary with the analysis team. The review should ask what happens when utilities disappear, controls fail, a standby doesn't start, or an operator must isolate one component. Single-point failures deserve explicit treatment because low frequency doesn't remove a severe consequence.
RPN paralysis
When many modes share the same RPN, teams can spend more time debating decimals than selecting controls. The solution is to apply an action threshold, inspect severity and detection separately, use a quantitative method where data supports it, and group equivalent modes into failure families.
A tied score is a prompt for engineering judgment, not proof that the risks are equal.
A technical review identifies late starts, omitted time-to-effect and time-to-detect information, missing single-point failures, and a lack of lifecycle-linked analysis as persistent weaknesses. The review on time-based failure analysis also reinforces the need to update FMECA as equipment, operating conditions, and maintenance practices change.
Implementation Roadmap and KPIs
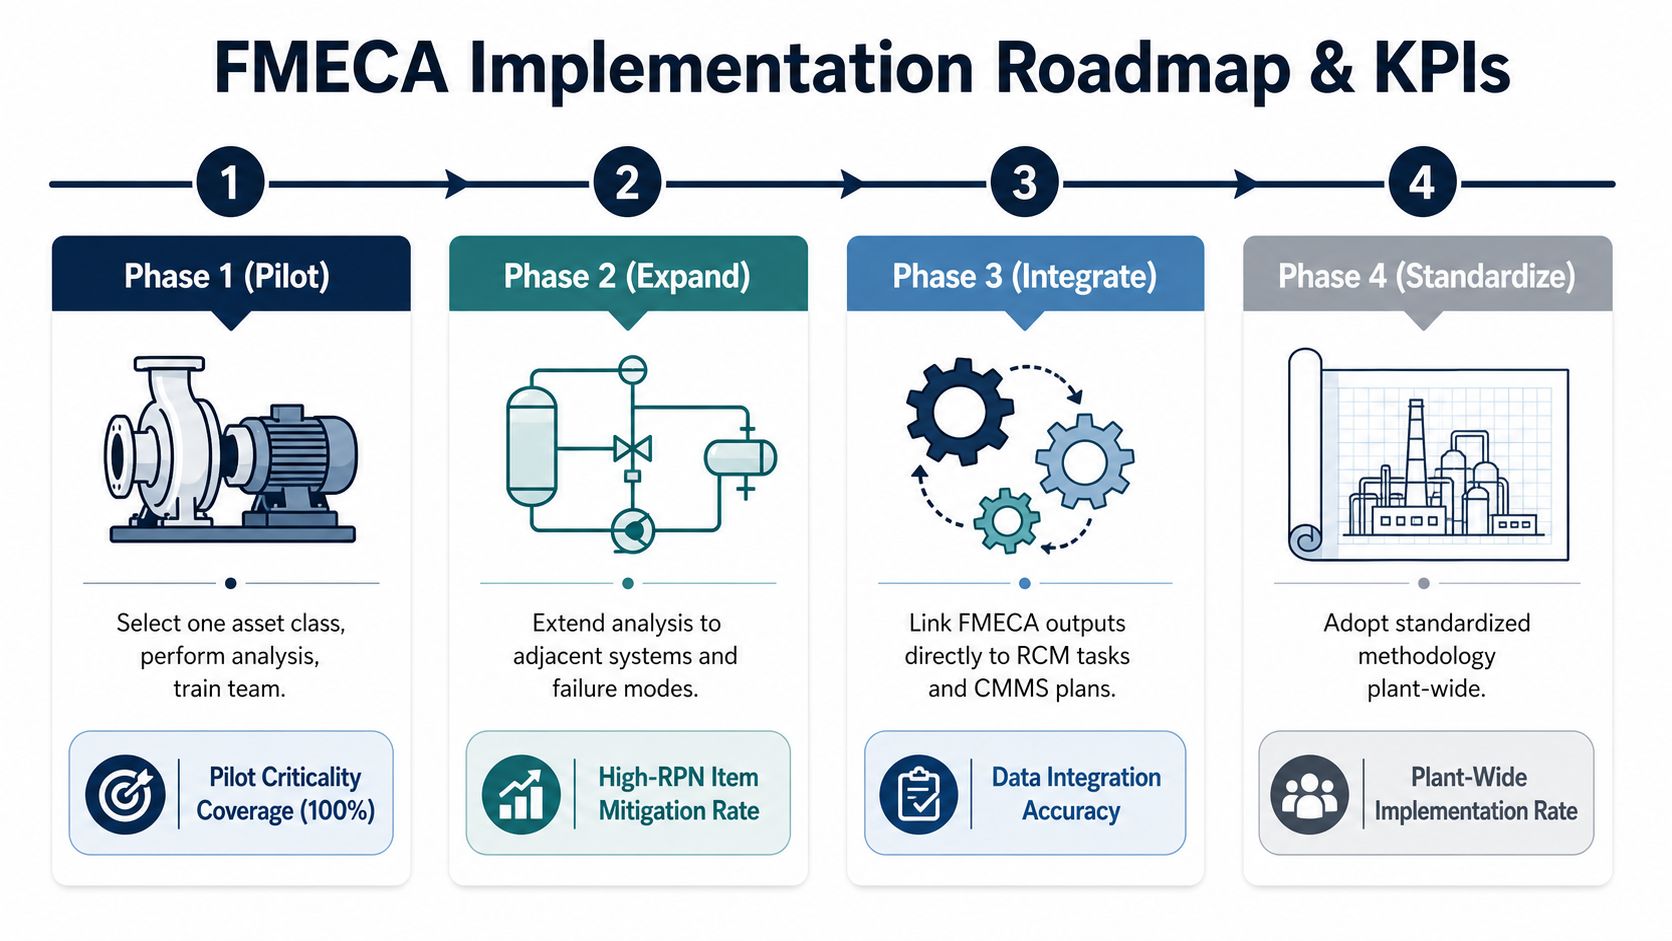
A plant-wide FMECA rollout works better when it starts with one asset class and proves the connection to execution. A critical pump class is often a useful pilot because the team can inspect bearings, seals, couplings, motors, and process effects within one manageable boundary.
Four phases
Phase one, pilot. Select one critical asset class, define the boundary, assemble reliability, maintenance, operations, and controls participants, and complete the analysis. Validate every high-ranked mode against recent work orders and available condition data.
Phase two, expand. Add adjacent systems and interfaces. For a pump train, that may include suction and discharge equipment, control power, standby equipment, lubrication systems, and the driven compressor.
Phase three, integrate. Convert approved actions into RCM decisions, CMMS job plans, inspection routes, spare-parts reservations, and response instructions. The worksheet should identify what triggers work and who owns the response.
Phase four, standardize. Establish common definitions, scoring guidance, naming conventions, review ownership, and change triggers across the plant. A multi-site organization should preserve the method while allowing local failure evidence to influence occurrence ratings.
A 90-day pilot checklist
- Choose scope: Select an asset class with meaningful consequence and accessible maintenance history.
- Form the team: Include operations, maintainers, reliability engineering, planning, and relevant controls or process specialists.
- Source evidence: Extract CMMS history, inspection findings, vibration results, oil reports, thermography observations, ultrasound findings, and motor-current records.
- Run workshops: Define functions first, then modes, effects, causes, controls, scores, and actions.
- Validate the ranking: Compare the highest-ranked modes with recent failures and known operating problems.
- Load execution: Create CMMS tasks, monitoring routes, spare decisions, owners, and acceptance criteria.
- Review closure: Confirm that actions changed the control, occurrence likelihood, detection capability, or consequence.
KPIs should measure risk reduction and execution, not worksheet volume. Useful measures include the criticality index, mean time between failures for top-ranked modes, PM compliance against FMECA-derived intervals, condition-monitoring coverage, action closure quality, and avoided downtime hours tied to documented interventions.
The plan may set internal targets such as covering 80% of high-criticality failure modes with condition-monitoring routes within six months or reducing unplanned downtime on pilot assets by 30% by month twelve. These are management targets, not universal benchmarks, so each plant should establish a baseline and document the measurement method before adoption.
Governance keeps the analysis alive. Reliability engineering can own the technical method and ranking logic, while maintenance planning owns task conversion, scheduling, and job-plan quality. Quarterly reviews should examine new failure evidence, and annual re-ranking should be triggered by major equipment changes, operating-duty changes, repeated failures, safety events, or significant monitoring findings.
Forge Reliability can assess a plant's pumps, motors, gearboxes, compressors, and related systems, then connect FMECA findings to condition monitoring, RCM decisions, CMMS work, and spare-parts strategy. Visit Forge Reliability to request a free reliability assessment and identify which failure modes deserve action first.