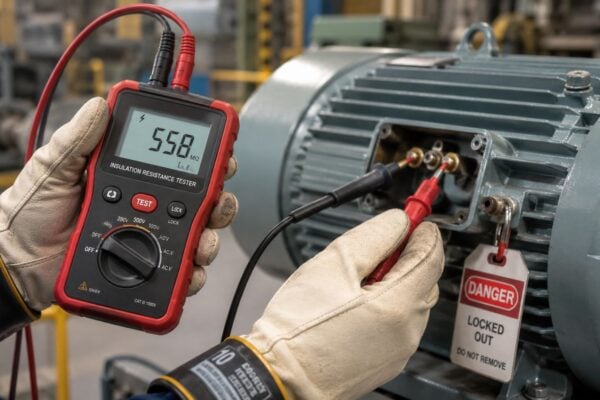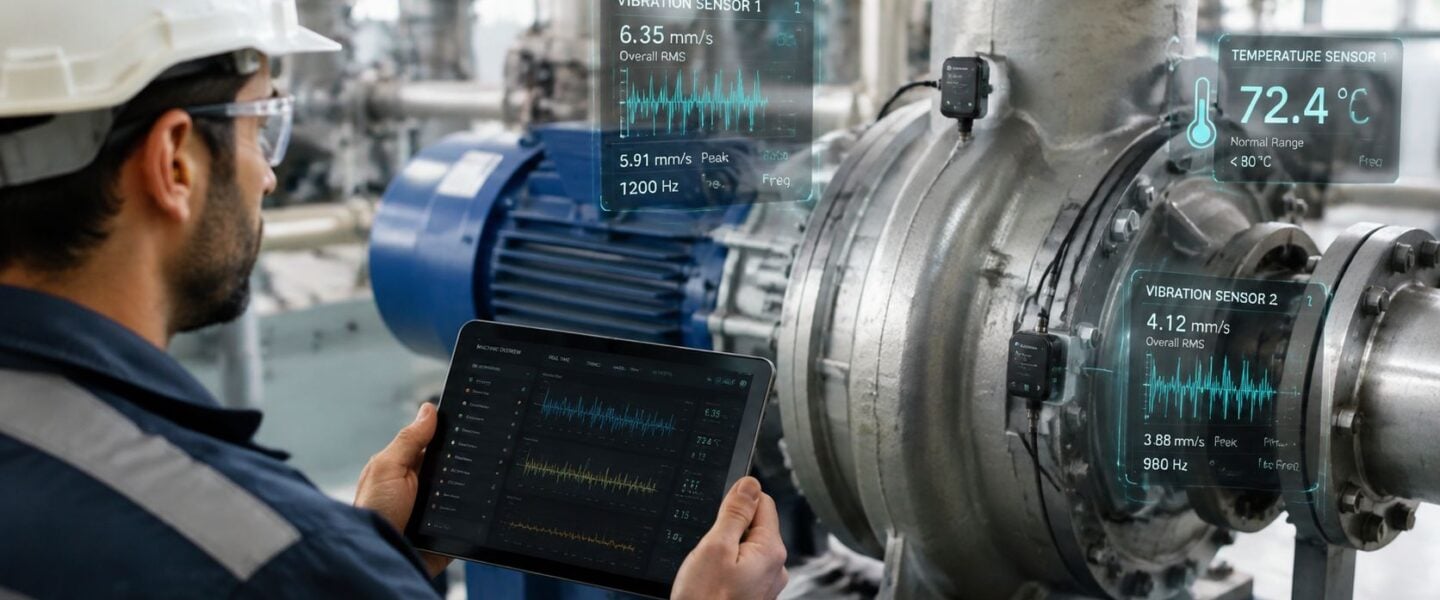
Condition monitoring is the practice of measuring equipment parameters such as vibration, oil condition, temperature, and motor current to detect degradation before failure, enabling maintenance teams to intervene based on actual asset health rather than calendar schedules. For industrial reliability, it supports metrics such as MTBF, MTTF, and availability, with availability commonly calculated as MTBF divided by MTBF plus MTTR.
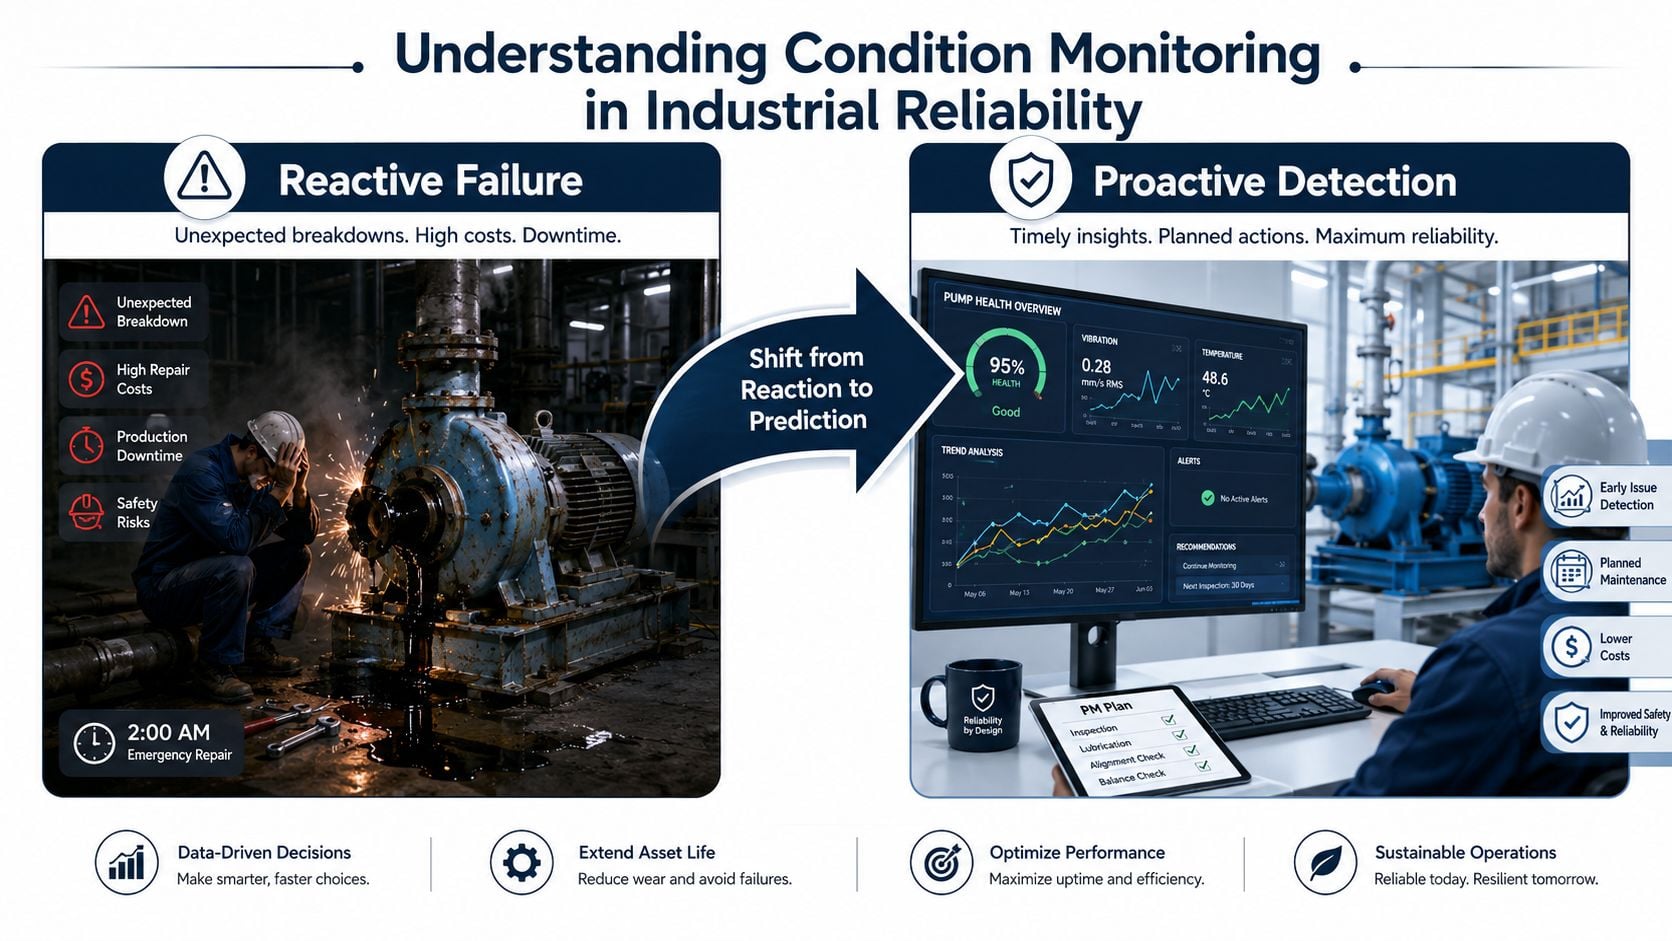
A centrifugal pump fails at 2 AM, production stops, and the maintenance team starts an emergency rebuild under pressure. Another plant sees a steady vibration increase weeks earlier, plans a bearing replacement during an outage, and avoids secondary damage and rushed procurement. The difference isn't better equipment. It's a maintenance decision made with usable evidence.
Table of Contents
- Understanding Condition Monitoring in Industrial Reliability
- Core Monitoring Techniques and Detectable Failure Modes
- Route-Based Versus Continuous Monitoring Architectures
- Choosing Which Assets and Failure Modes to Monitor
- Data Workflows and Measuring Program Success
- Implementation Checklist and Common Pitfalls to Avoid
Understanding Condition Monitoring in Industrial Reliability
Condition monitoring is often described as a sensor strategy, but that definition is too narrow. It's a decision framework that connects physical measurements to maintenance action. A reliability team collects evidence from vibration, oil condition, temperature, ultrasound, or motor current, interprets the change against an appropriate baseline, and decides whether to continue operating, inspect, repair, or replace an asset.
That process supports the reliability definition established in MIL-STD-721C, which frames reliability as the probability that an item performs its intended function for a specified interval under stated conditions. In practical plant terms, condition monitoring supplies information used to manage mean time between failures, mean time to failure, and availability. Availability is commonly calculated as MTBF divided by MTBF plus MTTR, or mean time to repair. A reduction in failure frequency or repair duration can therefore improve uptime even when the equipment itself hasn't changed. The reliability basis and its connection to oil analysis are discussed in this reliability and oil analysis reference.
The P-F curve creates the maintenance window
The P-F curve describes the interval between potential failure, when a developing defect can first be detected, and functional failure, when the machine can no longer perform its required duty. A bearing may begin producing a detectable vibration signature while the pump still delivers flow. That interval gives planners time to confirm the diagnosis, obtain parts, schedule labor, and complete the work safely.
Condition monitoring becomes valuable only when the measurement frequency and diagnostic capability fit that interval. A route collected after the functional failure point is merely a record of what went wrong. A permanent sensor may be unnecessary when the defect develops slowly and a properly timed route can identify it with enough planning time.
Why run-to-failure hides its real cost
Reactive maintenance can appear inexpensive because it avoids sensors, analysis, and planned inspections. The apparent saving disappears when a failed bearing damages a shaft, coupling, seal, or motor, or when production losses force overtime and expedited parts. An engineering source summarized in a government-published review of industrial maintenance technologies cites an annual condition-monitoring program cost of $15,000 to $30,000 for a facility with 25 to 50 critical motors, while a single major unplanned failure can exceed $25,000 after repair, production loss, emergency parts, and overtime.
The same source states that condition-based maintenance commonly runs at 8% to 12% of equipment replacement value annually, compared with 15% to 25% for run-to-failure. Those figures don't justify monitoring every machine. They support a more disciplined question: which assets expose the plant to enough production, safety, or repair risk to warrant earlier evidence?
A practical comparison of maintenance strategies appears in this guide to condition-based maintenance versus predictive maintenance. Condition monitoring is the evidence layer. Predictive maintenance is the broader strategy that uses that evidence to forecast risk and plan work.
Core Monitoring Techniques and Detectable Failure Modes
No single technology detects every failure mode. Vibration can identify a developing bearing defect, yet it may provide limited insight into lubricant contamination before dynamic symptoms become obvious. Oil analysis can reveal wear debris and additive depletion, but it isn't suitable for an asset without analyzable lubricant. Effective programs start with failure modes identified through FMEA, failure modes and effects analysis, or RCM, reliability-centered maintenance, then select the method that can detect those modes early enough to act.
| Technique | Detectable Failure Modes | Typical Equipment | Lead Time Before Failure | Relative Cost |
|---|---|---|---|---|
| Vibration analysis | Imbalance, misalignment, looseness, bearing defects, mechanical deterioration | Pumps, motors, fans, gearboxes, compressors, turbines | Often useful before functional failure, but depends on defect and operating conditions | Moderate for routes, higher for continuous systems |
| Oil and wear particle analysis | Lubricant degradation, contamination, water ingress, wear metals, gear and bearing wear | Gearboxes, compressors, turbines, hydraulic systems, slow-speed machinery | Can be early when wear debris forms before strong vibration appears | Low to moderate for sampling, higher for inline monitoring |
| Thermography | Electrical hot spots, insulation breakdown, friction, poor connections | Motor control equipment, switchgear, bearings, couplings, conveyors | Usually requires a temperature difference large enough to identify | Low to moderate |
| Ultrasonic inspection | Compressed-air leaks, steam-trap failures, friction, early-stage bearing defects | Pneumatic systems, steam systems, bearings, valves | Can identify high-frequency changes before audible or temperature symptoms | Low |
| Motor current signature analysis | Rotor-bar defects, air-gap eccentricity, electrical imbalance, some mechanical load problems | Induction motors, motor-driven pumps, fans, compressors | Depends on electrical signature and operating load | Moderate |
Match each method to the physical evidence
Vibration analysis is the primary method for rotating equipment because it can reveal imbalance, misalignment, looseness, and bearing defects through trend and frequency-domain analysis. Overall vibration is a severity screen, not a complete diagnosis. ISO 20816-3:2022 defines in-situ broadband vibration measurement for machines above 15 kW and between 120 r/min and 30,000 r/min, with criteria that vary by machine category and operating condition. The standard is explained in this technical discussion of ISO 20816 limitations.
Oil analysis examines the lubricant as a record of machine health. Wear particles, water, fuel dilution, oxidation, and additive depletion can point to the mechanism driving damage in bearings, gears, and hydraulic components. For very slow, heavily loaded, or noisy machinery, oil analysis may reveal deterioration before vibration or temperature changes become clear. A published screw-compressor study reported particle-count detection after 70 days and vibration detection after 148 days, a difference of 78 days, or 53% sooner for oil analysis in that study.
Thermography is effective when heat provides a clear physical signature. A loose electrical connection can create a hot spot, while friction can raise the temperature around a bearing or coupling. Surface reflectivity, load changes, and operating conditions can affect interpretation, so a thermal image needs equipment context rather than an isolated color comparison.
Ultrasound works at frequencies above ordinary human hearing. Technicians use it to locate compressed-air leaks, evaluate steam traps, and identify early bearing friction. Motor current signature analysis, or MCSA, analyzes electrical current patterns to identify rotor-bar defects and air-gap eccentricity, making it useful where electrical and mechanical conditions interact.
For oil systems, monitoring may include particle counts, water content, viscosity, total acid number, and elemental identification. A government research summary on real-time oil condition monitoring notes that particle counts can be separated into ferrous and nonferrous bins across particle-size ranges. In practice, a particle-count spike should trigger targeted inspection, not an automatic component replacement.
Teams evaluating vibration analysis tools should therefore begin with the failure signature, operating context, and required lead time. Technology selection comes after that analysis.
Route-Based Versus Continuous Monitoring Architectures
A process feed pump begins showing a small vibration change after a maintenance job. If that pump is inspected once each month, the plant may miss a developing fault between routes. A permanent sensor could provide enough warning to schedule an intervention, but the same investment may add little value on a redundant cooling-water pump. Architecture should follow the failure risk, available warning time, and response capability.
Route-based monitoring fits slower and less critical risks
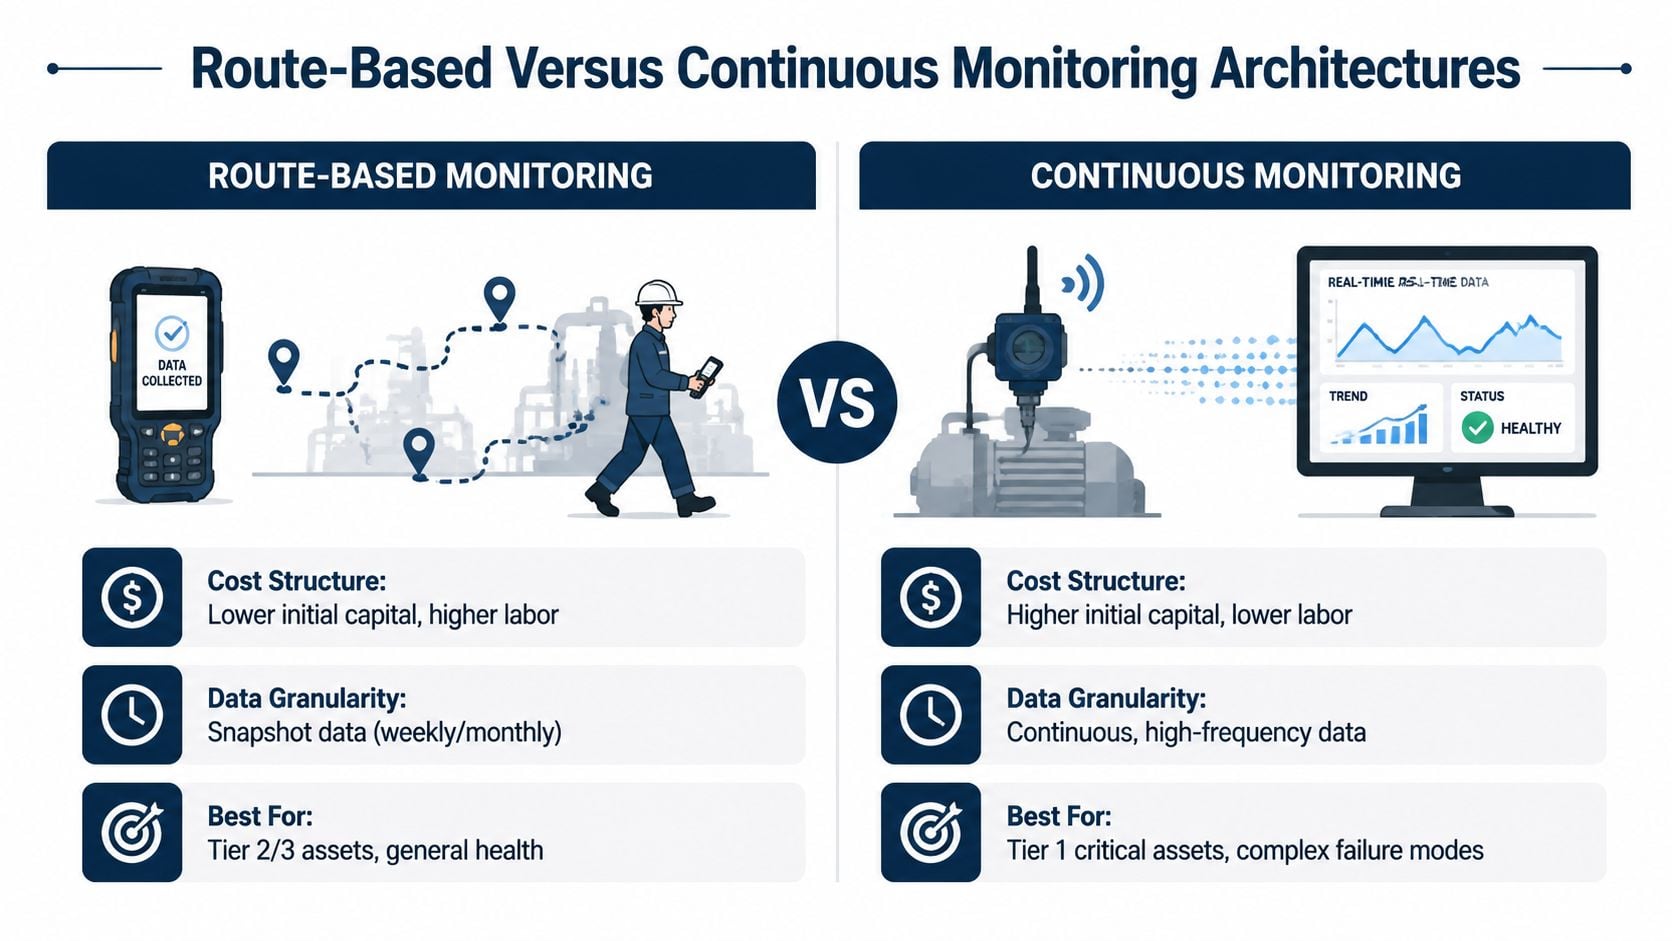
Route-based inspection suits balance-of-plant assets when degradation develops gradually, operating conditions remain reasonably stable, and the plant can schedule corrective work. A technician can collect vibration and temperature readings from pumps, fans, or motors, compare each measurement with its own history, and refer abnormal trends for analysis.
The main benefit is lower initial capital. The trade-offs are technician time, equipment access, and sampling gaps. A route can miss a fault that develops between inspections. Readings also lose value when technicians fail to record load, speed, process conditions, or recent maintenance. Consistent measurement points and disciplined collection procedures determine whether route data remains useful.
Continuous monitoring protects high-consequence equipment
Permanent sensors become practical when a short warning window can prevent a major production interruption, secondary damage, or unsafe intervention. A critical process feed pump, compressor, turbine, or large motor may justify high-frequency measurements because a missed change could stop an entire production train.
Continuous monitoring also creates work beyond sensor installation. The plant must maintain sensor reliability, communications, historian storage, alarm settings, cybersecurity controls, analyst review, and work-order response. Data volume has little value when alarms do not lead to defined decisions.
Practical rule: Continuous monitoring earns its place when missing a developing fault costs more than installing, operating, and supporting the monitoring system.
The hybrid architecture usually wins
Mature programs commonly combine both approaches. Permanent monitoring covers the assets and failure modes that can progress faster than inspection routes allow. Route-based inspections cover important equipment with longer warning periods. Operator rounds or run-to-failure may suit low-consequence assets with inexpensive, accessible replacements.
Teams can use this condition monitoring systems overview to compare sensing, data collection, and analysis requirements. The design decision remains economic and operational. Assign continuous coverage where warning time protects production, safety, or expensive equipment. Use routes where periodic evidence gives the team enough time to confirm the fault, plan the work, and intervene.
Choosing Which Assets and Failure Modes to Monitor
Installing more sensors doesn't automatically improve reliability. Unfiltered data can create false alarms, increase analyst workload, and weaken confidence in the program. Research on condition-based maintenance implementation has identified a recurring problem: collected data is often not fit for purpose, and organizations struggle to decide what to collect and how to use it. The overview of condition monitoring and its implementation challenges reinforces why asset selection must precede instrumentation.
Rank the asset before selecting the sensor
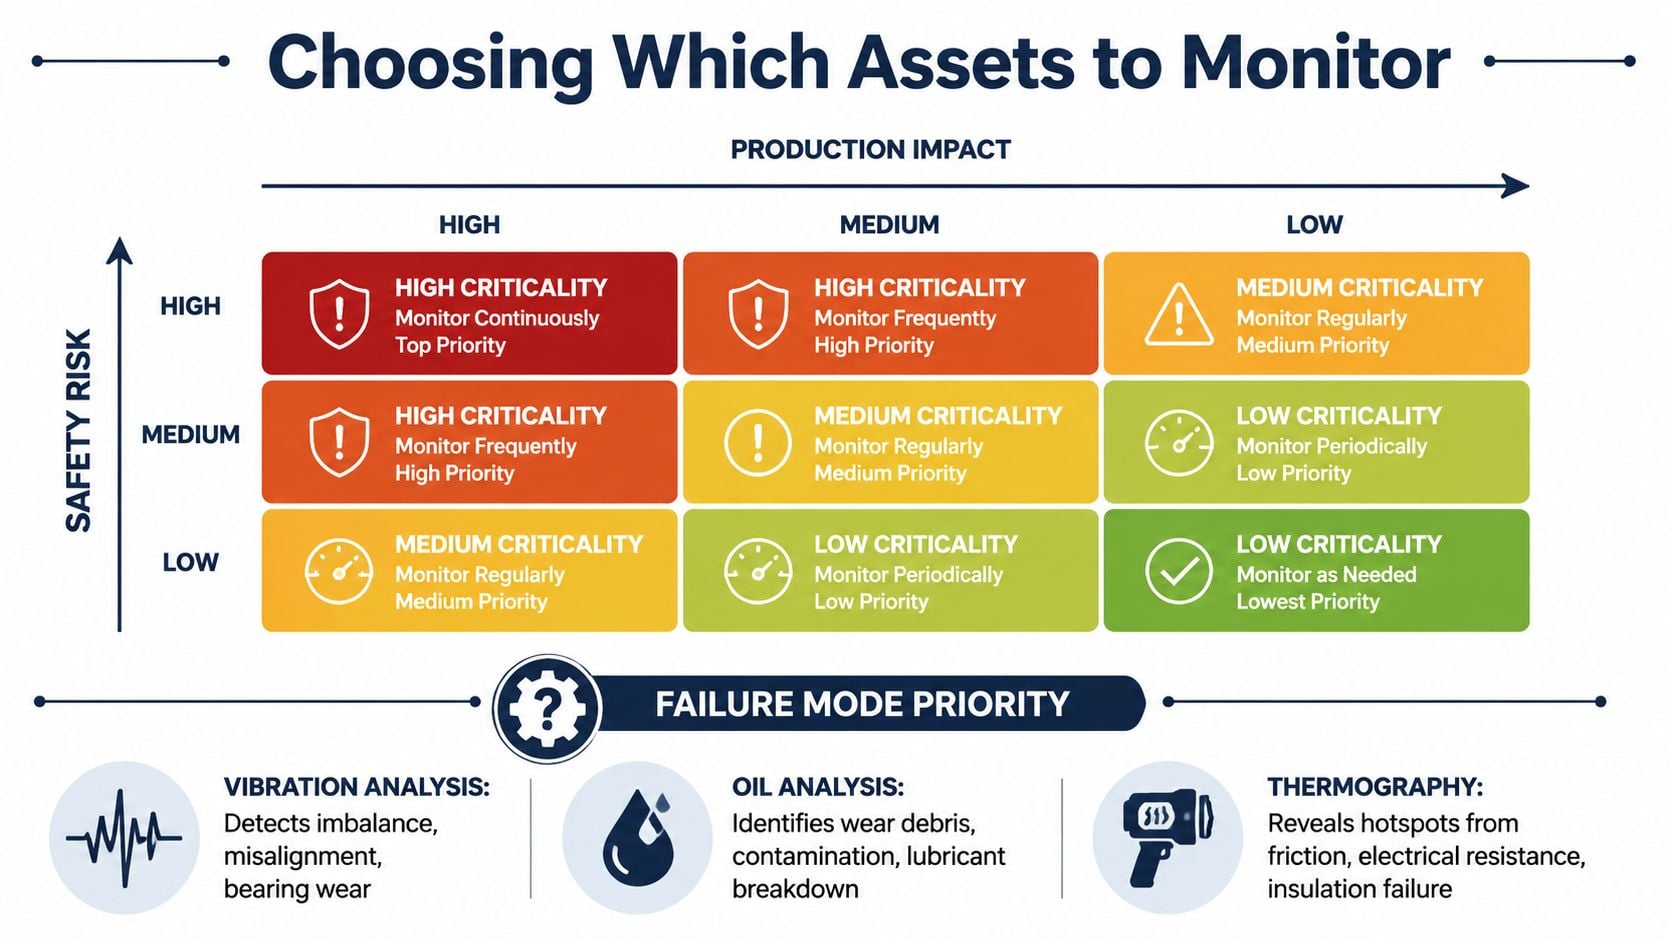
A useful criticality matrix combines production impact, safety risk, environmental consequence, and repair cost. A machine near the high end deserves a deeper failure-mode review. A redundant cooling-water pump with a readily available spare may need only operator rounds or a route inspection, even if it looks similar to a critical process pump.
Consider two centrifugal pumps. The first is the sole feed pump for a production process. Bearing wear, coupling misalignment, seal failure, or imbalance could interrupt the process and cause secondary damage. Continuous vibration monitoring may be justified because the value of early warning is high. The second is one of several redundant cooling-water pumps. Route-based vibration, temperature checks, and operator inspection may provide sufficient coverage.
Map failure modes to detection methods
Once the asset is ranked, the team should identify how it fails and what physical evidence appears first.
- Bearing wear: Use vibration for dynamic changes and oil analysis when debris generation or lubricant condition is relevant.
- Misalignment and imbalance: Use vibration with phase and frequency-domain diagnostics, then verify alignment, soft foot, foundation condition, and coupling installation.
- Lubrication breakdown: Use oil condition, particle counts, temperature, and vibration together, especially on gearboxes, compressors, and hydraulic systems.
- Electrical deterioration: Use thermography for hot spots and MCSA for motor electrical signatures.
- Leakage or friction: Use ultrasound where compressed air, steam, valves, or early bearing friction create high-frequency evidence.
Let the P-F interval determine inspection frequency
The P-F interval is the available time between detectable degradation and functional failure. If a bearing defect normally develops over weeks or longer, a well-designed monthly route may provide enough opportunity to detect and plan the repair. If the interval can collapse within days, a route may be too sparse, and continuous monitoring becomes more defensible.
The exact interval must come from equipment history, failure-mode analysis, manufacturer information, and observed trends. It shouldn't be assumed from a generic monitoring template. The reliability-centered maintenance framework provides a structured way to connect asset consequences, failure modes, and maintenance tasks.
Data Workflows and Measuring Program Success
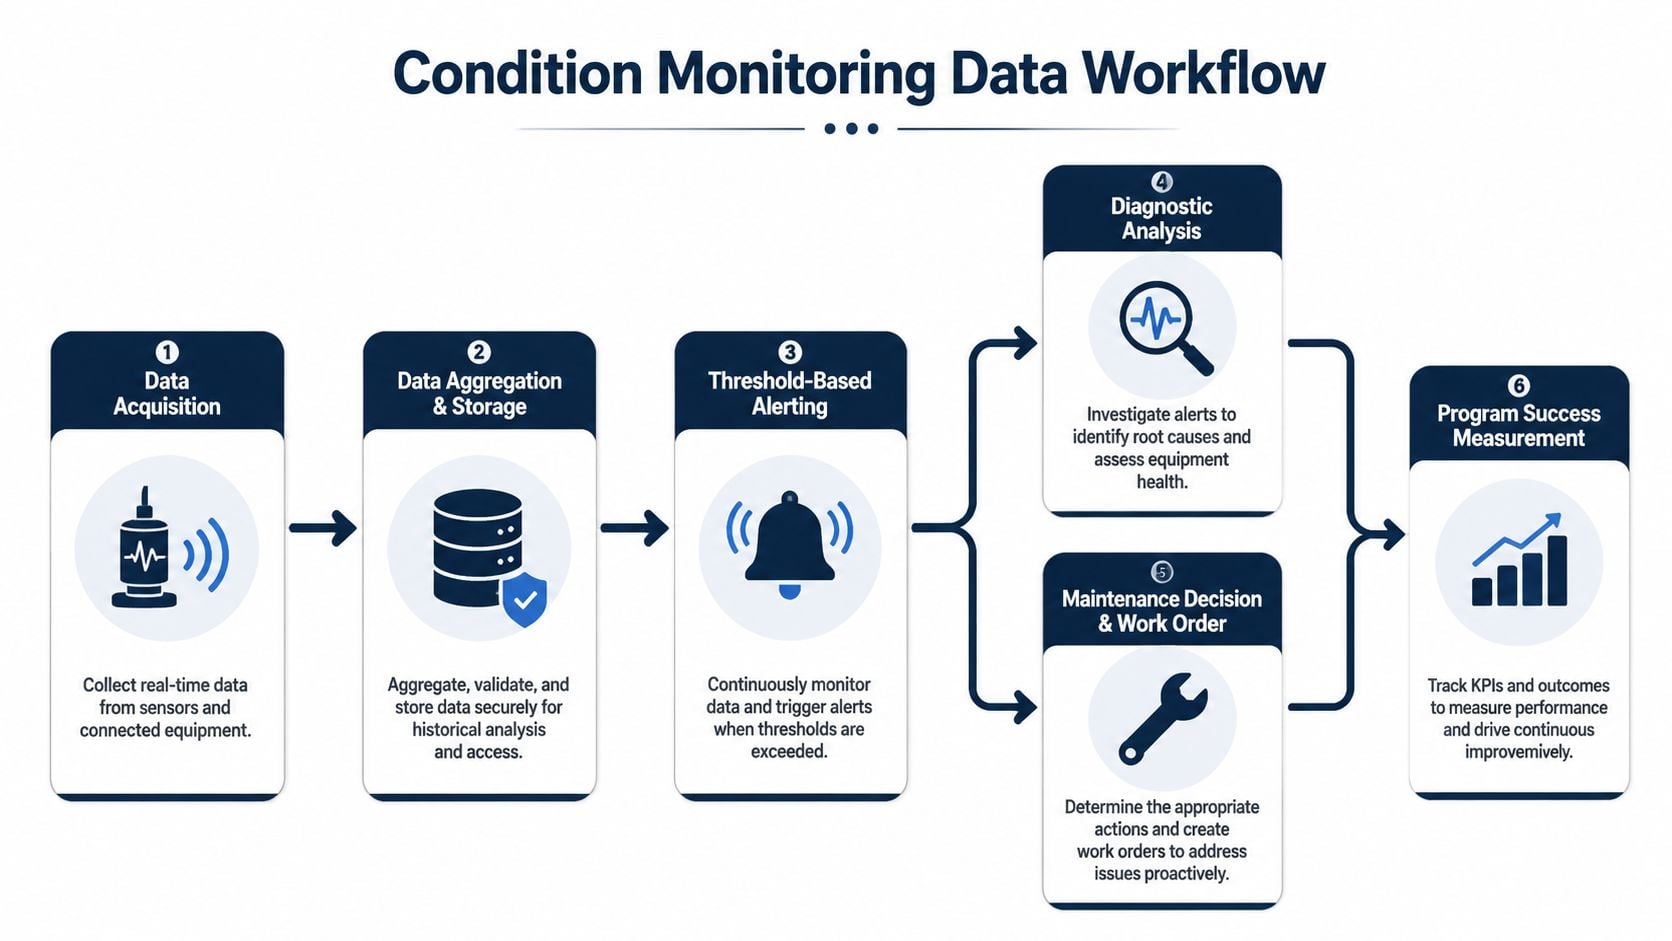
A condition-monitoring program earns its keep only when a measurement changes a maintenance decision. The workflow must connect data collection, interpretation, work execution, and feedback. Otherwise, the plant accumulates readings without improving reliability.
Build a closed decision chain
A practical workflow includes:
- Data acquisition: A technician or permanent sensor records vibration, oil condition, temperature, ultrasound, or motor-current data at defined points.
- Data aggregation and storage: Associate each result with the correct asset, location, operating state, and date.
- Threshold-based alerting: Compare current conditions with baseline values, severity zones, or approved alarm limits.
- Diagnostic analysis: A qualified analyst reviews spectra, phase, oil results, thermal patterns, operating conditions, and previous work history.
- Maintenance decision and work order: The team selects continued operation, increased monitoring, inspection, repair, or replacement, then records the decision in the CMMS. Clear CMMS asset management practices keep findings, work orders, and repair feedback connected to the asset record.
- Program success measurement: Confirm that the action corrected the condition and check whether the same fault returned.
Alarm design requires care. ISO 10816-1 defines an alarm as a warning that a vibration value has been reached or that a significant change has occurred. Operation can usually continue for a period while the cause is investigated and corrective action is identified. An alarm therefore supports a decision rather than automatically commanding a shutdown. Guidance on vibration alarm limits and baseline establishment supports machine-specific limits instead of universal thresholds.
Track leading and lagging indicators
Management needs evidence that monitoring changes outcomes. Useful measures include:
- Condition-based work orders: Count inspections or repairs initiated by monitoring findings.
- Unplanned downtime: Compare downtime for monitored assets over time.
- MTBF: Check whether monitored equipment fails less often.
- Avoided failure cost: Document emergency repair, production loss, overtime, and secondary damage prevented by the intervention.
- Proactive-to-reactive work ratio: Confirm that maintenance is shifting toward planned work before overall equipment effectiveness improves.
Program ROI compares sensors, software, analyst time, training, and integration costs with avoided emergency work and production losses. Use documented work orders and outage records. Do not credit every favorable outcome to the program without evidence.
Implementation Checklist and Common Pitfalls to Avoid
A practical implementation starts with scope, not hardware. The team should choose a small group of high-consequence assets, define detectable failure modes, and establish how each alert will become a maintenance action.
A phased implementation sequence
- Rank asset criticality: Combine production impact, safety risk, environmental consequence, and repair exposure.
- Map failure modes: Use FMEA or RCM to identify bearing wear, misalignment, lubrication breakdown, electrical faults, seal problems, and other credible modes.
- Select the technology: Match vibration, oil analysis, thermography, ultrasound, or MCSA to the physical evidence produced by each failure.
- Pilot the program: Deploy the approach on three to five high-criticality assets and use the results to test data quality, analyst workload, alarm logic, and work-order response.
- Collect baselines: Measure healthy operating conditions across relevant loads, speeds, and process states.
- Tune alarms: Separate caution, warning, and critical conditions so technicians know which alerts require observation, investigation, or immediate action.
- Integrate the CMMS: Connect findings to asset records, failure codes, job plans, parts, labor, and completed repair feedback.
- Train the team: Teach operators what to observe, technicians how to collect repeatable data, and planners how to schedule condition-based work.
- Assign a program champion: Give one accountable leader authority to enforce data quality, response times, and follow-through.
Pitfalls that destroy confidence
Skipping baseline measurements makes trend data difficult to interpret. Setting thresholds too low floods the team with false positives, while thresholds set too high delay action. Both problems train technicians to ignore alarms.
A program also fails when the work order closes without recording the confirmed failure mode, repair condition, and post-maintenance measurement. That breaks the feedback loop and prevents the team from learning whether the diagnosis was correct. Expanding across the plant before proving value on the pilot assets creates data overload and spreads limited analyst attention too thin.
The strongest programs treat condition monitoring as a reliability operating process, not a technology installation. They monitor the assets whose failures matter, detect the modes that produce actionable evidence, and give a named person responsibility for turning that evidence into completed work.
Forge Reliability offers condition monitoring and reliability consulting that can define critical assets, map failure modes, select route-based or continuous monitoring, and integrate vibration, oil analysis, thermography, ultrasound, and motor current data into maintenance decisions. Request a free reliability assessment by visiting Forge Reliability to identify the highest-ROI monitoring opportunities and build a practical implementation roadmap.