
A plant usually doesn't decide to improve operation and maintenance during a calm week. The shift happens after a line stops, a pump trips on overload, a gearbox starts screaming, or a packaging system drops output at the exact moment production needs it most. Operations wants the asset back now. Maintenance is hunting parts. Engineering is trying to explain why the same failure keeps returning under a different work order description.
That pattern is the problem. A reactive plant doesn't just suffer breakdowns. It loses control of priorities, labor, spare parts, and decision quality. Modern operation and maintenance is the discipline of taking that control back, asset by asset, failure mode by failure mode, with better strategy, cleaner data, and tighter execution.
Table of Contents
- Beyond the Firefight Moving from Reactive to Strategic O&M
- The Core of Modern Operation and Maintenance
- Choosing Your Maintenance Strategy Mix
- Integrating Predictive Technologies into O&M
- The Role of CMMS and Reliability Metrics
- Building Your O&M Implementation Roadmap
- Conclusion Take Control of Your Asset Reliability
Beyond the Firefight Moving from Reactive to Strategic O&M
A common scenario in manufacturing looks like this. A critical conveyor drive motor overheats during peak production. The backup plan is weak, the spare isn't ready, and the root cause discussion gets postponed because everyone is focused on restoring output. A few days later, the line runs again, but nothing structural has changed. The plant is still one fault away from the next scramble.

Operation and maintenance is often misunderstood. In too many facilities, it's treated as a repair function that spends money after failure. That view collapses under real plant economics. In industry surveys, maintenance can account for 20%–50% of a facility's total operating budget, while unplanned downtime can cost Fortune Global 500 companies 11% of annual turnover, with costs reaching as high as $2 million per hour in automotive manufacturing, according to industry downtime and maintenance cost data.
A plant manager doesn't need a lecture to understand that risk. The evidence is already on the floor. Repeated seal failures on process pumps. Unexplained trips on air compressors. Heat-damaged terminations inside motor control centers. Each event drains labor, disrupts planning, and forces operations to chase recovery instead of throughput.
Practical rule: If the weekly schedule keeps getting replaced by emergencies, the site doesn't have a maintenance workload problem. It has a strategy and control problem.
Strategic O&M starts by treating uptime as a managed outcome. That means ranking assets by business risk, protecting the equipment that constrains production, and building enough visibility to act before defects become failures. Plants that want stronger operational resilience usually discover that resilience isn't an abstract corporate concept. It's built through disciplined planning, defect detection, and fast, accurate response at the asset level.
For a plant still buried in emergency work, the first useful shift is mental. O&M isn't the team that fixes what production breaks. It's the operating system for reliability. That shift becomes clearer when reliability leaders connect recurring failures to patterns already familiar in manufacturing equipment reliability challenges, such as poor lubrication control, weak work-order history, and chronic deferral of known defects.
The Core of Modern Operation and Maintenance
Operation and maintenance works best when it is run as a plant control system, not a repair department. The point isn't just to close work orders. The point is to control failure probability, labor efficiency, safety exposure, and asset life through disciplined decisions.
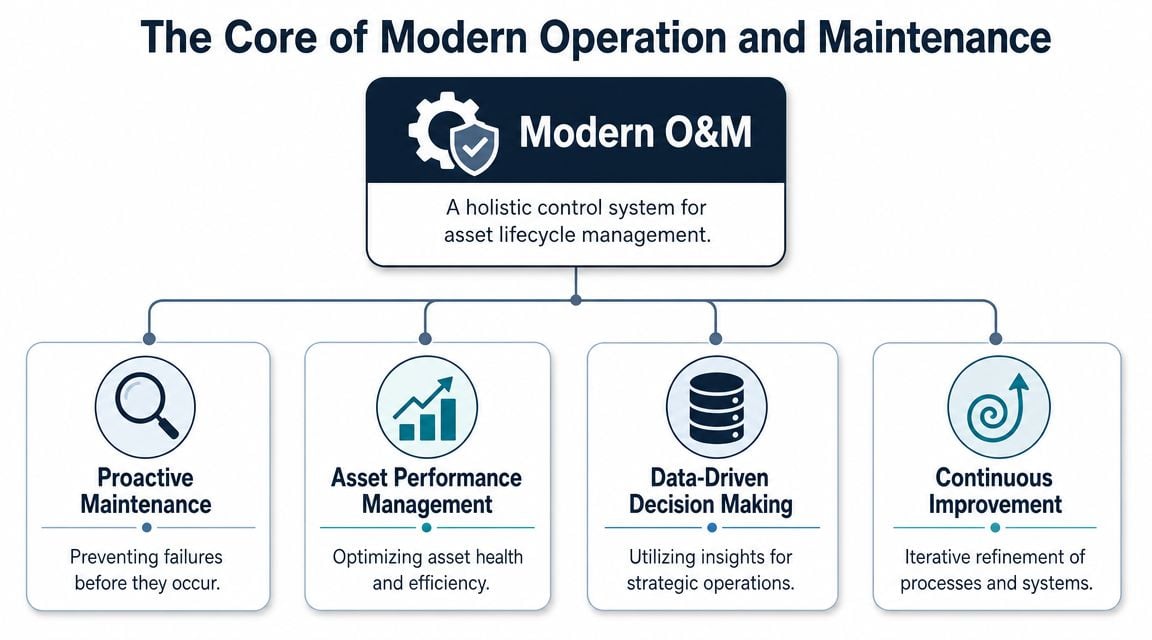
Federal guidance defines O&M as the decisions and actions for the control and upkeep of property and equipment, including scheduled, preventive, predictive, and unscheduled actions aimed at preventing equipment failure while improving efficiency, reliability, and safety, as described in federal O&M best-practice guidance. That definition matters because it moves the discussion away from wrench-turning alone and toward coordinated control of asset performance.
Why O&M is a control system
A mature O&M program answers four questions clearly:
- What must not fail: These are the assets that limit production, create safety risk, threaten quality, or trigger environmental exposure.
- How do they fail: Not in general terms, but in specific modes such as bearing fatigue, cavitation, insulation breakdown, coupling misalignment, contamination, or thermal damage.
- How will the plant detect deterioration: Through operator rounds, route-based inspections, instrument trends, condition monitoring, or continuous sensing.
- What action follows detection: Work order creation, priority assignment, repair planning, parts staging, and shutdown coordination.
In a food and beverage plant, a packaging line shows this clearly. The filler may be the throughput constraint, but the line's real risk often sits in supporting assets such as a conveyor gearbox, compressed air system, or case packer servo motor. If operations changes product mix and line speed without maintenance feedback, the stress pattern on those assets changes. O&M becomes effective when reliability, maintenance, and production make those trade-offs together instead of in isolation.
Who owns what in the plant
The strongest programs define responsibilities without creating silos.
- Reliability engineer: Owns failure analysis, criticality logic, maintenance strategy selection, and long-term defect elimination.
- Maintenance planner: Turns identified work into executable jobs with labor, parts, permits, and sequencing ready before the outage window opens.
- Maintenance manager: Balances craft capacity, schedule adherence, backlog health, and emergency response.
- Operations leader: Protects production while giving planned work the access it needs. Without this role, even good maintenance strategy stalls.
In plants that improve, operations stops asking, "Can maintenance do this later?" and starts asking, "What happens if this defect stays in service another week?"
A useful benchmark for collaboration is whether all four roles can make one coherent decision on a single asset. For example, on a packaging line motor with rising temperature and repeated overload resets, the reliability engineer should identify likely failure modes, the planner should build a corrective job, the maintenance manager should reserve labor and parts, and the operations leader should approve a window before the motor fails in service.
That is also where digital coordination matters for maximising manufacturing shop floor efficiency. Better planning systems don't replace maintenance judgment, but they make it easier to align production windows, parts readiness, and maintenance execution around the assets that matter most.
Choosing Your Maintenance Strategy Mix
No serious plant runs every asset the same way. Some equipment should be left alone until failure. Some needs time-based preventive work. Some should be inspected on route. Some justifies full predictive monitoring. The mistake is forcing one maintenance philosophy across unlike assets.
Run-to-failure has a place
Run-to-failure is often criticized, but the strategy itself isn't the problem. Misapplying it is. A cheap, non-critical exhaust fan with no safety, quality, or production consequence may be a reasonable run-to-failure candidate if the spare is stocked and replacement is simple. A boiler feed pump, ammonia compressor, or process agitator is not.
Condition-based maintenance and predictive maintenance do better when the failure mode gives detectable warning. Predictive maintenance uses sensor data to identify deterioration, and condition-based maintenance triggers work at thresholds. For detectable failure modes, they outperform fixed-interval preventive work and improve MTBF while reducing MTTR, according to guidance on maintenance operations and condition monitoring.
Comparison of Industrial Maintenance Strategies
| Strategy | Trigger | Best For | Pros | Cons |
|---|---|---|---|---|
| Run-to-Failure | Functional failure | Low-cost, non-critical, easy-to-replace assets | Minimal planning effort, simple to administer | High disruption if applied to important assets, no early warning |
| Preventive Maintenance | Time, cycles, or operating hours | Wear items with known service intervals and stable duty conditions | Easy to schedule, useful where degradation isn't easily measured | Can over-maintain healthy assets, can miss random failures |
| Condition-Based Maintenance | Threshold change in a measurable condition | Assets where temperature, vibration, pressure, lubrication state, or similar indicators show degradation | Intervenes when needed, reduces unnecessary PM work | Requires inspection discipline, alarm limits, and response logic |
| Predictive Maintenance | Trend analysis from route-based or continuous data | Critical assets with detectable failure patterns and meaningful downtime consequence | Better early warning, supports planned correction before secondary damage spreads | Needs data quality, trained interpretation, and work-order follow-through |
Plants usually need all four.
A utility water pump motor may sit on a simple PM schedule for cleaning, lubrication checks, and electrical inspection. A reactor agitator gearbox in a chemical plant may need vibration trending, oil analysis, and periodic thermography because failure can stop a batch, damage product, and create cleanup risk. A small office HVAC fan motor may remain run-to-failure because the consequence is minor and replacement is straightforward.
A reactor agitator example
Consider a chemical reactor agitator with a history of seal leakage and high vibration after every campaign changeover. A preventive-only approach might set a fixed inspection and lubrication interval, then hope that scheduled attention catches degradation in time. Sometimes it will. Sometimes it won't, especially if process conditions vary between campaigns.
A better approach starts with the actual failure modes:
- Misalignment after maintenance work: Shows up in vibration signatures and often drives coupling and bearing stress.
- Lubricant contamination: Visible through oil condition changes and often tied to seal or breather issues.
- Mechanical looseness: May appear after repeated thermal cycling or poor torque control.
- Process-induced overload: Often linked to viscosity changes or agitator fouling.
A PM task that doesn't target a failure mode is just scheduled activity.
For strategy selection, the plant should ask three direct questions:
- What is the consequence of unexpected failure?
- Does the failure mode develop in a way that can be detected?
- Can the plant act on the warning before functional failure?
If the answer to all three favors monitoring, the agitator deserves more than a calendar-based PM. That is the practical difference covered in this guide to predictive versus preventive maintenance comparison. The decision isn't philosophical. It's about criticality, detectability, and response time.
Integrating Predictive Technologies into O&M
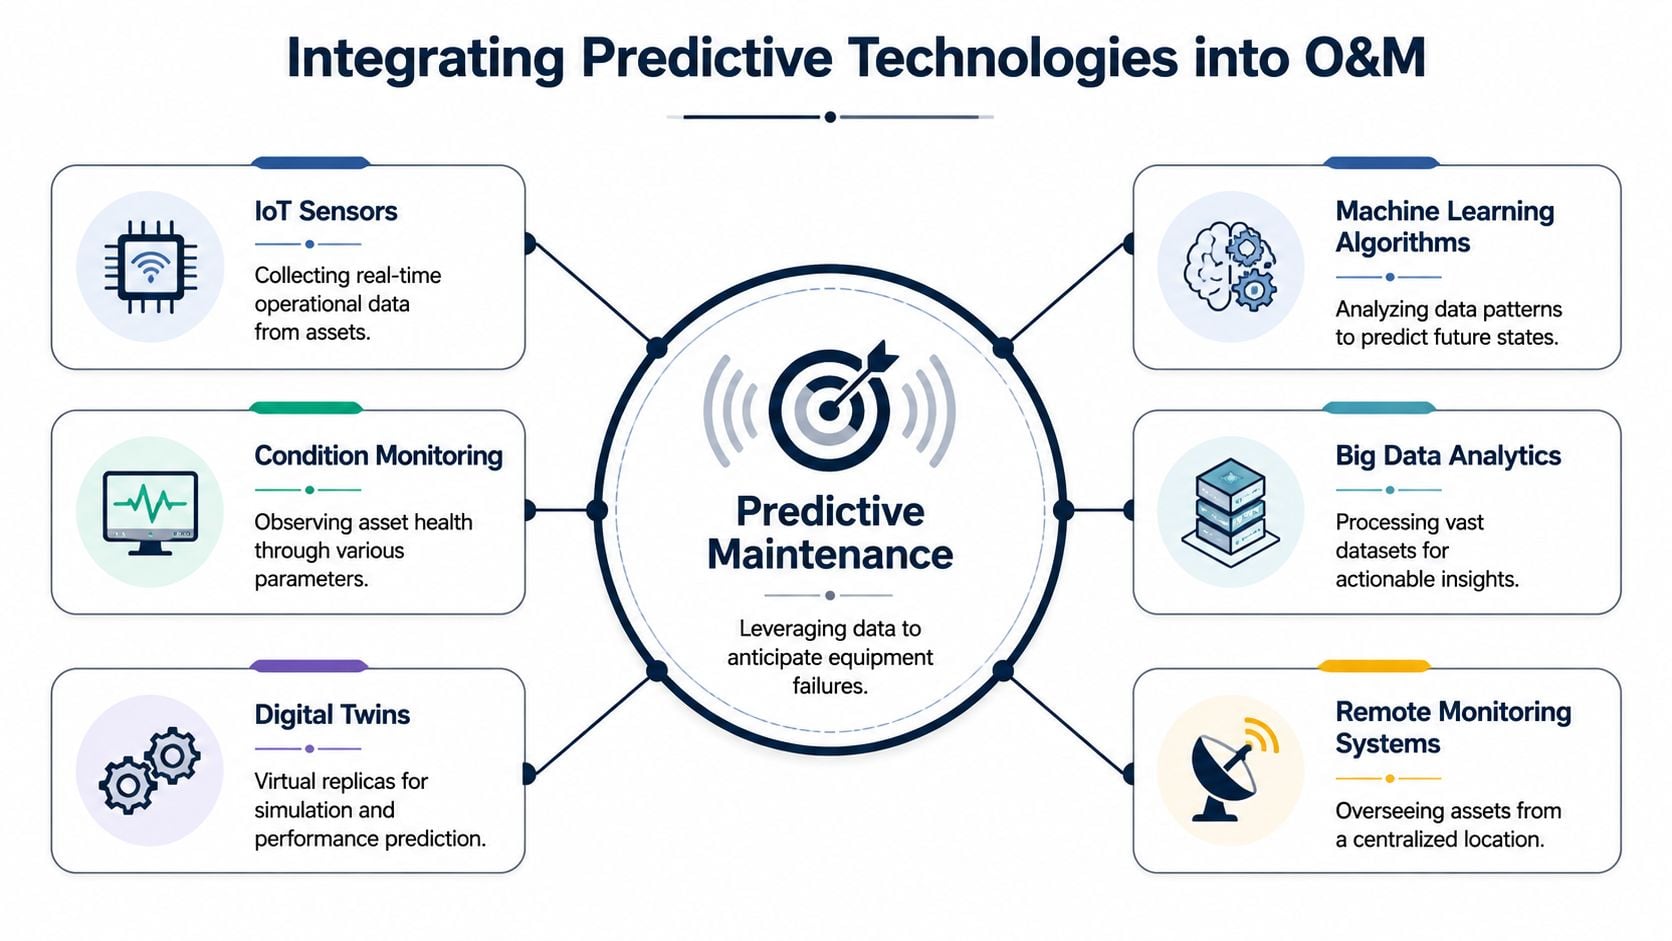
Predictive maintenance fails when plants treat technology as a bolt-on. It works when each diagnostic method is matched to a specific failure mode, assigned to the right assets, and tied directly to work execution.
Match the technology to the failure mode
Vibration analysis is the primary tool for rotating equipment because it sees mechanical defects early. It helps detect imbalance, misalignment, looseness, bearing deterioration, resonance, and gear defects in pumps, motors, compressors, and gearboxes. It becomes especially valuable when the plant needs to know not just that something is wrong, but what kind of mechanical fault is developing.
Infrared thermography serves a different role. It detects abnormal heat patterns in electrical connections, switchgear, MCC buckets, overloaded circuits, refractory loss, and some mechanical defects that generate frictional heating. It is often the fastest way to find a loose electrical termination before it escalates into arc damage or an unexpected trip.
Oil analysis looks inside the machine where line-of-sight tools can't. It identifies lubricant degradation, contamination, water ingress, wear metals, and evidence of internal distress in gearboxes, hydraulic systems, and large bearing systems. If a gearbox repeatedly fails despite good external alignment, oil data often reveals whether contamination control is the missing discipline.
Airborne ultrasound excels at finding compressed air leaks, steam trap problems, electrical arcing, and very early rolling-element bearing defects. In many plants, it delivers value quickly because leak detection and electrical inspection can be added without major installation work.
Motor current signature analysis helps where motor-driven systems show electrical or load-related instability. It can support diagnosis of rotor bar issues, supply imbalance, and certain load anomalies that don't always present clearly in mechanical data alone.
A practical deployment model often combines route-based collection for broad coverage and continuous monitoring for the small group of assets whose failure consequence is severe. Plants without internal specialists sometimes use predictive maintenance support services to define routes, alarm logic, technology mix, and reporting workflows, especially for pumps, compressors, motors, and turbine auxiliaries.
A power plant example
In a power generation facility, different predictive tools protect different risks on the same process train.
A boiler feed pump train may use vibration monitoring to track bearing condition, shaft alignment, and hydraulic instability. At the same time, infrared thermography can inspect switchgear, bus connections, and motor terminations feeding that train. One tool protects the mechanical path. The other protects the electrical path. Both matter because either fault can cause forced outage.
A practical field sequence might look like this:
- Monthly vibration route: Review velocity, acceleration, and waveform changes on the pump, motor, and coupling train.
- Quarterly thermography round: Inspect switchgear compartments, cable terminations, disconnects, and overloaded feeders.
- Oil sampling at planned intervals: Check contamination and wear indicators on lubricated assets with meaningful internal failure risk.
- Ultrasound during operator rounds: Listen for steam leaks, compressed air loss, and early bearing distress at accessible points.
The value isn't in collecting more data. The value is in turning a detectable defect into a planned job before collateral damage spreads.
That last step is where many programs stall. Sensors may be installed, routes may be run, and reports may be generated, but the defect never gets translated into the right work order with the right priority. Predictive technology only changes plant performance when diagnostics, planning, and execution are tied together.
The Role of CMMS and Reliability Metrics
A Computerized Maintenance Management System, or CMMS, should be the plant's maintenance memory. If it only stores closed work orders with vague failure descriptions, it can't support reliability decisions. If it captures clean asset structure, useful failure codes, labor history, parts usage, and condition findings, it becomes the operating record that guides strategy.
What clean maintenance data looks like
Good CMMS governance starts with asset hierarchy. The plant needs to know not just that a work order happened in Area 4, but that the failure occurred on a specific pump, motor, gearbox, valve, or conveyor section. Without that hierarchy, repeat failures hide inside generic location names.
Failure coding matters just as much. "Pump down" is not a failure mode. "Outboard bearing damage," "seal leakage," and "coupling misalignment" are. Reliability teams can't analyze vague descriptions because vague descriptions collapse distinct problems into one bucket.
A useful CMMS record usually includes:
- Asset identity: Exact equipment tag and location within the hierarchy.
- Failure mode detail: What physically failed, not just what production observed.
- Cause and remedy: Misalignment corrected, bearing replaced, lubrication contamination found, base looseness repaired, and so on.
- Time and labor history: Enough detail to understand planning quality and repair burden.
- Condition evidence: Inspection findings, readings, photos, and follow-up recommendations.
Plants trying to mature this area usually benefit from tightening work-order standards before adding more dashboards. Clean input beats elegant reporting every time. This is the same governance issue addressed in practical CMMS planning work such as this CMMS implementation guide for maintenance teams.
The KPIs that actually guide decisions
Key maintenance indicators aren't just reporting artifacts. They are decision tools. MTBF, MTTR, and PM Compliance Rate are derived from CMMS data and form the operational backbone for deciding whether an asset strategy is improving or drifting toward breakdown-driven maintenance, as outlined in maintenance KPI guidance.
A few definitions matter:
- MTBF, or Mean Time Between Failures: Average operating time between failures on repairable assets. It is a reliability indicator.
- MTTR, or Mean Time To Repair: Average time required to restore equipment after failure. It reflects maintainability and execution quality.
- PM Compliance Rate: The percentage of preventive tasks completed on time. Tractian notes it is calculated as (PM tasks completed on time / PM tasks scheduled) × 100.
- Planned Maintenance Percentage: The ratio of planned maintenance work hours to total maintenance hours. It shows whether the plant is controlling work or reacting to events.
A pulp and paper mill provides a good example. If a paper machine roll bearing failure is logged as "bearing replaced," the site learns almost nothing. If the work order records the bearing location, lubrication condition, symptoms before failure, repair time, and repeat history, the reliability engineer can compare MTBF across similar positions and determine whether lubrication practice, contamination control, alignment, or loading is the more likely driver.
A KPI only matters if someone can change a decision because of it.
That is the standard to use. If PM compliance is low, the plant should ask whether scheduling discipline, parts availability, or access windows are the constraint. If MTTR remains high, the problem may be weak job plans, poor spare staging, or difficult equipment access. If planned work hours stay low, the site is still being run by the next emergency call.
Building Your O&M Implementation Roadmap
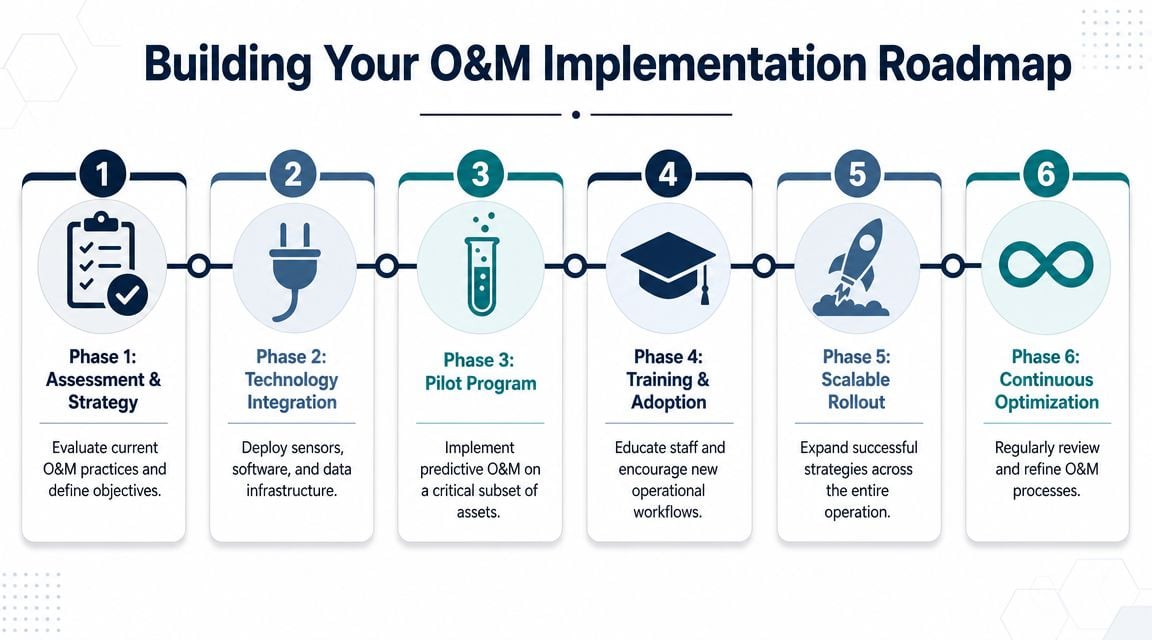
Plants usually fail at O&M transformation for one of two reasons. They either buy technology before defining the problem, or they create a strategy document that never reaches the weekly schedule. A workable roadmap connects asset risk, failure modes, monitoring methods, CMMS governance, and execution discipline in sequence.
There is a strong economic reason to build this carefully. Leading O&M programs are moving toward data-governed condition monitoring, and PNNL notes that predictive maintenance can yield savings of 8%-12% over preventive programs and 30%-40% over reactive programs, according to predictive maintenance best-practice findings. Those gains don't come from sensors alone. They come from selecting the right assets, detecting the right failure modes, and acting on findings in time.
Phase 1 and 2 set the technical foundation
Start with criticality ranking. Every plant has more assets than it can monitor deeply, so the first job is deciding what deserves attention. Criticality should reflect production consequence, safety exposure, environmental risk, quality impact, repair complexity, and availability of standby equipment.
Then use failure analysis methods such as FMEA (Failure Modes and Effects Analysis) or RCM (Reliability-Centered Maintenance) logic on the top assets. The objective isn't paperwork. It's identifying how each asset fails and whether those failures are age-related, condition-detectable, or random.
After that, assign the strategy mix:
- Run-to-failure for low-consequence assets with easy replacement.
- Preventive maintenance where service intervals are meaningful and stable.
- Condition-based maintenance where a threshold can trigger action.
- Predictive maintenance where trend analysis gives enough warning to plan the job.
Phase 3 and 4 turn design into execution
Once the strategy is chosen, build the monitoring and work process around it.
A practical setup includes:
- Inspection routes: Operators and technicians need clear route ownership, standard points, and standard defect descriptions.
- Technology selection: Use vibration for rotating mechanical faults, thermography for electrical and thermal issues, oil analysis for internal wear and contamination, ultrasound for leaks and early faults, and motor current analysis where electrical condition matters.
- Alarm and notification rules: Plants need rules that prevent alarm floods and push only actionable conditions into the workflow.
- CMMS configuration: Each condition finding should map to the correct asset, priority logic, work type, and closure code.
The outsourcing decision also belongs here. Some plants have capable internal planners and reliability engineers but limited diagnostic capacity. Others have diagnostic tools but weak follow-through. The right answer depends on skill depth, site size, and how many critical assets need consistent monitoring. Internal ownership with selective outside support often works well when the plant wants capability without building a full specialist team immediately.
Pilot before scale
A pilot should be narrow enough to manage and important enough to matter. A single production line, utility system, or asset class usually works better than a plant-wide launch. In a manufacturing site, a sensible pilot may focus on critical pumps, motors, gearboxes, and compressed air equipment that repeatedly affect throughput.
A good pilot has five traits:
- Clear asset list
- Defined failure modes
- Chosen technologies and route frequency
- CMMS work-order workflow for findings
- Review cadence with operations and maintenance leadership
One pilot line can prove whether the plant is capable of turning condition data into planned work. If not, scaling just spreads the weakness.
A phased rollout becomes easier when the site uses a structured reliability build plan like this 12-month roadmap for building a reliability program. The point isn't speed by itself. The point is sequencing. Criticality before sensors. Failure modes before alarm limits. Work execution before enterprise dashboards.
Conclusion Take Control of Your Asset Reliability
Operation and maintenance becomes effective when the plant stops asking only, "How fast can this be repaired?" and starts asking, "Why did this asset degrade, how early could it have been detected, and what system change prevents the repeat?" That is the shift from reactive maintenance to strategic reliability control.
The path is practical. Rank assets by consequence. Define real failure modes. Use the right maintenance strategy for each asset, not the same one for all of them. Apply predictive technologies where condition data gives useful warning. Treat the CMMS as a governed system of record. Measure performance through KPIs that change decisions, not just slide decks.
Different industries will weigh the same framework differently. A pharmaceutical site may prioritize compliance, documentation discipline, and controlled intervention windows. An automotive plant may focus harder on throughput risk and cascading line stoppage. A food plant may care greatly about sanitation interaction, washdown exposure, and packaging line constraints. The framework still holds because the core problem is the same. Failure modes must be understood, deterioration must be detected, and corrective work must be executed before production pays the price.
The biggest mistake is waiting for perfect conditions. Plants don't need a flawless enterprise rollout to improve operation and maintenance. They need a controlled start on the assets that matter most. When a site builds that discipline, breakdowns stop dictating the week, planned work becomes believable, and reliability starts showing up in production results.
Forge Reliability helps industrial teams build data-driven operation and maintenance programs through condition monitoring, predictive maintenance, failure analysis, and CMMS-centered reliability governance. For plants that want to reduce emergency work, prioritize critical assets, and build a practical path toward predictive maintenance, request a free reliability assessment from Forge Reliability.