A plant manager usually knows the feeling before the numbers confirm it. The bottling line is running, pallets are moving, operators are busy, and yet shipments keep slipping because the line never seems to deliver what the schedule promised. Maintenance says breakdowns are under control. Operations says the filler is starved half the shift. Quality says startup scrap is the actual problem. Everyone has part of the truth, but no one has the full loss picture.
That's where OEE improvement either becomes a disciplined plant-floor practice or another dashboard project that dies in meetings. On a food and beverage bottling line, OEE is useful only when it helps the team decide what to fix first, how to fix it, and how to prove the result. The line example throughout this playbook is a typical bottling system with an infeed conveyor, rinser, filler, capper, labeler, packer, and palletizer. The filler is the bottleneck. That matters because the bottleneck sets the pace for the whole line.
Table of Contents
- The Foundation of OEE Data You Can Trust
- Decomposing OEE to Find Your Biggest Losses
- Drilling Down with Root Cause Analysis
- Matching Reliability Strategies to Failure Modes
- Measuring Real-World Impact and Proving ROI
- Your Roadmap to Continuous OEE Improvement
The Foundation of OEE Data You Can Trust
Bad OEE data creates fake debates. Teams end up arguing about whether the number is real instead of solving the problem behind it. On a bottling line, that usually starts with shift averages, inconsistent downtime codes, and cycle-rate assumptions that no longer match how the filler operates.
Start at the bottleneck, not with averages
For line-level measurement, OEE should be calculated from the bottleneck's base data rather than averaging shift or hourly OEE values, because OEE is a weighted calculation and averaging can distort the true result. The correct method is to capture unscheduled time, unplanned downtime, total units, target units, and good units, then use the maximum theoretical or nameplate speed for performance while tracking starvation and blocking at the bottleneck, as outlined in this guidance on successful OEE implementation.
On the bottling line, that means the filler gets treated as the primary measurement point. If the labeler runs faster than the filler, its local performance doesn't define line OEE. If the packer stops because the filler starved it, that event still has to be understood in relation to the bottleneck.
Practical rule: If the team can't agree on the bottleneck, it isn't ready to trust the OEE number.
What the bottling line should capture every shift
A reliable data set is simple enough for operators to use and specific enough for engineering analysis. The filler, capper, and conveyors don't need dozens of reason codes. They need a short list that separates useful categories.
A solid starting structure looks like this:
- Downtime event and reason code: Distinguish filler jam, cap chute fault, low air pressure, changeover, sanitation hold, film feed issue, and waiting on upstream material.
- Actual output versus target output: Use actual counted bottles and compare them to the line's maximum theoretical or nameplate rate.
- Good units versus total units: Capture rejects, rework, and startup losses separately so quality loss doesn't disappear inside total production.
- Starvation and blocking: Record whether the filler stopped because it lacked bottles or because downstream equipment couldn't receive product.
Manual log sheets can work if the line is early in its OEE journey. They also fail fast when operators are busy, events are short, and reason codes are vague. Small stops on a bottling line often disappear from paper logs because no one stops to write down a ninety-second guide-rail adjustment during a production rush.
Manual logs versus automated capture
Manual tracking is useful for proving discipline. Automated capture is useful for proving reality. Most plants eventually need both. A state signal can tell the team when the filler stopped, but not always why. An operator can explain why, but only if the reason codes are short, clear, and used consistently.
That's why data validation matters as much as data collection. Supervisors should compare shift logs to production totals, reject counts, and maintenance call records. If the line reports no downtime but production fell short, the data isn't trustworthy yet.
A practical validation routine includes:
- Daily sanity checks: Compare output, logged downtime, and scrap records before the next shift starts.
- Weekly code cleanup: Merge duplicate reason codes and remove vague entries like “machine issue.”
- Operator coaching: Train to log the immediate cause, not the final frustration. “Capper chuck wear” is better than “line stopped.”
Plants building this discipline often benefit from aligning OEE with other core reliability measures, especially when downtime discussions get mixed with maintenance response performance. A concise reference on that connection is this guide to MTBF, MTTR, and OEE metrics.
Decomposing OEE to Find Your Biggest Losses
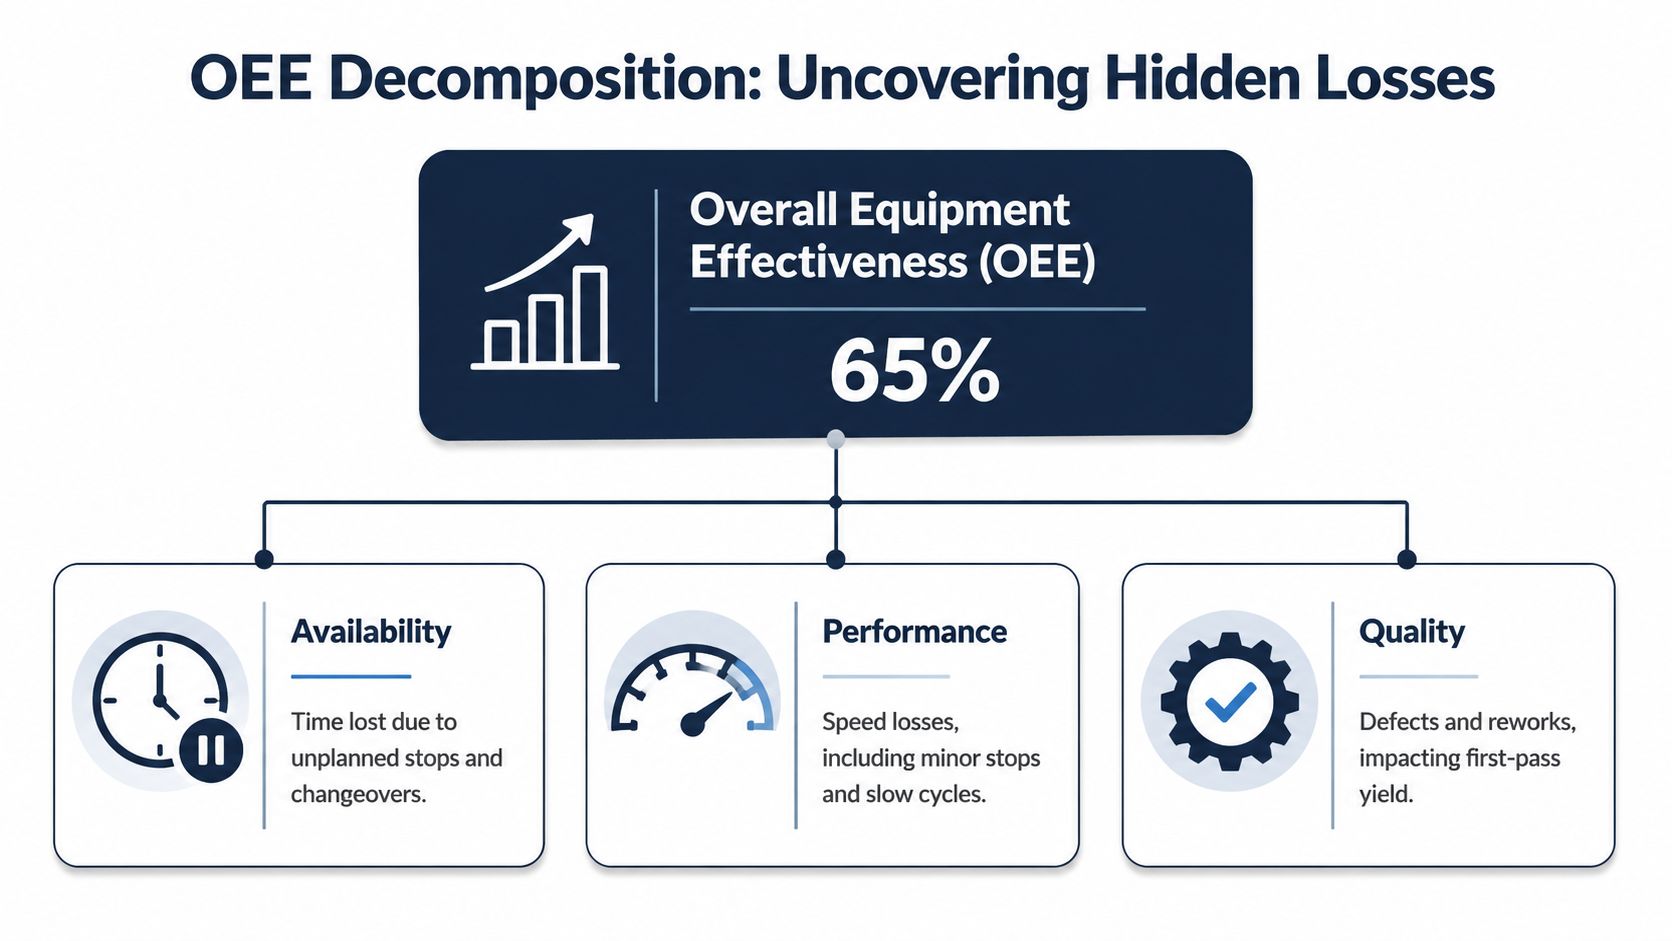
An OEE value by itself doesn't tell a maintenance manager where to spend labor next week. It only says the line is underperforming. Effective work starts when that number is broken into Availability, Performance, and Quality, then tied to specific losses on the bottling line.
Why one OEE number hides the real problem
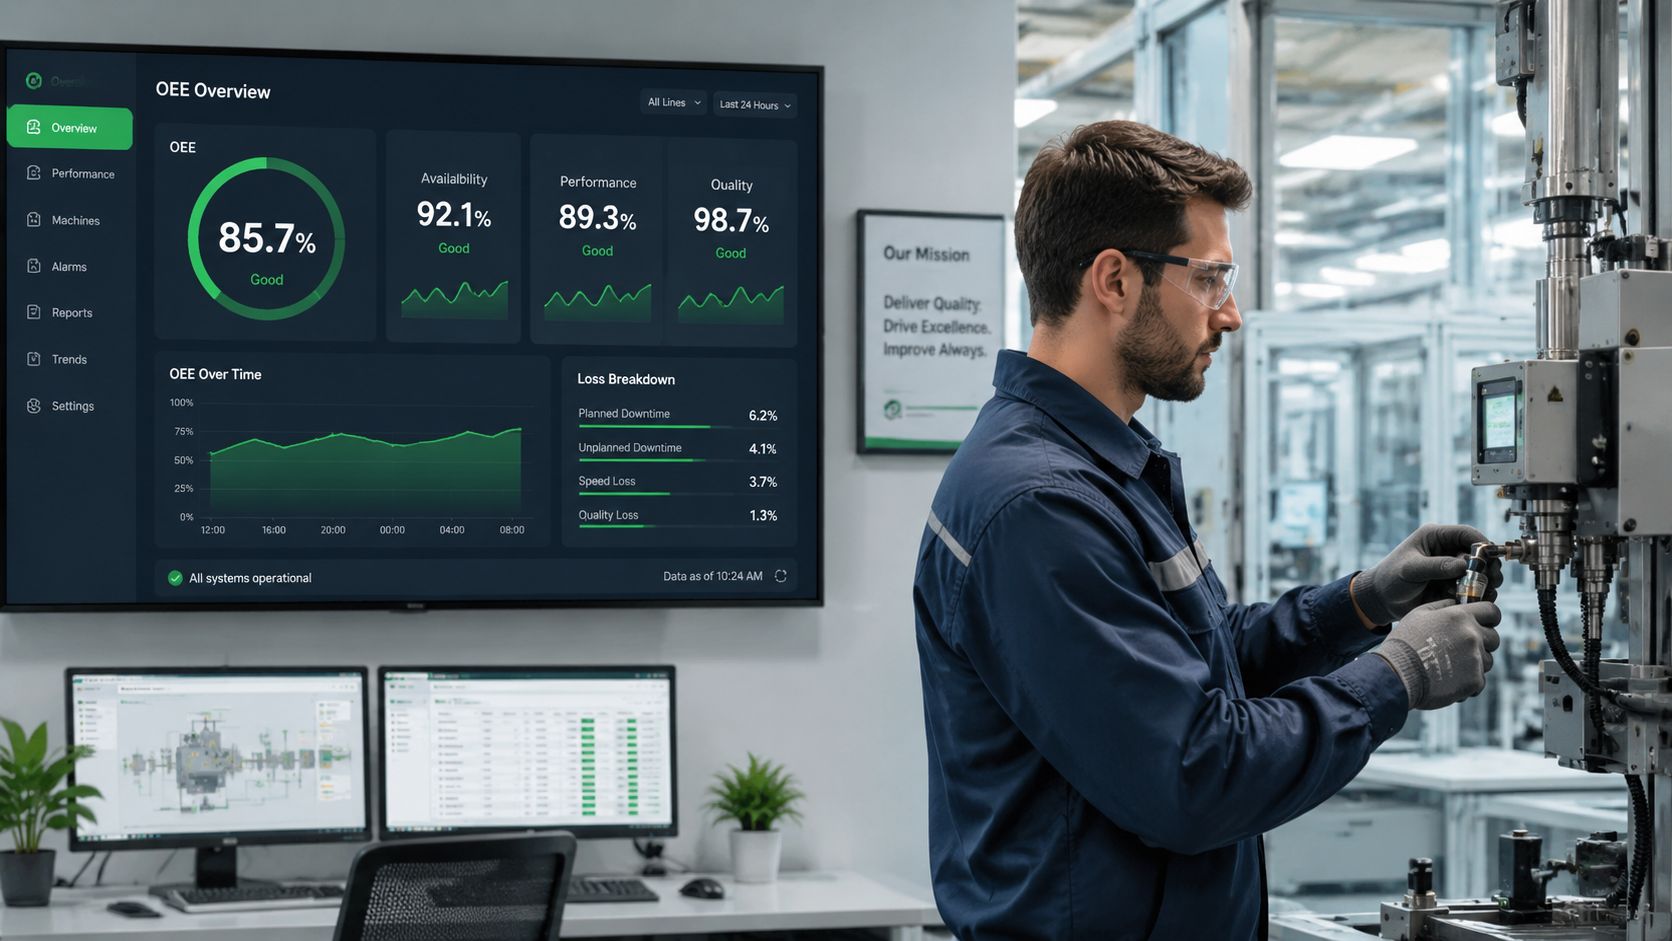
A widely used benchmark for OEE improvement is the 85% world-class OEE level, and even that still implies about 15% loss across availability, performance, and quality. A simple example shows why the math matters. 90% availability × 90% performance × 98% quality = 79% OEE, which illustrates how small losses in each component compound into a lower overall result, as explained in this discussion of OEE and operational excellence.
On the bottling line, that distinction prevents a common mistake. Teams often chase breakdowns because they're visible, while ignoring chronic slow cycles and startup rejects that steadily pull OEE down every day.
Translate line losses into practical categories
The three OEE components become useful only when they're tied to real plant-floor behavior.
| OEE component | What it means on a bottling line | Typical loss examples |
|---|---|---|
| Availability | Time the filler should run but doesn't | Breakdown, changeover delay, sanitation overrun, waiting on utilities |
| Performance | The line runs, but below intended rate | Minor jams, misfeeds, slow cap application, conservative speed settings |
| Quality | Bottles are produced but not accepted | Underfill, bad labels, cap torque defects, startup scrap |
A line can look busy all shift and still lose heavily on performance. Motion isn't the same as output.
The practical loss map usually follows the six big losses. For a bottling line, the categories often show up like this:
- Breakdowns: Filler valve faults, capper chuck wear, conveyor drive trips.
- Setup and adjustments: Flavor changeover, bottle-size parts swap, rinse and sanitation setup.
- Small stops: Photoeye faults, tipped bottles, label web tracking corrections.
- Reduced speed: Running below target because operators are protecting quality or nursing a weak component.
- Startup rejects: Bad fills, skewed labels, unstable cap torque after restart.
- Production rejects: Ongoing defects during steady operation.
Use a Pareto view before assigning labor
The fastest way to waste maintenance effort is to attack the noisiest problem instead of the largest one. A Pareto chart forces the team to rank losses by impact instead of volume of complaints.
For example, a bottling line may have many recorded stoppages from label web tracking, but the larger production loss may come from fewer, longer filler clean-in-place overages or repeated capper adjustments. The ranking changes where the planner sends technicians, what spares get prioritized, and which work orders deserve engineering support.
A practical maintenance leader also checks whether the major loss is a reliability problem. If performance loss comes from operators intentionally slowing the line to avoid underfills, the corrective action may involve setup standards, centerlining, or process discipline before it involves hardware replacement.
For plants trying to tie OEE losses back to cost and labor allocation, this maintenance cost reduction resource gives useful context for turning loss categories into practical decisions.
Drilling Down with Root Cause Analysis
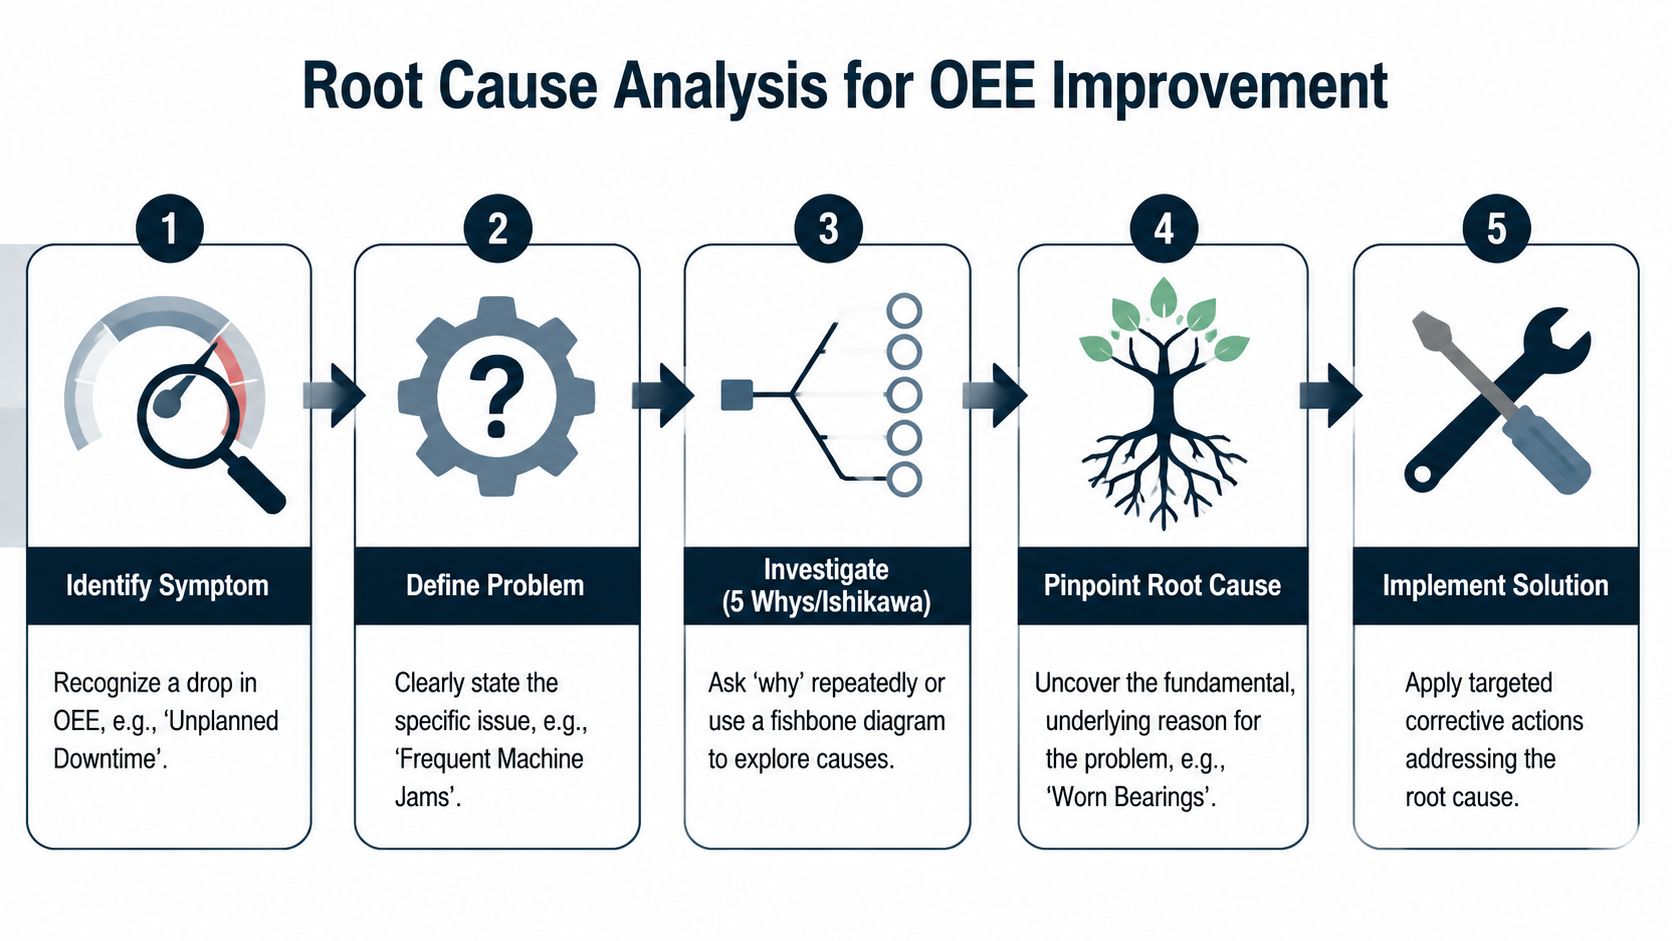
Once the line's biggest loss is clear, broad labels stop helping. “Slow filler cycles” is not a root cause. It's a symptom. The team has to identify the physical, procedural, or system-level condition that keeps the filler from holding target speed.
A bottling line example with slow filler cycles
Assume the Pareto review shows the largest recurring performance loss is reduced speed at the filler. Operators report that the line can run faster, but once speed is pushed up, bottles begin to misposition under the filling valves and underfills increase. The supervisor's quick answer might be “operator caution.” That answer is too shallow to improve OEE.
A useful 5-Why chain could look like this:
Why is the filler running below target speed?
Because operators reduce speed when bottle presentation becomes unstable.Why does bottle presentation become unstable?
Because bottles hesitate entering the starwheel during sustained runs.Why do bottles hesitate entering the starwheel?
Because the timing screw and infeed guide setup drift during product changeovers.Why does setup drift during changeovers?
Because there isn't a verified centerline setting for each bottle format, and technicians set by feel.Why isn't there a verified centerline setting?
Because setup knowledge lives with a few experienced mechanics, not in a controlled standard.
That's a very different outcome from blaming the operator. The underlying issue is standardization and setup control around a mechanical interface that directly affects speed and quality.
What a good 5-Why session looks like
A strong RCA meeting is short, cross-functional, and evidence-based. Maintenance, operations, and quality all need to be in the room because each group sees a different part of the failure path.
The session works better when the team brings:
- Event evidence: Downtime history, reject samples, operator notes, and changeover records.
- Asset observations: Wear patterns on guide rails, timing screw condition, starwheel clearances, and fastener looseness.
- Process context: Whether the problem occurs on one bottle size, one shift, or after each product swap.
The first answer in an RCA session is usually a symptom. The useful answer is often two or three levels deeper.
If the team needs to map more complex failure logic, especially where multiple causes interact, formal methods can help beyond 5-Why. This fault tree analysis example resource is useful when the line problem has branching mechanical, electrical, and procedural contributors.
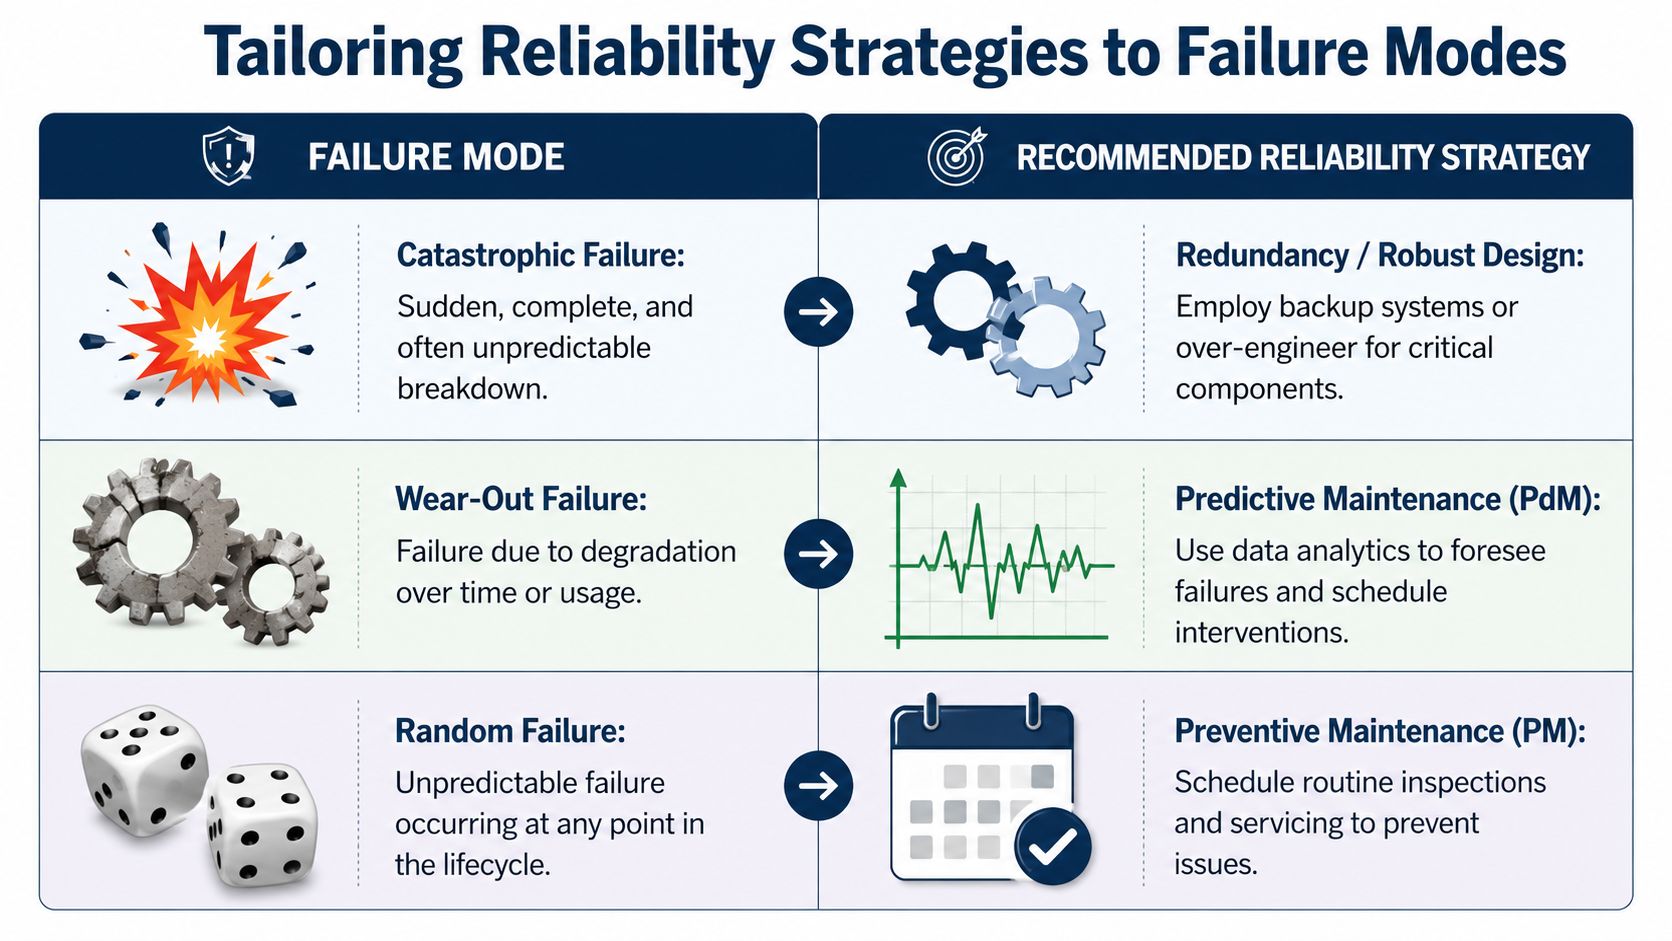
Matching Reliability Strategies to Failure Modes
Not every OEE loss should trigger the same maintenance response. Plants waste time when they apply calendar PM to random failures, or when they launch a condition monitoring route for problems caused by poor changeover control. OEE improvement gets traction when the strategy matches the failure mode.
Different failure modes need different maintenance responses
OEE grew out of Total Productive Maintenance, and it became a core metric for continuous improvement rather than a standalone maintenance measure. In Lean manufacturing literature, 60% OEE is described as fairly typical for discrete manufacturers, while 40% OEE is not uncommon, which shows how many plants still have large loss opportunities before they reach best practice, as described in this overview of improving OEE.
That TPM heritage matters because it reminds plant leaders that OEE improvement isn't just a maintenance department assignment. Operators, planners, mechanics, and engineers all affect availability, performance, and quality through daily decisions.
How the bottling line strategy changes by asset
On the bottling line, failure mode matters more than equipment type alone.
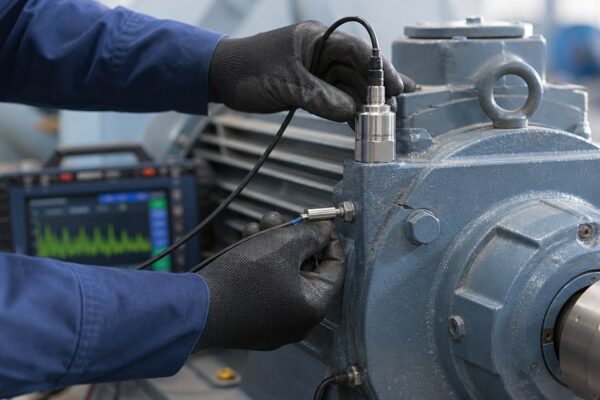
- Wear-out failure on conveyor bearings: Repeated bearing noise, temperature rise, or alignment-related wear points toward condition-based tasks. Vibration checks, inspection routes, lubrication precision, and alignment verification fit this pattern.
- Random failure on sensors and controls: Intermittent photoeye faults or cable issues rarely improve with simple time-based replacement. These need better environmental protection, wiring practices, mounting review, and troubleshooting standards.
- Setup-driven loss at change parts: Starwheel timing errors, guide-rail misadjustment, and bottle-transfer instability usually call for centerlining, visual standards, locking features, and documented changeover procedures.
- Recurring capper defects tied to component design: If torque drift keeps returning after PMs, the team may need a design review, component upgrade, or FMEA rather than another generic inspection task.
A useful support resource for field teams and contractors handling PM execution is this equipment maintenance guide for contractors. It's relevant when plants need clearer inspection discipline across internal staff and outside support.
Build the response into the CMMS and planning process
A good reliability strategy doesn't stay in a meeting note. It gets built into the CMMS, the job plan, and the spare parts strategy.
For the bottling line, that means:
| Problem found | Better response | What should change in the system |
|---|---|---|
| Filler speed loss from unstable bottle presentation | Centerline standards and setup verification | Add format-specific setup tasks and inspection points |
| Conveyor bearing degradation | Predictive or condition-based checks | Create route tasks, alarm criteria, and corrective work triggers |
| Capper torque drift | Focused defect elimination and component review | Track defect mode separately and revise PM job steps |
| Repeated changeover overruns | Standard work and externalized prep tasks | Add checklist sequence and required pre-stage parts list |
One option plants use when they need outside support for these reliability methods is Forge Reliability, which provides predictive maintenance, condition monitoring, and reliability consulting for assets such as motors, pumps, gearboxes, and related production equipment. The point isn't outsourcing for its own sake. The point is making sure the selected method fits the failure mode.
For teams weighing task-based PM against condition-based work, this predictive vs preventive maintenance comparison is a practical reference.
Measuring Real-World Impact and Proving ROI
Improvement work that can't survive a management review usually doesn't survive the next budget cycle. OEE improvement needs a pilot, a baseline, and a way to connect technical results to production value.
Run the pilot like an operations test, not a presentation
A practical OEE-improvement workflow starts with baseline capture on critical assets, then Pareto analysis of the six big losses, then a pilot focused on the top 2-3 loss categories that typically drive 50-70% of total OEE loss. Plants are advised to validate improvement over about 90 days and scale only after showing a measurable lift, according to this OEE improvement workflow reference.
On the bottling line, that means choosing a contained scope. For example, the team might target the filler and capper section, with the pilot focused on two issues: reduced speed caused by poor centerlining, and unplanned stops caused by recurring capper adjustments.
The pilot should track the same variables used in the baseline:
- OEE at the bottleneck
- Availability, performance, and quality by shift
- Failure frequency and stoppage reasons
- Scrap or startup reject patterns
- Maintenance work tied to the target losses
If the team changes the measurement method during the pilot, leadership won't trust the result.
Translate technical wins into business language
The simplest ROI formula is still useful:
ROI = (Value of increased production + avoided maintenance costs) / cost of implementation
What matters is disciplined valuation. If centerlining standards reduced speed loss, operations should estimate the value of recovered production based on actual line demand and accepted output, not theoretical maximum production that the plant never needed. If capper failures dropped, maintenance should count avoided emergency labor, spare usage, and schedule disruption qualitatively unless the plant has verified internal cost data ready to support the calculation.
A good management summary does three things:
- Shows the baseline and post-pilot trend clearly
- Explains what changed physically or procedurally
- States what the plant should scale next and why
When leaders ask whether the result is sustainable, reliability teams should be ready with maintenance evidence, not just production charts. Repeat failure history matters. So does repair frequency. A useful reference for structuring that discussion is this MTBF calculation guide.
Your Roadmap to Continuous OEE Improvement
The plants that make OEE improvement stick don't treat it as a one-time initiative. They build a repeatable loop around one asset, then one line, then one area of the plant. The bottling line example makes that visible. Trusted bottleneck data exposed losses. Loss decomposition showed whether the line was losing time, speed, or first-pass quality. Root cause analysis separated symptoms from causes. Reliability strategy matched the actual failure mode. The pilot proved whether the fix deserved to scale.
Turn OEE improvement into a plant routine
On a healthy line, OEE review becomes part of operating rhythm. Shift leaders look at yesterday's largest loss. Maintenance reviews whether the loss came from a known failure mode or a new one. Engineering supports only where the problem justifies deeper action. That cadence keeps the team from bouncing between emergencies without learning anything from them.
The bottling line also shows why discipline beats slogans. A filler that runs below speed because no one owns centerlining won't improve with more PM hours alone. A capper with chronic torque drift won't improve because a dashboard changed color. Plants improve OEE when each loss is assigned to the right technical response.
What sustained discipline looks like
A durable OEE process usually includes:
- Clear ownership: Operations owns accurate event capture. Maintenance owns failure elimination. Engineering owns design and standardization gaps.
- Stable definitions: Reason codes, target speeds, reject categories, and bottleneck rules stay consistent.
- Routine review: Teams review top losses at a fixed cadence and close the loop on corrective actions.
- Selective scaling: Plants expand methods that worked on the pilot instead of launching every idea plant-wide.
The world-class benchmark is useful as direction, not as a slogan. The better question on any line is simpler. What is the next largest verified loss, and what action will remove it without creating a new one elsewhere?
Forge Reliability helps industrial teams build that kind of disciplined OEE improvement process through predictive maintenance, condition monitoring, root cause analysis, and reliability program development. If a bottling line or any critical production asset is stuck in reactive mode, a free reliability assessment from Forge Reliability is a practical first step.