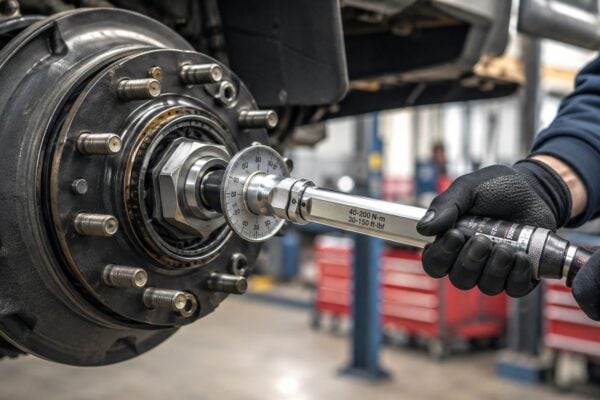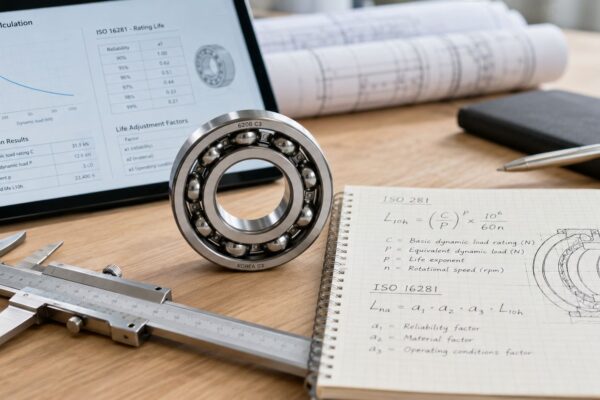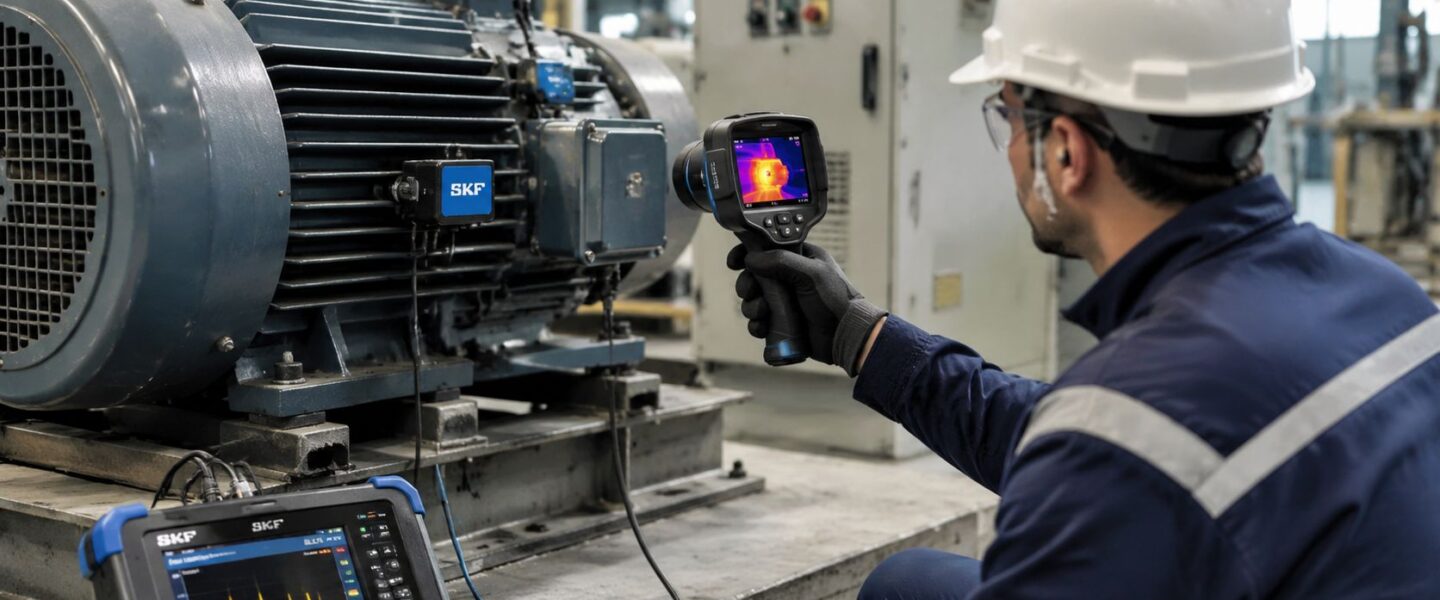
A plant manager usually meets electrical fault detection on the worst possible day. A main breaker trips, a production line goes dark, operations wants an answer in minutes, and maintenance finds a cabinet full of heat discoloration, nuisance alarms, and conflicting clues. By then, the fault has already moved from a maintenance problem to a production problem, a safety problem, and often a planning problem.
That's why a serious program can't stop at “something tripped.” Electrical fault detection has to work as a full workflow. It starts with identifying which assets deserve attention first, continues with choosing the right sensing method for the actual failure mode, and ends only when the team can localize the issue, assign the repair, and put the work into the CMMS with the right priority. In a plant with switchgear, transformers, VFDs, MCCs, and critical motors, that workflow matters more than any single instrument.
Table of Contents
- Beyond the Breaker Trip Moving to Proactive Detection
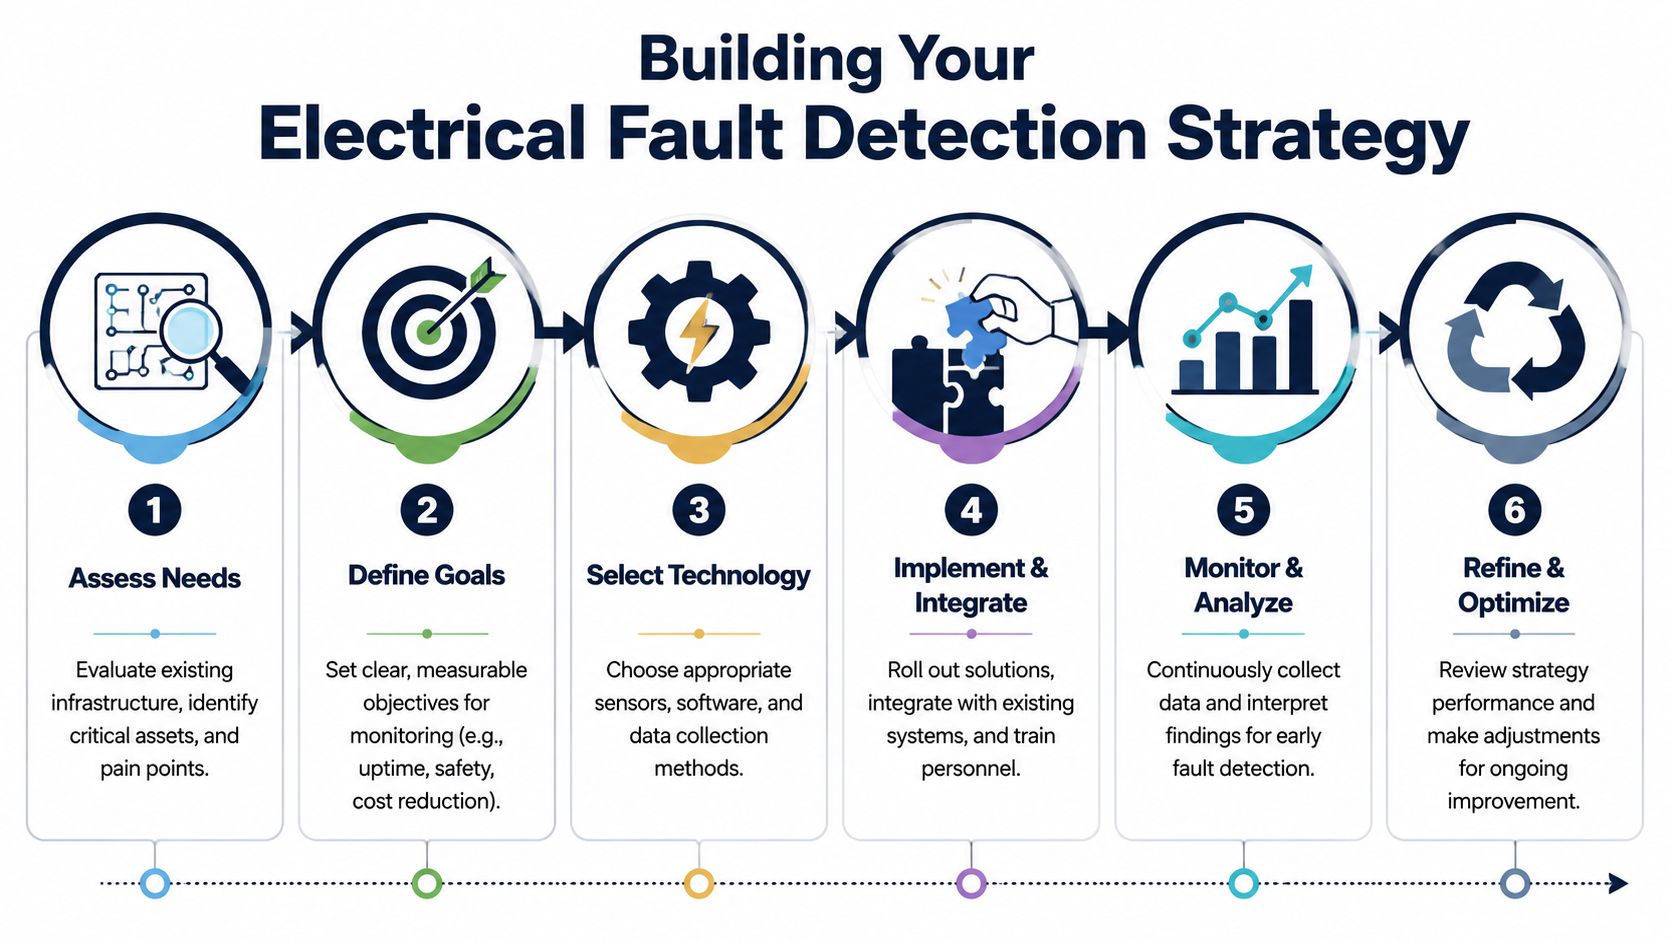
- Building Your Electrical Fault Detection Strategy
- Selecting the Right Diagnostic Tools and Sensors
- Interpreting Data Signatures for Accurate Diagnosis
- From Diagnosis to Action and Precise Fault Localization
- Conclusion Take Control of Your Electrical Reliability
Beyond the Breaker Trip Moving to Proactive Detection
A reactive electrical program usually looks organized right up until the first serious interruption. PMs are on the calendar, panels get opened on schedule, and infrared scans happen once or twice a year. Then a feeder trips during production, a VFD cabinet shows uneven heating, or a motor starts drawing abnormal current between inspection routes. The plant didn't lack activity. It lacked early detection tied to action.
Modern detection methods have changed what's possible. A 2025 study reported 99.04% fault-detection accuracy and 99% fault coverage for a deep-learning approach, even with external disturbances, which is a strong signal that automated analytics can catch subtle changes that manual checks miss (Scientific Reports study on fault-detection accuracy). For a plant manager, the point isn't the algorithm name. The point is that the window between fault inception and protective action can be much shorter when the plant watches waveforms continuously instead of waiting for the next route.
A stamping plant offers a familiar example. A high-tonnage press motor may run hard, cycle often, and sit at the center of the day's output. If its electrical condition is checked only during planned shutdowns, the team will miss the gradual signs of insulation stress, load imbalance, or rotor-related electrical defects. If the same motor is monitored with a fault workflow that includes waveform analysis and motor current signature analysis for electrical fault detection, the maintenance team gets a chance to plan instead of react.
Practical rule: Breaker trips are protection events, not diagnostic strategies.
Time-based PM still has value. Cabinets need cleaning. Connections need torque verification when procedures call for it. Insulation tests still matter. But time-based work alone won't reliably catch defects that develop between intervals, appear only under load, or start as weak electrical signatures long before they become visible heat or a hard failure.
The plants that make progress don't buy one magic device and call it a program. They build a repeatable workflow that answers four questions every time: what failed, how early can it be seen, where is it located, and how urgently does it need repair.
Building Your Electrical Fault Detection Strategy
Plants waste effort when they start with gadgets instead of risk. The right starting point is asset consequence. A utility transformer feeding an entire process area deserves a different approach than an exhaust fan motor with built-in redundancy. A mixer motor in a food plant, a chiller compressor in pharmaceuticals, and a main MCC in a wastewater facility all sit in different places on the criticality map.
Start with criticality and operating context
A practical strategy begins with a short list of assets whose electrical failure would create one or more of these conditions:
- Production loss: Assets that stop the line, starve downstream equipment, or force a batch discard.
- Safety exposure: Equipment where arcing, insulation failure, or faulted components increase personnel risk.
- Recovery complexity: Assets that take long troubleshooting time, specialized parts, or planned shutdown windows.
- Hidden failure behavior: Equipment that can degrade unnoticed, especially VFDs, switchgear, cable runs, and large motors.
A plant with twenty similar motors doesn't need the same monitoring depth on all twenty. The line's primary conveyor drive and the secondary utility pump might both be motors, but they don't carry the same business consequence.
For teams building that risk framework, it helps to align electrical fault detection with a broader predictive vs preventive maintenance strategy. That keeps inspections from becoming a blanket schedule that treats every panel and motor like it matters equally.
Build the failure mode map before selecting sensors
Once the critical assets are ranked, the next move is a focused failure mode review. It doesn't need to be a formal, multi-week exercise to be useful. The team needs to identify the actual electrical failure mechanisms that matter on each asset class.
For example:
- Switchgear and MCCs often justify attention for loose or resistive connections, arcing, corona, contamination, and insulation weakness.
- Motors often need screening for winding problems, rotor-related electrical defects, supply imbalance, and cable issues.
- VFD systems need attention on input power quality, DC bus health, output conditions, terminal heating, and motor cable stress.
- Transformers call for monitoring methods that can reveal connection issues, abnormal heating, discharge-related activity, and winding concerns.
A strategy only works if it reflects real site conditions. That's not theory. In a field study on high-impedance fault detection, algorithm performance changed significantly depending on the contact surface. Across 16 tests, the algorithms detected 8 faults overall, while tests on grassy surfaces reached approximately 90% detection (field study on surface-dependent high-impedance fault detection). The plant-level lesson is simple. Detection logic has to be tuned and validated in the environment where it will operate.
A paper mill's wet cable tray environment, a cement plant's dust load, and a food plant's washdown area won't produce the same electrical signatures or the same sensor performance.
Set inspection depth by risk, not by tradition
Many plants inherit inspection frequencies from old PM templates. Monthly panel checks, quarterly thermography, annual insulation tests. Those intervals may be fine for some assets and badly misaligned for others.
A better approach is to match inspection depth to consequence and failure speed:
- Continuous or near-continuous monitoring: Best for assets where fault growth can outrun route-based inspections.
- Route-based condition checks: Useful for medium-critical equipment with stable operating patterns.
- Shutdown-only intrusive tests: Appropriate where access or safety constraints limit energized inspection.
At this stage, plant managers usually see the first real improvement. Not because more work gets added, but because the same labor gets aimed at the right electrical risks.
Selecting the Right Diagnostic Tools and Sensors
The fastest way to create blind spots is to assume one technology can find every electrical defect. It can't. Every method sees some failure modes early, sees others late, and misses some altogether. Good electrical fault detection programs use that reality instead of fighting it.
Match the tool to the failure physics
A loose bolted connection in a switchgear cubicle behaves differently from early corona on insulation, and both behave differently from an emerging motor rotor problem. The diagnostic method has to match the physics of the defect.
The biggest mistake in plants is overreliance on thermography. Infrared is excellent when a defect produces heat. It's often the right first screen for overloaded conductors, unbalanced phases, bad terminations, and resistive connections. But it isn't always early. Some faults begin as ionization events or electrical waveform changes long before a thermal camera sees a meaningful temperature difference.
That's why sensor modality matters. Ultrasound can detect ionization events such as arcing and corona before there's heat for thermography to see, while voltage and current waveform analysis can detect many conditions but depends heavily on measurement placement and analysis methods (sensor modality trade-offs in electrical fault detection). In plant terms, the real decision isn't “What tool should maintenance buy?” It's “Which tool gives the earliest dependable warning on this asset's likely failure mode?”
A food processing facility provides a useful example. A mixer motor with no obvious temperature issue and acceptable vibration can still show developing electrical problems under load. In that case, motor current analysis for industrial reliability work is often more useful than waiting for the defect to turn into heat or a mechanical symptom.
Electrical Fault Detection Technology Comparison
| Technology | Primary Faults Detected | Best for Equipment | Limitation |
|---|---|---|---|
| Infrared thermography | Loose connections, overloads, phase imbalance, resistive heating | Switchgear, MCCs, panelboards, transformer connections, VFD terminations | Usually needs heat to be present. Can miss early ionization or hidden internal defects |
| Motor current signature analysis | Rotor-related electrical defects, supply issues, load-related electrical anomalies, motor circuit problems | Critical motors, driven systems with repeatable load conditions, VFD-fed and line-fed motor systems | Interpretation depends on load condition and data quality |
| Airborne and structure-borne ultrasound | Arcing, tracking, corona, discharge-related activity | Switchgear, substations, motor control cabinets, transformer areas, insulated components | Requires trained collection practice and can be affected by access and background noise |
| Insulation resistance testing | Insulation degradation and leakage paths | Motors, cables, transformers, stored spare motors | Usually done offline. Doesn't localize the exact defect by itself |
| Vibration analysis | Mechanical symptoms linked to electrical issues, plus mechanical faults that can mimic electrical problems | Motors, pumps, compressors, fans, gear-driven systems | Not a primary detector for many early electrical defects |
Plants that want faster decisions from continuously collected signals should also explore streaming data for instant answers. That matters when an intermittent cabinet event appears and disappears between normal inspection intervals.
What works in a plant and what usually fails
What works is a layered approach.
- Use thermography where current flow and connection integrity are central. Main lugs, fused disconnects, bus joints, contactors, and VFD terminals are classic examples.
- Use ultrasound where discharge starts before heating. Medium-voltage gear, contaminated insulation surfaces, and enclosure inspections benefit here.
- Use motor current methods on production-critical motors. This is especially useful where the motor is hard to access physically but electrical data is available.
- Use insulation testing deliberately. It's valuable during shutdowns, after repairs, and for trending stored assets before installation.
- Use vibration as corroboration. It often helps separate an electrical defect from a purely mechanical problem.
What fails is using any one of those methods in isolation and expecting certainty. A thermography-only program misses defects with weak thermal signatures. An ultrasound-only program can produce findings without enough load context. A current-only program can identify abnormal patterns but still leave questions about the physical location of the defect.
The best sensor is the one that sees the failure before production does.
That's also the point where a plant can mention one service option without changing the process logic. Forge Reliability provides condition monitoring methods such as thermography and motor current analysis, which fit into this kind of multi-technology workflow when a site needs outside support rather than building every capability in-house.
Interpreting Data Signatures for Accurate Diagnosis
Collecting a clean signal is useful. Interpreting what that signal means in the asset's operating context is what drives the maintenance decision. Many plants already have plenty of data. What they lack is a repeatable way to tell the difference between a condition worth watching, a condition that needs a planned repair, and a condition that deserves immediate intervention.
What the pattern means on real equipment
Consider a VFD feeding a critical process pump in a chemical plant. A thermal image shows one output terminal running hotter than the others. That image alone doesn't prove root cause, but the pattern narrows the field. A single hotter terminal often points toward a connection issue, localized resistance, or unequal loading at that point in the circuit. If the current data and visual inspection align, the maintenance team has enough evidence to plan a correction before the defect grows into insulation damage or an in-service failure.
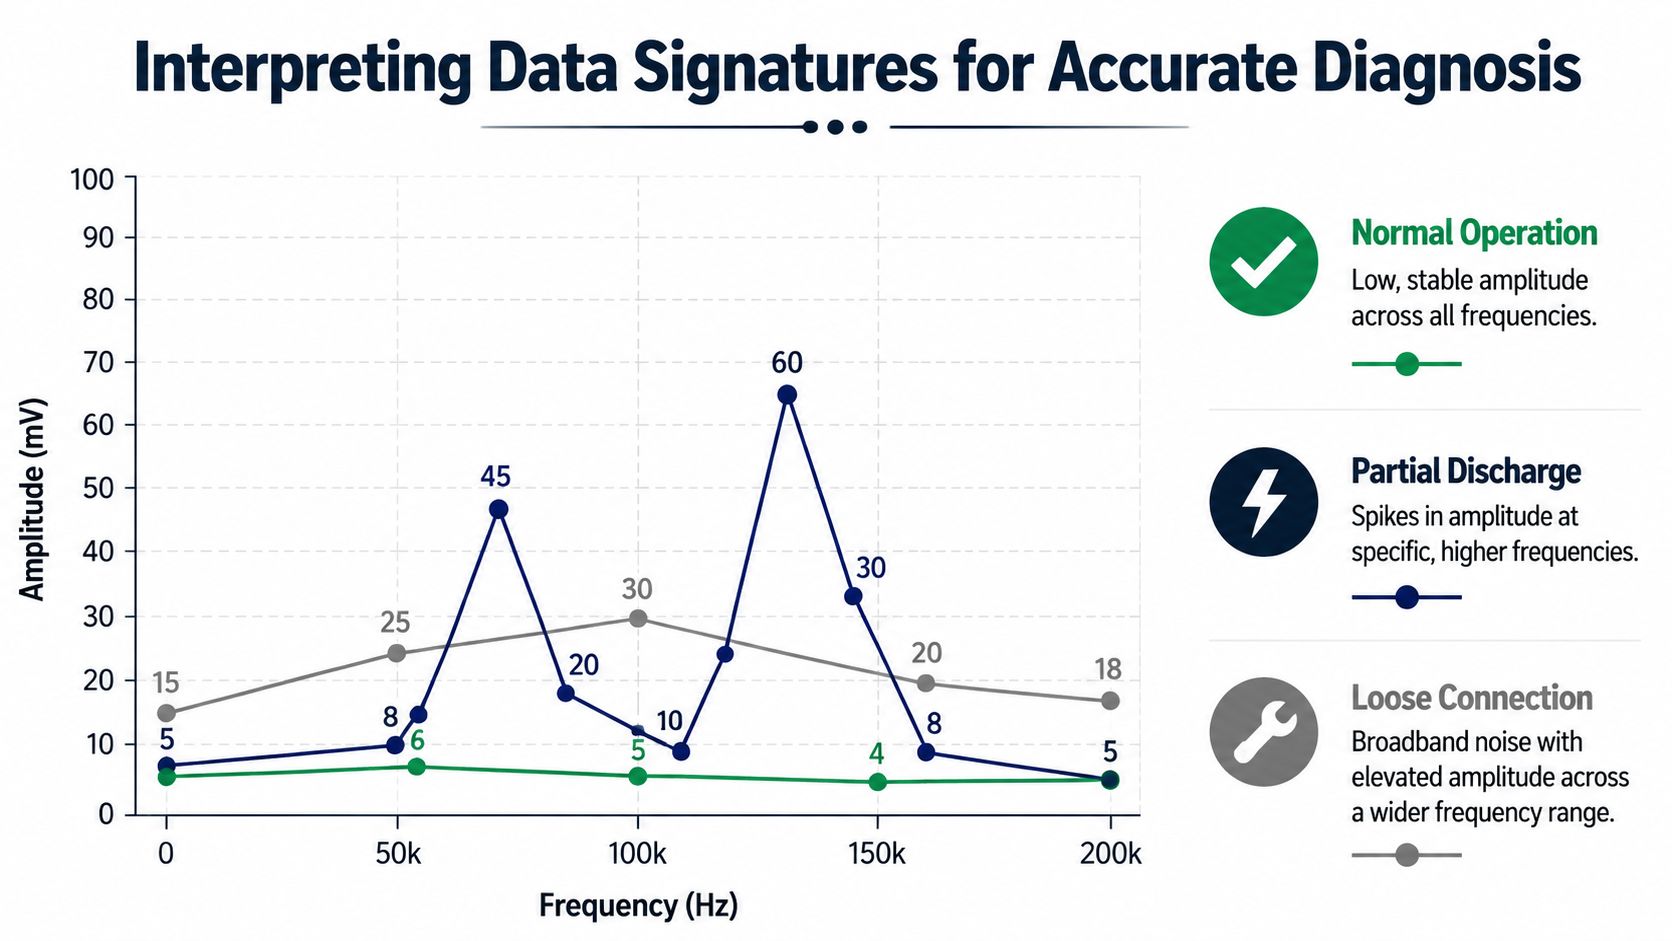
The same logic applies to current signatures on motors. A large compressor motor may continue running with no obvious mechanical complaint while its electrical signature changes under load. Sideband patterns, distortion changes, or repeatable anomalies around expected frequencies can indicate a developing motor electrical problem even before the machine runs hot enough to trigger attention from operations.
The visual below helps show how different fault signatures present as different patterns rather than one generic “bad” signal.
A motor program gets stronger when electrical and mechanical evidence are read together. If a team already trends vibration on driven equipment, motor vibration analysis in parallel with electrical diagnostics can help separate a winding or power issue from misalignment, looseness, or bearing distress.
Trending beats isolated readings
Single snapshots create arguments. Trends create decisions.
A one-time hot spot may be load-related. A repeated hot spot on the same phase position during comparable operating conditions is a maintenance finding. A single ultrasonic event may be environmental noise. A recurring event at the same enclosure under similar system state is different. The interpretation always gets stronger when the team compares like with like.
Useful diagnosis depends on three things:
- Operating state: Was the asset under similar load, speed, and ambient conditions?
- Pattern persistence: Did the signature recur in the same place or same form?
- Cross-validation: Does another method support the same conclusion?
Don't alarm on noise. Alarm on repeatable change under known operating conditions.
Fault prioritization also gets distorted when plants react only to what happens most often. In one fault profile, single-line-to-ground faults account for 70% of events, while three-phase faults account for 5% but are the most severe (distribution fault profile and severity differences). That has a direct maintenance implication. The most common event category doesn't automatically deserve the highest response priority.
For an industrial facility, this means the diagnostic workflow should rank findings by both frequency and consequence. A recurring low-severity indication on a non-critical panel may justify planned correction during a routine outage. A less common but higher-consequence signature on a main feeder, transformer connection, or process-critical motor may need immediate engineering review and tightly scheduled repair.
From Diagnosis to Action and Precise Fault Localization
Detection without localization creates delay. The alarm says there's a problem. The maintenance planner still has to ask where to send the electrician, what to isolate, what spare parts to stage, and whether the job can be done online, at the next outage, or only during a full shutdown.

Localization has levels
A useful fault workflow recognizes that “location” isn't one thing. It gets more precise in stages.
A DOE and PNNL paper frames localization in three levels: feeder, section, and span, and notes that span-level location is the hardest problem. For underground circuits, crews may need a target accurate to about plus or minus five feet to make excavation practical (PNNL paper on fault localization levels and underground accuracy). That's a much tougher task than detecting the existence of a fault.
In a plant, that same logic applies even when the asset isn't part of a utility-scale network:
- Feeder-level localization: The team knows which incoming line, bus, or major circuit contains the issue.
- Section-level localization: The problem is narrowed to a cable run, switchgear cubicle, MCC bucket group, or specific drive lineup.
- Span-level localization: The team identifies the physical segment, component, or cable location that needs repair access.
A chemical plant with an underground motor feeder is a good example. An insulation test may indicate deterioration somewhere on the run, but that result alone doesn't tell the excavation crew where to dig. In those cases, teams often need a localization method such as time-domain reflectometry combined with circuit knowledge, installation records, and field verification.
A maintenance team can't plan a repair around “somewhere on this circuit.”
Infrared findings can also support localization when used properly. A scan that identifies one hot fuse clip, one overloaded termination, or one abnormal connection point is much more actionable than a report that says only “panel has high temperature.” For plants that rely on thermal inspection as part of electrical troubleshooting, infrared thermography for electrical and mechanical inspections fits best when it is tied directly to equipment hierarchy and exact component location.
Turn findings into a work order people can execute
The CMMS is where many otherwise good detection programs lose momentum. A vague fault record becomes a vague work order, and the crew spends the first half of the job rediscovering what the diagnostic team already knew.
A useful electrical fault report should include:
- Exact asset reference: Equipment ID, feeder, bucket, panel, cubicle, motor tag, or cable designation.
- Failure mode statement: Loose connection, suspected discharge activity, insulation concern, abnormal current signature, or thermal imbalance.
- Location precision: Feeder, section, and exact point if known.
- Operating context: Load condition, process state, and whether the finding is repeatable.
- Repair priority: Immediate, next available window, or planned outage.
- Verification method: What test should confirm repair quality before closeout.
That structure turns a finding into scheduled work instead of an email chain. It also allows planners to bundle tasks. If a shutdown is already scheduled for one MCC lineup, the team can package related electrical corrections into the same window and avoid repeated exposure and downtime.
Conclusion Take Control of Your Electrical Reliability
Electrical fault detection works best when the plant treats it as a decision system, not an inspection activity. The strongest programs don't stop at finding heat, noise, or waveform anomalies. They connect criticality, sensing method, diagnosis, localization, and work execution into one process the maintenance team can repeat.
That matters because electrical failures rarely stay confined to one component. A bad connection can damage adjacent hardware. A motor electrical defect can drag down throughput before it triggers a trip. A poorly localized cable problem can turn a short repair into a long outage. The workflow has to reduce uncertainty at every step.
Plant leaders who are serious about uptime usually end up pursuing the same destination. They want maintenance resources focused on the assets that matter most, alarms tied to real failure modes, and work orders that crews can execute without guesswork. That is how electrical fault detection supports safety, planning, and the larger work of achieving operational excellence on the plant floor.
A new plant manager doesn't need to build a perfect program on day one. The first win is simpler. Identify the critical electrical assets, match each one to the failure modes that can hurt the business, and use the right sensing and localization methods to make those findings actionable. Once that loop is running, reliability stops being reactive and starts becoming manageable.
If unplanned electrical downtime keeps disrupting production, a Forge Reliability assessment can help identify critical assets, detection gaps, and the right condition monitoring workflow for the facility. The assessment is free, no-obligation, and focused on practical next steps that maintenance and operations teams can use immediately.