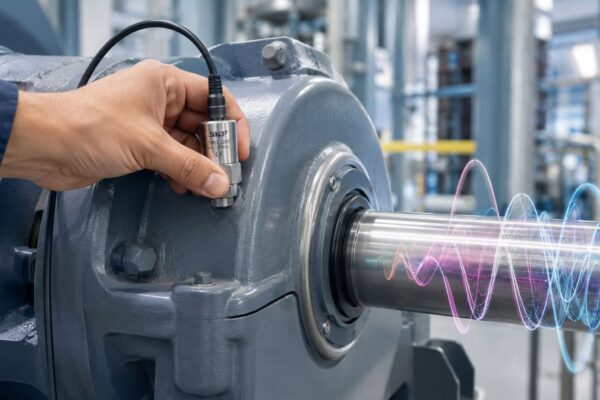
Predictive maintenance ROI gets oversold because too many business cases treat it like a software purchase with instant payback. It isn't. The return comes from specific failure modes on specific assets, and the bill includes more than sensors and licenses. If the plant is carrying a lot of unplanned work, the upside can be real, but only when the program is built around downtime cost, repair complexity, and disciplined execution, not headline promises.
Table of Contents
- Why Most Predictive Maintenance ROI Claims Fail the Reality Test
- Defining ROI and the Financial Metrics That Matter to Leadership
- Step-by-Step Predictive Maintenance ROI Calculation Template
- Industry Benchmarks and the Hidden Cost Stack
- Worked Examples for Motors and Compressors
- Data Requirements and Measurement Plans for Validating ROI
- Common Pitfalls and How to Build a Credible Business Case
Why Most Predictive Maintenance ROI Claims Fail the Reality Test
The cleanest predictive maintenance ROI story usually falls apart on the shop floor. A plant can buy sensors, collect condition data, and still miss the savings if the team does not account for data engineering, change management, false-positive fatigue, and model retraining. Independent analyses of PdM programs keep running into the same pattern, the visible software cost is only part of the bill, while the work of getting reliable signals into action takes real labor and discipline.

The asset, not the platform, drives the return
The strongest returns show up where a failure is expensive in more than one way. A bad bearing on a high-consequence centrifugal pump can trigger repair labor, parts, overtime, and lost production at the same time. That is why ROI usually looks strongest on assets with long repair lead times, collateral damage, or high lost-production cost per hour, a point echoed in benchmark summaries of predictive maintenance savings that compare PdM with preventive and reactive work.
The popular mistake is to ask whether predictive maintenance works in general. It does, in the right place. The better question is whether a given failure mode on a given asset creates enough avoided downtime and repair cost to pay for the full program, including the hidden implementation cost stack that rarely appears in the first business case. If the program also needs new data plumbing, operator training, alert tuning, and ongoing model care, the early ROI can look thin even when the technical model is sound.
Practical rule: start with assets where one avoided failure changes both maintenance spend and production output. That is where the business case usually survives scrutiny.
For a closer look at how model upkeep and operating discipline affect long-term value, Ryware's MLOps guide is useful background on keeping model-driven systems from drifting into shelfware. The reliability metrics overview at Forge Reliability's MTBF, MTTR, and OEE resource also helps connect the failure mode to the financial outcome plant leadership will care about.
Defining ROI and the Financial Metrics That Matter to Leadership
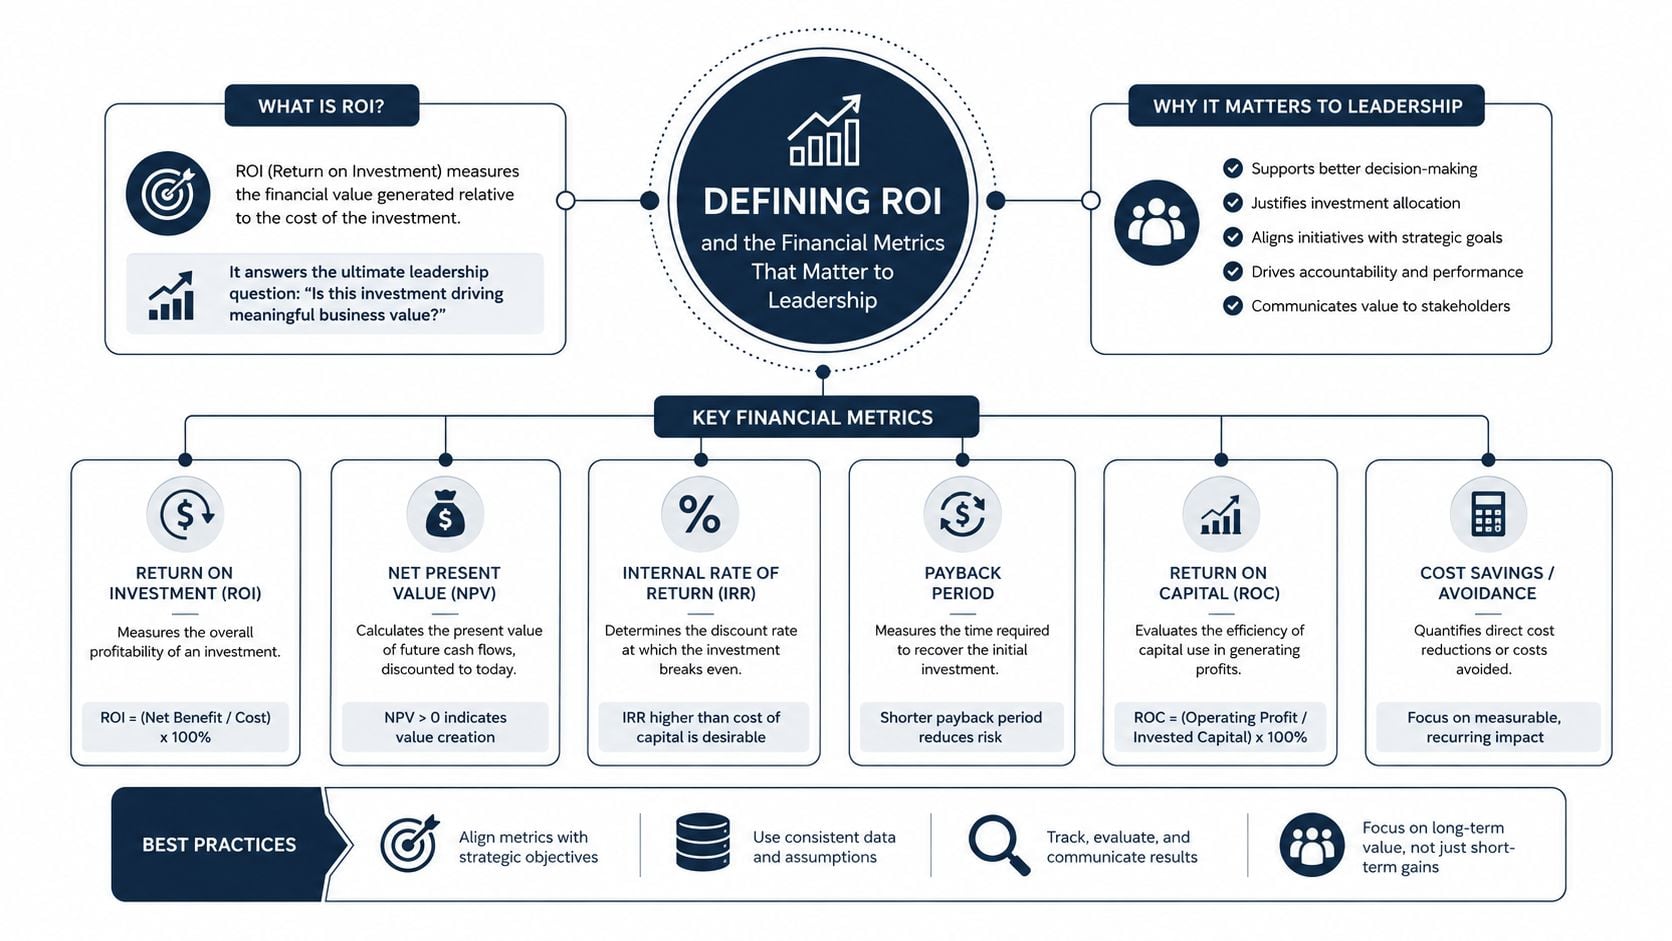
Leadership doesn't all want the same number. Finance wants a clean payback story, operations wants uptime, and reliability wants a defensible comparison between current pain and future savings. ROI means the gain from an investment relative to its cost. Payback period means how long it takes for savings to cover the spend. NPV, or net present value, discounts future cash flows back into today's dollars. IRR, or internal rate of return, shows the rate at which the project breaks even over time.
Use the right metric for the right audience
A maintenance manager can win support with payback because it answers the practical question, “How fast does this stop hurting?” A plant manager usually cares about whether the program reduces fire drills and creates steadier output. Finance often prefers NPV or IRR because those metrics handle time, not just totals. For teams that already track maintenance performance, the reliability metrics guide at Forge Reliability's MTBF, MTTR, and OEE resource gives a useful bridge between technical performance and financial language.
The value equation should include avoided downtime cost, lower overtime, fewer emergency parts premiums, and deferred capital expenditure when extending asset life postpones replacement. Those are different levers, and they don't all behave the same way. A vibration alert that turns a weekend breakdown into a planned outage may save labor and parts, while a condition trend that extends motor life can push a capital purchase out of the current budget cycle.
One useful way to frame the business case is to separate cash savings from cash timing. A repair avoided this quarter is not the same as a repair deferred for two years. Leadership notices that distinction when budgets are tight and capital approval is difficult. The best proposals show both the immediate operating impact and the longer asset-life effect, so the conversation doesn't collapse into a single line item.
Finance-friendly framing: if the program reduces firefighting and keeps a critical line running, it's not just a maintenance project. It becomes an operating margin project.
For a parallel example of how another business function quantifies automation value, this AP automation savings guide is a good reminder that finance teams expect evidence, not enthusiasm.
Step-by-Step Predictive Maintenance ROI Calculation Template
A solid predictive maintenance ROI model starts with one asset and one failure mode, not a whole plant. A centrifugal pump is a good worked example because it's common, expensive when it fails, and easy to model against historical work orders. The financial logic is simple. If condition monitoring catches degradation early enough to avoid an unplanned stop, the savings come from the production time preserved, the repair planned, and the secondary damage avoided.
| Centrifugal Pump ROI Calculation Example | Reactive ($/HP/yr) | Preventive ($/HP/yr) | Predictive ($/HP/yr) |
|---|---|---|---|
| Total maintenance cost benchmark | $18 | $13 | $9 |
That NIST pump-maintenance benchmark shows the comparative cost picture clearly, with $18 per horsepower per year for reactive maintenance, $13 for preventive maintenance, and $9 for predictive maintenance source. On a plant with many centrifugal pumps, that spread gives the first pass at savings potential.
Build the model from the work order backward
Start with hourly production value for the affected line. Multiply that by the repair duration you can realistically avoid or compress. Then add labor that would have been spent on emergency response, expedite charges for parts, and overtime. If the pump failure also damages seals, couplings, or bearings downstream, include the secondary damage that condition-based intervention helps prevent.
The practical data sources are already in most plants. CMMS records show failure dates, repair time, and labor. Production logs show lost throughput. Spare-parts history shows premium purchases and rush freight. If the plant has routes or continuous monitoring, that data helps estimate how much lead time the program creates before functional failure.
Test the result against failure frequency
A single avoided event can make a pilot look great. A realistic business case needs a frequency check. If the pump fails once every few years, the ROI picture is very different from a pump that creates repeated work orders and recurring downtime. That's why a sensitivity view matters. The same asset can look weak on paper at low failure frequency and strong once the plant models repeated breakdowns, long repair lead times, or high collateral damage.
Useful habit: don't approve a PdM project on best-case assumptions. Run the case at lower failure frequency, slower detection, and more expensive repair labor. If it still works, the program is probably real.
For a reliability-oriented baseline on whether the asset is worth monitoring, this MTBF calculation guide helps anchor the discussion in actual failure history.
Industry Benchmarks and the Hidden Cost Stack
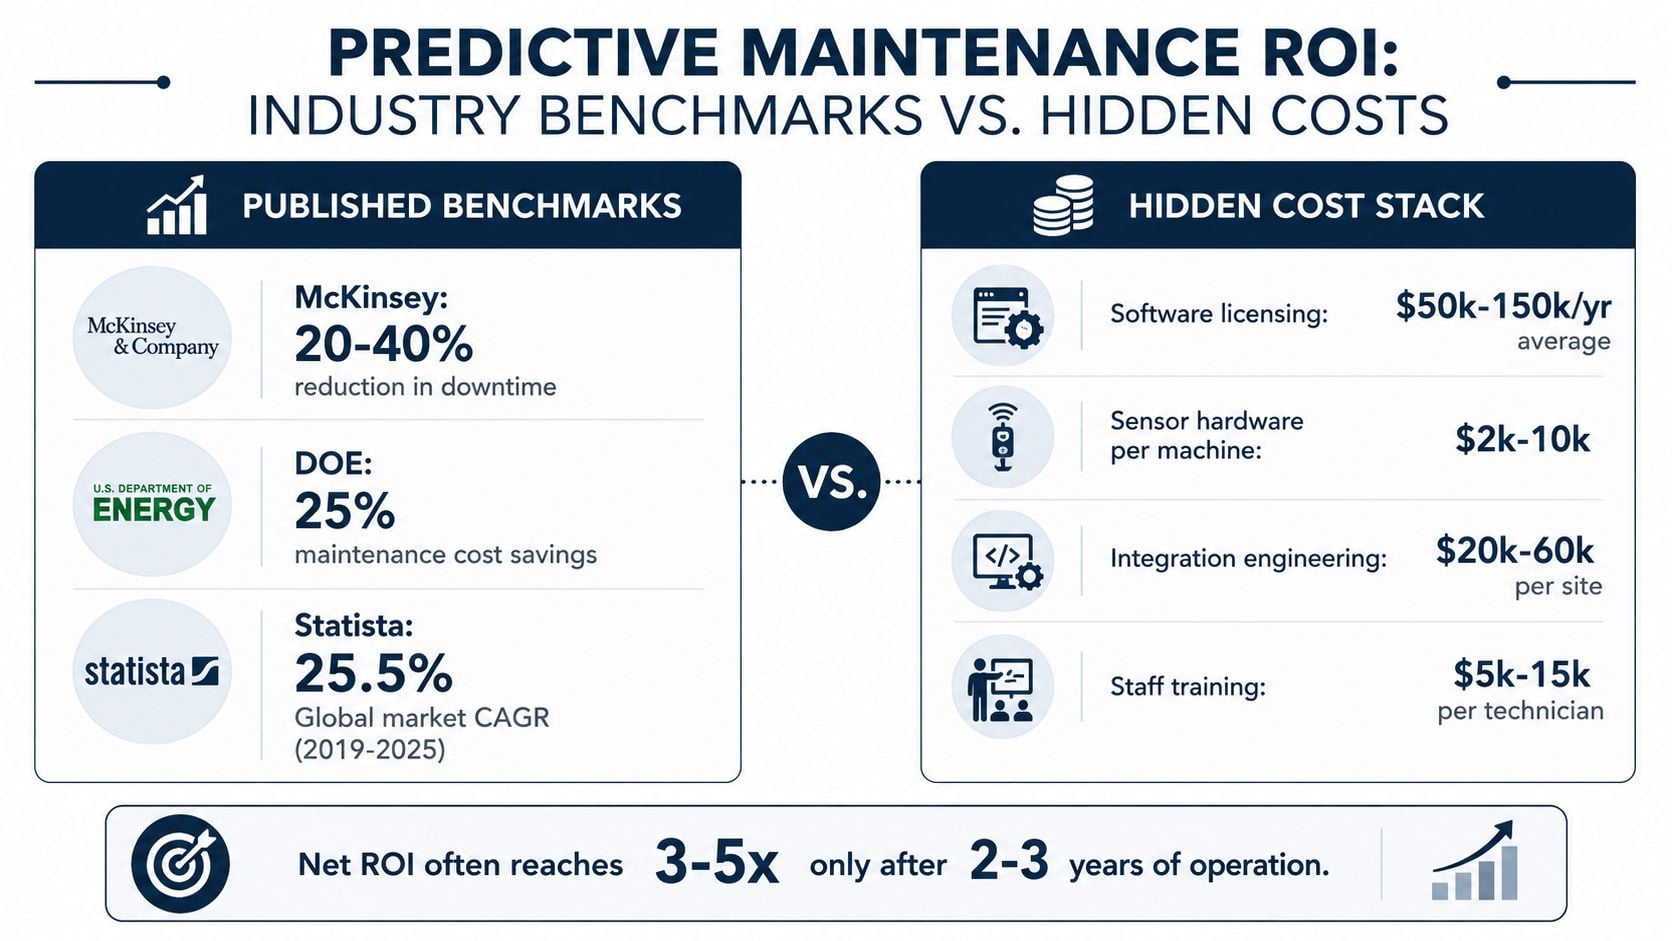
Published benchmarks still have value, but only as a starting point. Industry summaries often cite predictive maintenance results such as 10x ROI, 25% to 30% lower maintenance cost, 70% to 75% fewer breakdowns, 35% to 45% less downtime, and 20% to 25% higher production source. Other industrial ROI reviews point to 10x over three years at scale, a 5x to 8x range for typical implementations, and survey results from 340 manufacturers reporting a median 6.5x ROI over two years with top-quartile returns above 12x source.
Benchmarks are only credible when the cost stack is complete
The problem starts when teams price only the obvious line items. Sensors and software are easy to see. Data engineering, integration work, alarm rationalization, technician training, and model upkeep are harder to see, and they are often the costs that strain the budget after approval. Research on industrial AI implementation points to hidden costs such as data engineering, change management, false-positive fatigue, and retraining as major parts of the deployment burden, which means a clean ROI model can fall apart after go-live if the operating load was underestimated.
The right stress test is straightforward. Ask whether the business case still holds after adding extra labor for data cleanup, setup time for the maintenance planner, and a longer period before alerts are trusted. If the project only works when every alert is right on day one, the case is too fragile for plant leadership.
A practical reference for plant conditions and failure economics is the predictive maintenance for manufacturing overview. It is useful because the economics shift fast by asset type, duty cycle, and how expensive the failure really is. A similar discipline applies to maintenance budgeting, where the right spend is the one that protects uptime, not the one that merely looks small on paper.
For motors, the first question is not whether predictive maintenance pays in the abstract, it is whether the failure mode is worth catching early. Vibration analysis of motor is most defensible on assets where bearing defects, misalignment, or looseness create secondary damage, overtime, or line interruptions. That is where the cost stack usually makes sense first. On lower-consequence assets, the same program can become a reporting exercise with weak payback.
A good ROI model should rule out weak projects. If it does not, it probably is not being honest enough.
For a narrower look at industrial asset strategy, this maintenance budgeting resource helps align spend with consequence.
Worked Examples for Motors and Compressors
An induction motor and a reciprocating compressor rarely fail in the same way, so they shouldn't be justified the same way. Motor bearing damage is often a gradual mechanical problem that vibration analysis can catch early. Winding insulation breakdown is more electrical and often benefits from motor current signature analysis, thermography, and trend review. Compressor valve wear, by contrast, can turn into lost capacity, higher discharge temperatures, and unstable operation that hurts production long before the machine stops.
Motors reward early bearing and insulation detection
On a motor driving a critical conveyor or process pump, the savings often come from preventing secondary damage and avoiding a line stop. Vibration analysis is the first line of defense for bearing defects and misalignment, while thermography can help catch hot connections or load imbalance. For electrical faults, motor current signature analysis gives another path by showing current patterns tied to rotor or stator issues.
The key financial variable is detection lead time. If a fault is seen early enough to schedule a shutdown during a planned window, the plant avoids overtime and emergency labor. If the team only catches the fault after the machine has already tripped, much of the value disappears.
Compressors create a different cost pattern
A reciprocating compressor often justifies monitoring through pressure, temperature, oil condition, and vibration. Valve failure and lube oil degradation can lead to poor compression efficiency, contamination, and unplanned stoppage. Oil analysis is especially valuable where wear debris or contamination signals that the machine is moving toward a major mechanical event.
For compressors, the avoided cost isn't only the repair. A bad valve set can force reduced throughput, and that lost capacity can last long before a complete breakdown. That makes compressors attractive PdM candidates when the unit is tied to plant air, process gas, or another utility that keeps the site running.
The motor vibration analysis guide is a useful internal reference point for teams that need to separate true mechanical degradation from nuisance alarms. In practice, the best returns come when the diagnostics match the failure mode instead of using one signal for every asset.
Selection lesson: a motor with repeat bearing issues and a compressor with known valve wear are usually better first projects than a low-consequence spare that only fails occasionally.
Data Requirements and Measurement Plans for Validating ROI
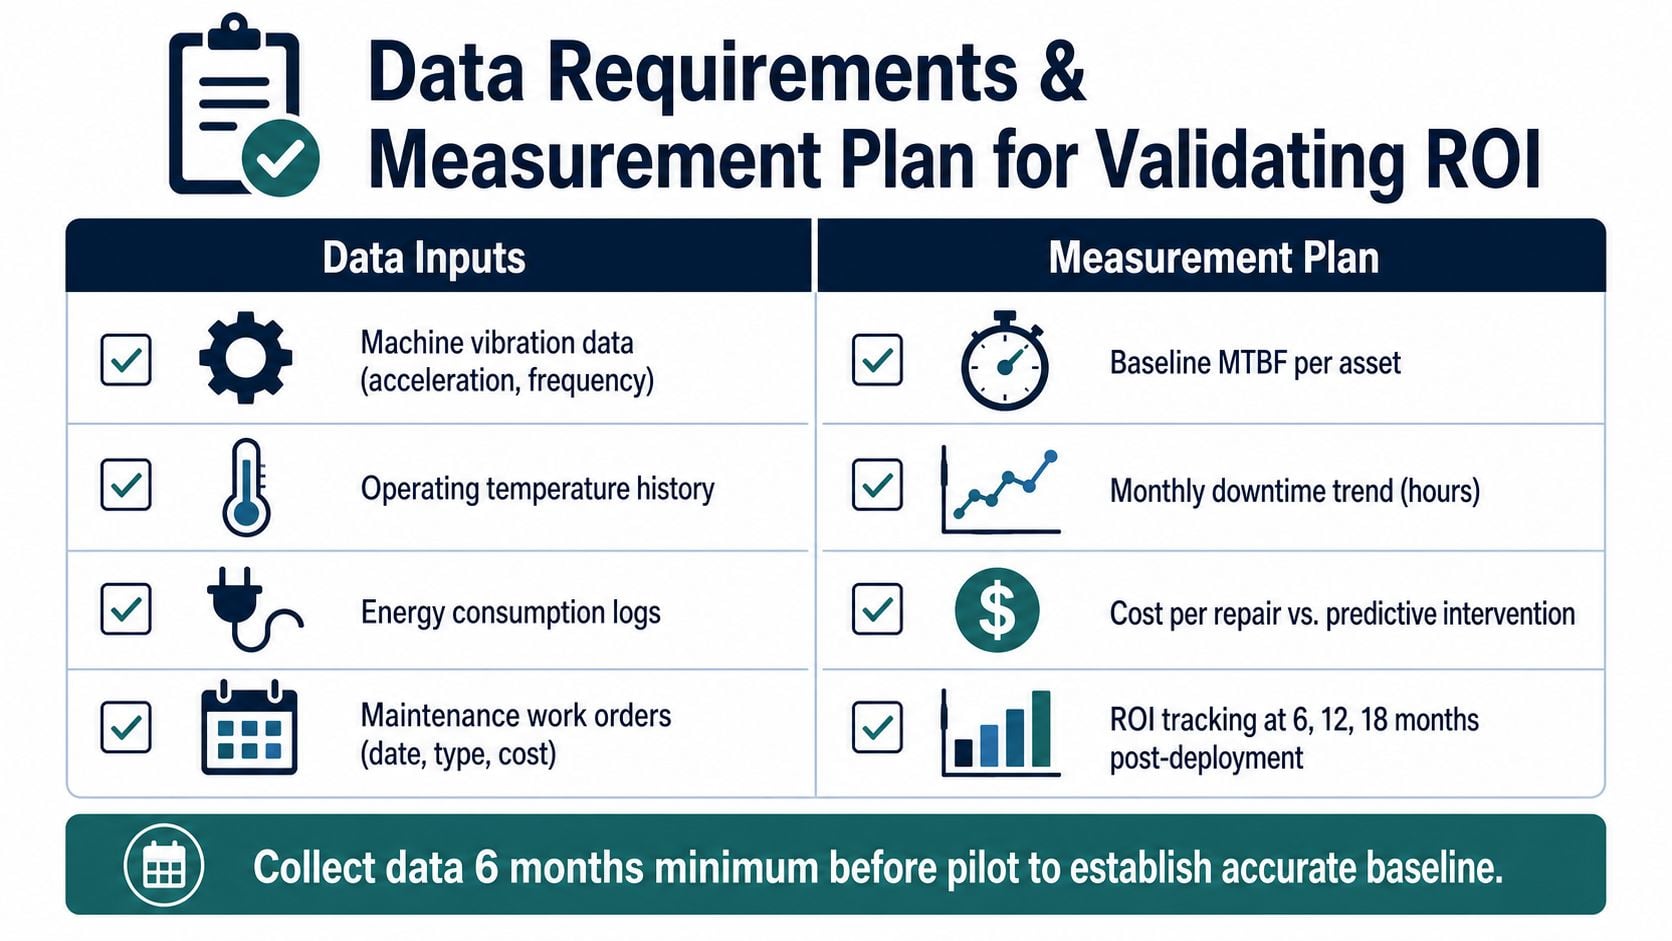
ROI proof starts before the pilot, not after the dashboard goes live. A plant needs a baseline for MTBF, MTTR, maintenance cost per asset, and unplanned downtime hours before anyone can tell whether predictive maintenance changed the curve. Without that baseline, the program can look successful merely because the team started measuring it more carefully.
Track the data that proves causality
A practical measurement plan needs four inputs. First, condition data such as vibration, temperature, oil condition, ultrasound, or motor current signatures. Second, maintenance records with timestamps and cost. Third, production logs that show the actual downtime effect. Fourth, asset context such as duty cycle, load, and criticality. The condition monitoring systems guide is a useful reference for organizing those inputs into a working program.
Then the team should track program health, not just savings. False positives matter because alarm fatigue reduces trust. If technicians start treating alerts as noise, the diagnostic layer stops creating action. A strong measurement plan therefore includes alert-to-work-order conversion, verified fault rate, and the share of interventions that were needed.
Separate PdM gains from other reliability work
A lot of programs fail the audit test because the plant improves several things at once. If PM compliance improves, lubrication discipline tightens, and a shutdown schedule gets better, the PdM program can't take credit for all of it. The cleanest method is to compare a pilot asset group against a matched group or against its own pre-implementation baseline, then document what changed in the work order history.
For leadership, the reporting cadence should be simple. Show trend lines at 6, 12, and 18 months after deployment, but only if the baseline period was long enough to be meaningful. The team should also note whether the program reduced emergency repairs, compressed repair time, or deferred replacement. Those are different outcomes, and each one supports a different part of the business case.
Audit-ready habit: if the team can't explain why savings happened, the finance group won't trust them to count it.
Common Pitfalls and How to Build a Credible Business Case
The biggest mistake is spreading predictive maintenance across too many assets too soon. Low-criticality equipment can soak up time and budget while delivering little return. Another common mistake is ignoring change management, which is where many programs lose adoption after the first wave of alerts. A third mistake is leaving out deferred capital expenditure, even though extending useful life can materially change the economics.
The more credible approach is simple. Rank assets by consequence, failure mode detectability, and baseline data availability. Prioritize high-consequence rotating assets with known failure modes and enough history to model degradation. Then build the case around the specific event you expect to prevent, not around a generic promise that PdM will improve everything.
The business case gets stronger when the team is honest about what the system won't solve. Some assets will be poor candidates because the failure history is thin or the cost of a miss is low. That's not a program failure. It's asset selection discipline.
A structured maintenance plan should also account for the full deployment stack, including training, data cleanup, and workflow change. The plants that win leadership confidence are the ones that can show where value comes from, what it costs to capture, and which assets justify rollout first.
For a reliability-focused conversation about where to begin, Forge Reliability offers a free reliability assessment that looks at asset criticality, failure modes, and the likely value of predictive maintenance before the plant commits budget. Visit Forge Reliability to schedule a no-cost review and pressure-test the next PdM opportunity against real downtime economics.