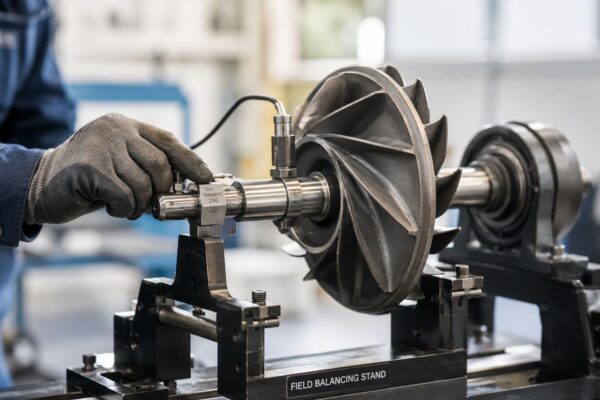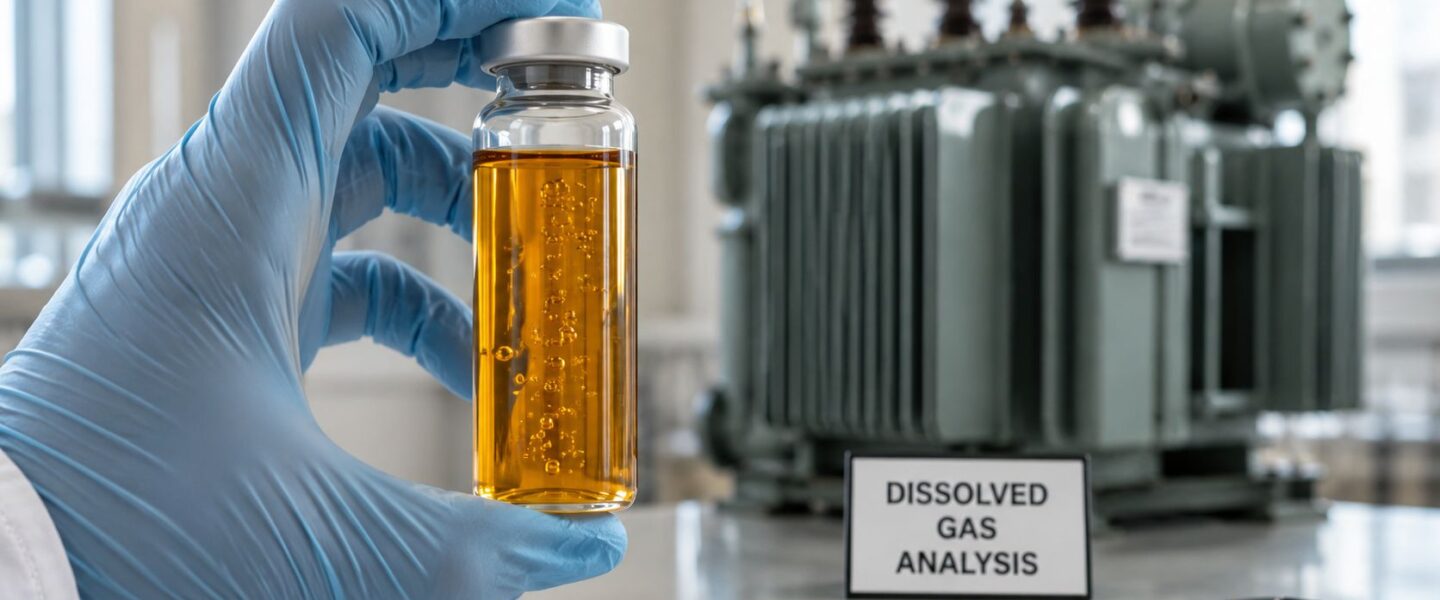
A transformer rarely gives a dramatic warning before it becomes a problem. The unit hums, the load stays up, and the only clues live in a bottle of oil that someone has to draw correctly, label correctly, and interpret correctly. On a chemical plant floor, that's often the difference between a planned outage on a tired 5 MVA furnace transformer and an emergency call on a Friday night.
That's why transformer oil analysis matters to reliability teams. It gives a sealed tank a voice, not a perfect one, but a practical one. Moisture, oxidation, gas generation, and paper aging all leave traces in the fluid, and those traces are often the earliest usable evidence that a transformer needs drying, reclamation, inspection, or a harder retirement conversation.
Table of Contents
- Why a Sealed Tank Is Not a Black Box
- The Core Tests Every Oil Program Should Run
- Benchmarks and Action Thresholds at a Glance
- Reading DGA Beyond the Single Number
- Sampling Integrity and Chain of Custody
- Test Frequency, Criticality, and Trending
- From Test Results to Maintenance Decisions
- Field Questions and Next Steps
Why a Sealed Tank Is Not a Black Box
A sealed transformer can look stable for years while its internal insulation is degrading. In practice, the oil is the only part of the asset that can be sampled without opening the tank, and that's why routine diagnostics have become central to long-life asset management. Modern programs treat annual liquid sampling as a minimum baseline in NFPA 70B-aligned practice, especially for liquid-filled units that are too important to leave to guesswork.
A maintenance manager at a chemical plant faces this exact decision on a 20-year-old, 5 MVA furnace transformer. Two consecutive caution DGA reports don't automatically justify a shutdown, but they also shouldn't be ignored as noise. The question is whether the oil is showing a trend that points to insulation stress, moisture ingress, or a fault developing faster than the loading plan can absorb.
Practical rule: if the tank is sealed and the load is critical, the oil becomes the first place to look, not the last.
Transformer oil analysis became operationally significant because insulation strength and thermal aging account for about 35% of transformer failures. That link is why the industry moved from reactive repair toward routine fluid diagnostics, with dissolved gas analysis and physicochemical testing turning oil into a condition-monitoring medium rather than a consumable (source). Oil condition is one of the few measurable indicators of what's happening inside without opening the tank, which makes it especially valuable for power transformers that are expected to run for decades.
For a plant team weighing run-to-failure against a planned outage, the decision usually comes down to whether the sample shows a stable baseline or a pattern of drift. If the latter is present, the oil is already telling the story.
The Core Tests Every Oil Program Should Run
What each test actually measures
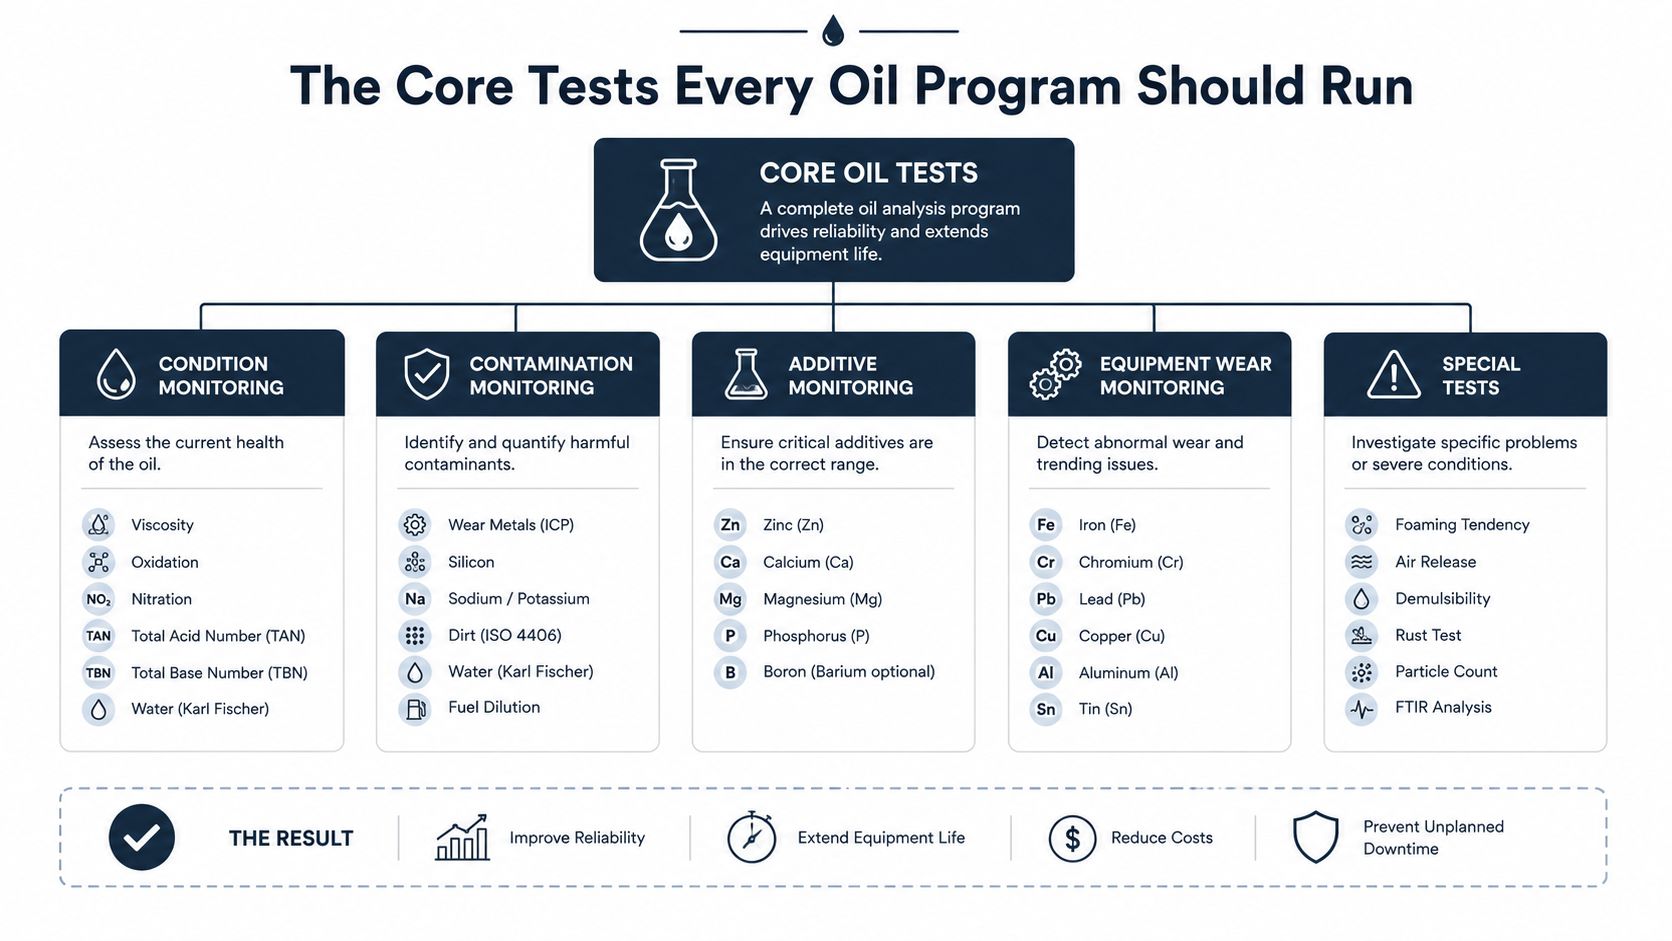
A usable oil program doesn't start with a lab report, it starts with a failure map. Each test points to a different mechanism, and no single result tells the whole story.
Dissolved Gas Analysis, or DGA, measures gases dissolved in the oil using gas chromatography. It is the clearest window into thermal faults, arcing, and partial discharge because different fault types generate different gas patterns.
Breakdown Voltage, or BDV, measures how much electrical stress the oil can withstand before it fails. Low BDV often means contamination, moisture, or both.
Karl Fischer moisture measures water content in parts per million. Water reduces dielectric strength and accelerates paper aging, so it's one of the fastest ways a transformer can slide toward trouble.
Acidity, also called the neutralization number, measures how much acidic byproduct has built up as the oil oxidizes. The chemistry matters because acids attack paper and metal surfaces and contribute to sludge.
Interfacial tension, or IFT, measures the force at the boundary between oil and water. Lower IFT usually means oxidation products, polar contamination, or both, and it often falls before a major dielectric failure becomes obvious.
The supporting tests that sharpen the call
Furan analysis detects cellulose breakdown products in the oil. That matters because furans are about the paper insulation, not the oil itself. A transformer can have acceptable oil chemistry and still have deteriorating paper.
Supporting tests like dissolved metals, particulate counts, color, and power factor help separate contamination from aging. Power factor, also called dissipation factor, rises as the oil oxidizes and polar contamination increases. Color darkens as insulation ages, which is a useful supporting clue rather than a decision point by itself.
A full panel usually runs under familiar methods such as ASTM D3612 or IEC 60567 for DGA, IEC 60814 for moisture, ASTM D974 or IEC 62021 for acidity, ASTM D971 for IFT, ASTM D5837 for furans, and IEC 61619 for PCB screening (source). That combination lets a plant decide whether the next step is drying, reclamation, leak repair, internal inspection, or continued trending.
For a 1 MVA pad-mounted transformer feeding a production line, that distinction matters more than the lab result itself. A single failing metric shouldn't trigger a reflexive oil change. The work order should follow the mechanism.
Benchmarks and Action Thresholds at a Glance
Transformer oil benchmarks vs. investigate thresholds
| Test | New oil benchmark | Investigate | Action / replace |
|---|---|---|---|
| Moisture | <35 ppm | >20–30 ppm | Verify seals and breathers, trend closely, dry if rising |
| Acidity | <0.03 mg KOH/g | >0.15 mg KOH/g | Watch oxidation, consider reclamation as drift continues |
| IFT | ≥40 mN/m | <25 mN/m | Check for oxidation, water, or polar contamination |
| BDV | No single universal benchmark cited here | Falling alongside moisture | Inspect for water ingress, cellulose aging, or both |
| DGA | Baseline depends on unit history | Any abnormal gas pattern | Classify fault, then trend or escalate |
Benchmarks are useful because they keep a team from arguing with every sample. They're not pass-or-fail gates, though. A single bad number can be a sampling artifact, while a slow drift across three or four samples is much more reliable evidence that the transformer is changing.
For in-service oil, moisture, acidity, and IFT are the most sensitive leading indicators because they shift before a major dielectric failure is visible (source). New oil commonly sits around <35 ppm moisture, <0.03 mg KOH/g acidity, and ≥40 mN/m IFT**, while investigate thresholds are often **>20–30 ppm moisture, >0.15 mg KOH/g acidity, and <25 mN/m IFT. A falling BDV paired with rising moisture usually means water ingress, cellulose aging, or both, so the right response is to verify seals and breathers, check for free gas or emulsified water, and review the trend rather than panic over one result.
The hard lesson is simple. Replace oil when the condition supports it, not when one report looks ugly. Ignore a trend, and the unit will eventually make the decision for the team.
Reading DGA Beyond the Single Number
Fault gases tell different stories
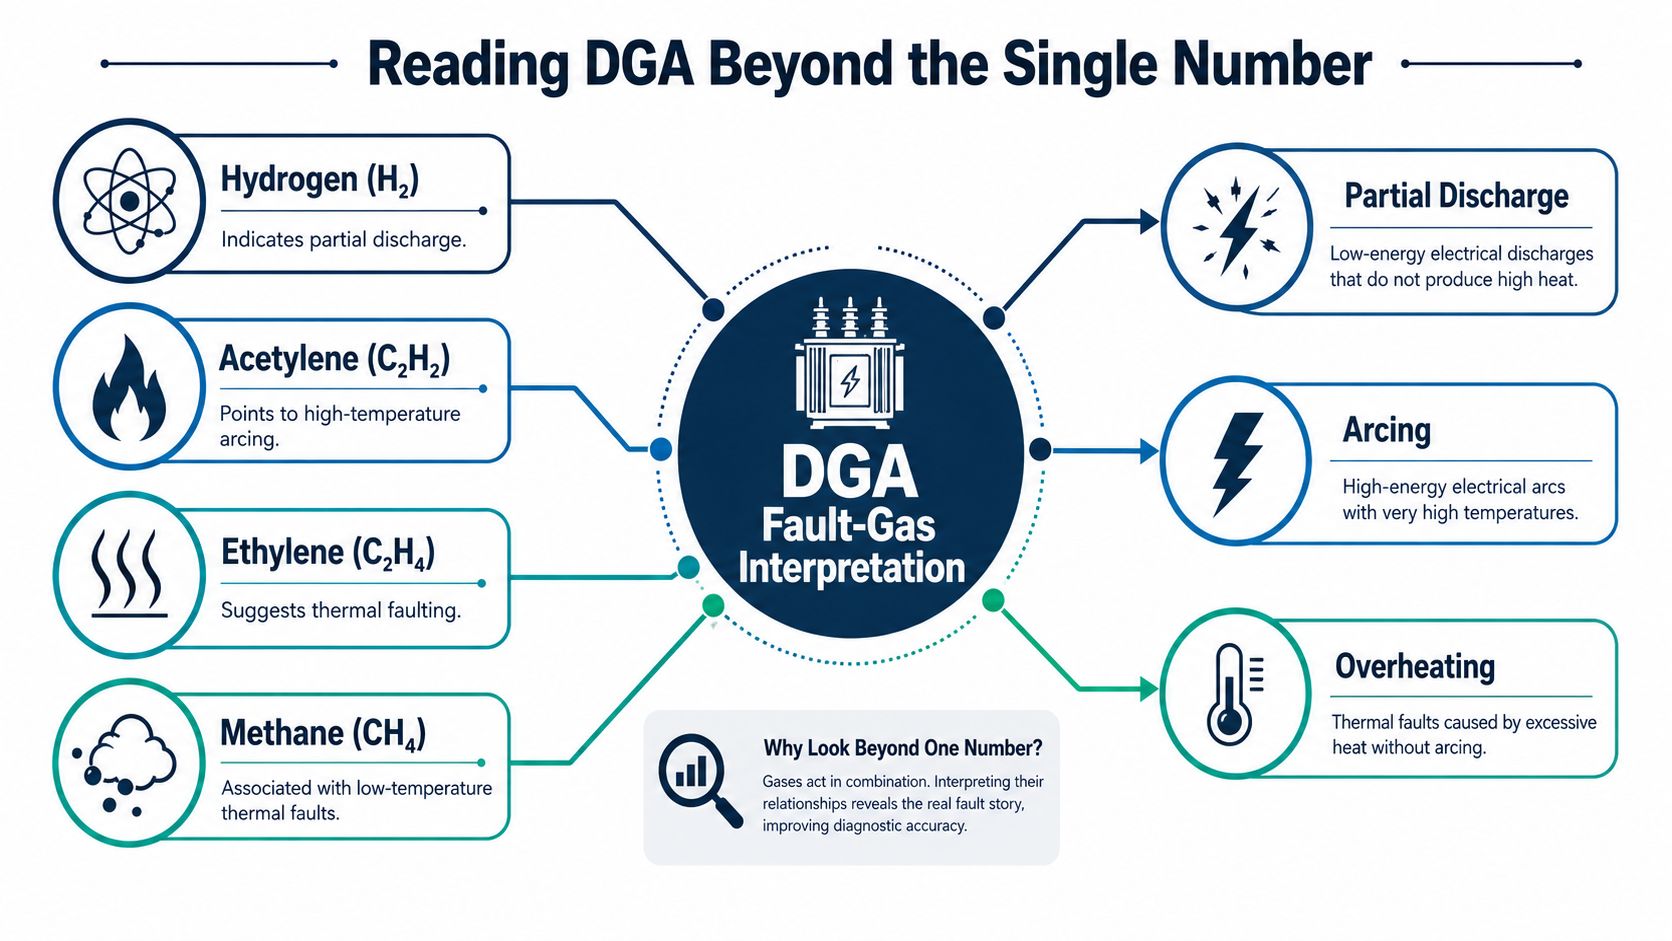
DGA is most useful when it's treated like language, not a scorecard. Hydrogen is often associated with partial discharge, acetylene points to arcing, and ethylene and methane often show up with thermal faults. Those gases don't just rise in isolation, they form patterns that help classify the fault.
Experienced engineers usually read those patterns with gas ratios and fault maps such as the Rogers method or Duval triangle, because ratios often say more than raw concentration alone. A unit with one high gas reading and otherwise flat chemistry can still be stable, while a drifting pattern across multiple gases can justify a close inspection.
A “normal” DGA doesn't clear the transformer if loading, moisture, or age suggest cellulose stress.
Oil-led aging is not the same as paper-led aging
The toughest call in transformer diagnostics is separating oil-led aging from paper-led aging. Oil tests can detect overheating, arcing, moisture, and paper deterioration, but a normal-looking gas result doesn't prove the paper is healthy. That's why CO, CO2, and furans need to be weighed together when the transformer is older or has a heavy loading history.
Oil analysis can reveal around 70% of a transformer's diagnostic information, yet interpretation is still the hard part (source). If the gases are muted but the furans and cellulose indicators are moving, the paper may be failing first. In that case, the maintenance decision isn't oil reclamation, it's usually a derating, inspection, or replacement conversation.
For a utility or plant asset with high criticality, DGA should be treated as one input, not the whole verdict. The oil can look calm while the paper is burning down slowly.
Sampling Integrity and Chain of Custody
Sampling errors create more bad decisions than many transformers do. If the sample is contaminated, the report can look alarming even when the unit is healthy, and that leads to unnecessary outages, confusion, and distrust in the program. For a 1 MVA pad-mounted transformer feeding a bottling line, that kind of mistake is expensive before anyone even opens the cabinet.
What a good sample looks like
A sound sample starts with the right container. A sealed aluminum bottle is preferred when possible, and the technician should record top-oil temperature at the time of sampling because temperature affects how the results should be read (source).
The valve should be flushed first to remove stagnant oil. The correct valve position matters too, because fluid density and sampling point can affect what gets pulled into the bottle. Once collected, the bottle should be kept dry, protected from sunlight, and sent for analysis as fast as possible.
Chain of custody is part of the test
A lot of programs treat labeling as admin work. That's a mistake. If the bottle doesn't carry an exact identity, time, and condition record, trend analysis gets weaker and the next decision gets riskier.
- Flush the sampling point: clear stagnant oil before collection so the sample reflects the transformer, not the valve.
- Record temperature and conditions: top-oil temperature changes interpretation, especially for moisture and gas readings.
- Protect the sample immediately: keep the bottle dry and out of sunlight to reduce air and moisture exposure.
- Move it fast: the earlier water content and dissolved gases are measured, the lower the chance of cross-contamination.
- Escalate when the result is implausible: if a report is wildly out of family, repeat the sample before acting on it.
One practical source on sampling integrity makes the point clearly, many bad results are really bad samples (source). That's why standardizing sampling practice is often the most significant improvement a plant can make. The best lab in the world can't rescue a contaminated bottle.
Oil sampling analysis belongs in the same reliability conversation as the chemistry itself, because the chain of custody is part of the diagnosis.
Test Frequency, Criticality, and Trending
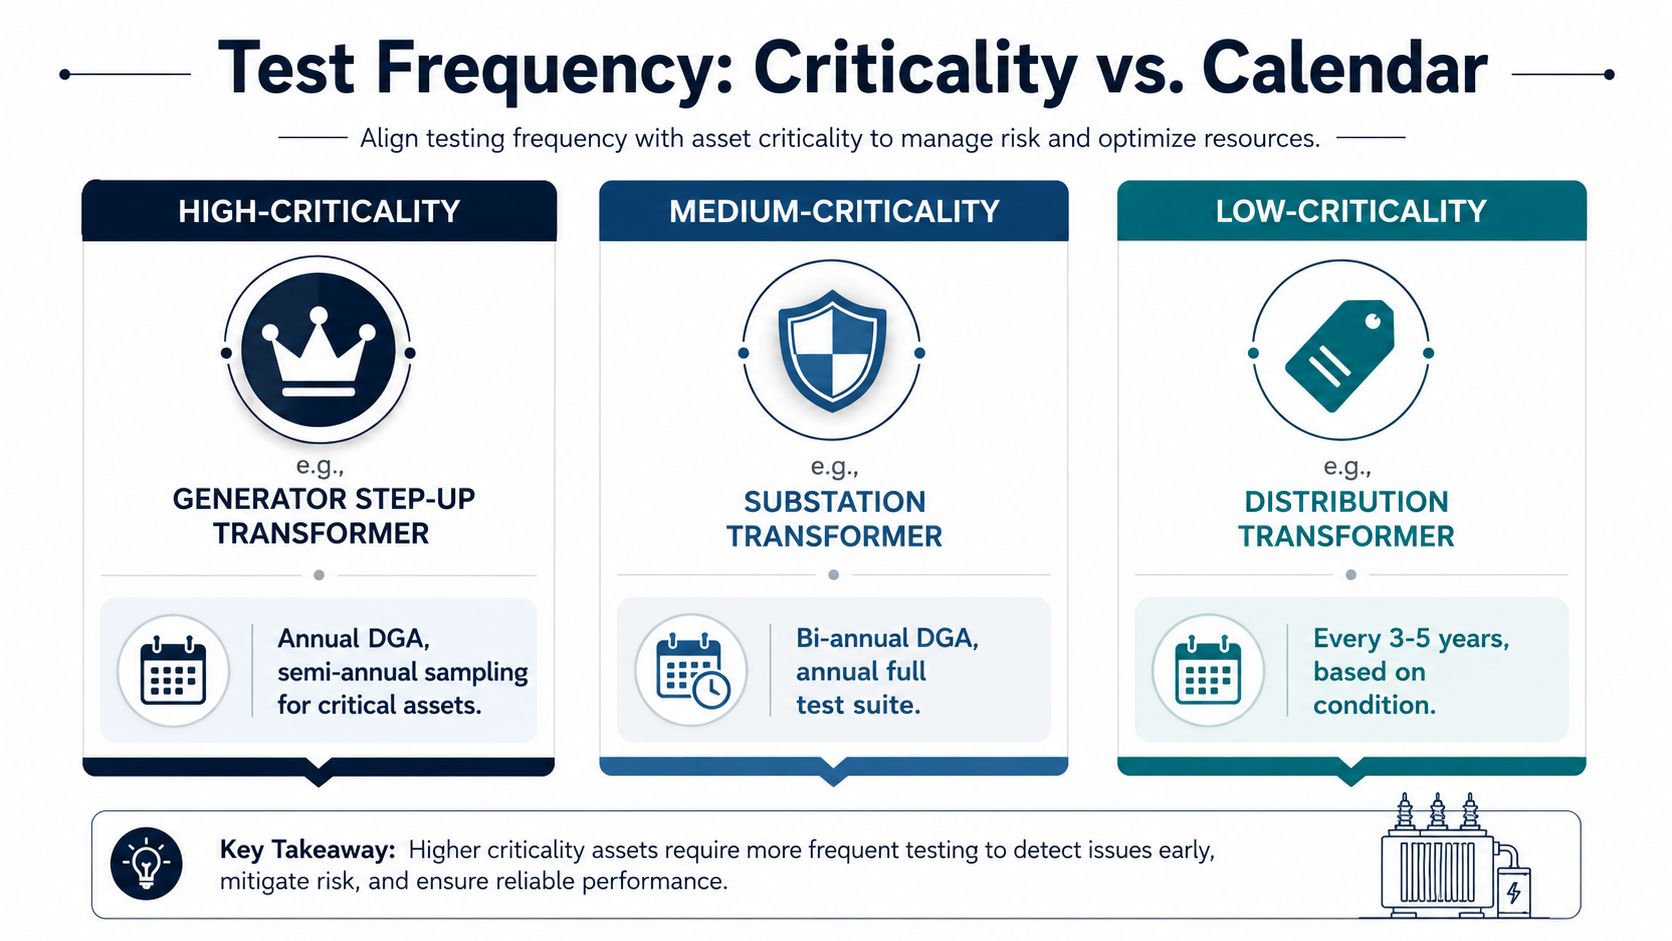
Frequency should follow risk, not habit
A liquid-filled transformer rated 500 kVA or larger should get at least annual oil testing as a maintenance baseline (source). That schedule works for many utility and industrial units, but it isn't enough for every asset.
High-criticality equipment, such as generator step-up transformers or process feeders that stop an entire line, often needs shorter intervals because the cost of missing a trend is much higher than the cost of sampling. Medium-criticality substation transformers can often stay on annual or semiannual review, while lower-criticality fleet units may be sampled less often if the condition history is stable.
Trending beats a single alarm
The point of repeat sampling is not to chase one number. It's to see whether moisture is creeping up, whether gas generation is accelerating, or whether CO and CO2 are drifting in a way that points toward paper stress. One abnormal report can be a container problem, a temperature mismatch, or a one-off event. Three consistent results are much harder to dismiss.
For a plant team that wants to move from route-based testing to smarter data flow, it helps to think about how the results will be handled once they arrive. A useful reference on how to choose a data processing model can help teams decide whether their oil data should sit in a scheduled review cycle or feed a faster response path.
Decision rule: if the transformer is critical, sample more often when the trend is moving, not after the failure mode is obvious.
Utility substations often tolerate longer intervals because the fleet is larger and the assets are more standardized. Plant switchgear feeding a bottling line, a furnace, or a compressor train usually can't. The criticality of the load should set the cadence, then the trend should tighten it further.
From Test Results to Maintenance Decisions
Oil data only matters when it changes the next work order. A good reliability team maps the pattern to an action, then assigns the cheapest intervention that addresses the mechanism. That's where transformer oil analysis moves from reporting to risk reduction.
Match the fault to the work
Rising moisture with falling BDV usually points toward drying, breather inspection, or a leak hunt. If the unit keeps taking in water, drying without fixing the ingress path is just temporary relief.
High acidity with low IFT points toward reclamation or, if the oil has passed practical recovery, replacement. Those metrics say the oil is oxidizing and building polar contamination, which is why filtration alone won't solve the chemistry.
DGA patterns tied to low-energy partial discharge usually justify internal inspection if the unit is critical or the trend is accelerating. Furans trending upward shift the discussion toward paper aging, which often means derating, life-extension planning, or replacement budgeting rather than oil treatment.
Put the oil program inside the larger PdM plan
Oil analysis should sit beside vibration, thermography, and ultrasound in a broader predictive maintenance plan. That broader view keeps a plant from overreacting to one data stream or underreacting because one test looks calm. It also keeps the team focused on the asset, not the report.
For organizations that need a structured way to set up the workflow, Forge Reliability offers oil analysis as part of its predictive maintenance services, along with other condition-monitoring methods. It fits best when the goal is to connect test results to action, not just to fill a binder.
The moisture-control example from the field is a useful reminder. In a population of 100 primary transformers rated from 132 kV down to 33 kV, annual moisture monitoring with a 30 ppm intervention point cut losses by about 90% over 8 years, and the average moisture content settled around 18 ppm (source). That is what good oil decisions look like, fewer surprises, fewer forced outages, and a maintenance plan that responds to what the transformer is doing.
Field Questions and Next Steps
What should happen when a result is wildly out of trend? The first move is to verify the sample before touching the asset. If the next sample confirms the result, the unit needs a mechanism-based response, not a generic oil change.
When should a team move from routine sampling to online DGA monitors? Usually when the transformer is critical, the trend is moving fast, or the load consequence is too high to wait for the next scheduled draw. Online monitoring becomes more attractive when a missed fault would take down a production line or a major utility feeder.
Can oil from different suppliers be mixed after top-ups? Only with careful attention to compatibility and the original fluid type. Mixing should never be assumed safe just because both fluids look similar in the drum.
What does low IFT and high power factor together usually mean? Oxidation and polar contamination are already serious enough to change the maintenance path. The next step is usually a closer internal review, because the oil is signaling contamination that can't be ignored.
For teams that want a baseline on sampling practice, test selection, and decision thresholds, oil analysis services can help frame the program around the asset instead of the calendar.
Forge Reliability can help baseline a transformer oil program against actual operating risk, from sampling procedure to test frequency to action thresholds. If a plant's reports feel inconsistent, a free reliability assessment can show where the program is strong and where the sampling or interpretation process is creating blind spots. Visit Forge Reliability to start that review and get the oil program aligned with the equipment that matters most.