
A route technician finds a sharp vibration increase on a large induced-draft fan during a Tuesday morning walk-down. The work order is raised, the bearing is replaced during a planned weekend outage, and production avoids an emergency shutdown later in the month. That result doesn't come from a single alarm value. It comes from a repeatable process that connects sensor placement, spectral diagnosis, operating context, and a maintenance decision.
Vibration analysis of machines gives reliability teams a non-intrusive way to assess rotating equipment while it operates. Motors, pumps, fans, compressors, gearboxes, and turbines all transmit information through their motion. The useful question isn't whether a machine is vibrating. It is which frequencies are present, where they occur, how they change, and what action the pattern supports.
Vibration analysis sits inside predictive maintenance, condition monitoring, and reliability engineering. Predictive maintenance supplies the maintenance strategy, condition monitoring supplies the evidence, and reliability engineering turns that evidence into better failure-mode controls, job plans, and operating decisions. The strongest programs also recognize the gap between periodic route collection and permanent monitoring, because overall vibration alarms alone can miss early fault clues hidden in frequency detail (Reliable Plant describes this monitoring gap).
Table of Contents
- Why Vibration Analysis Matters on the Plant Floor
- The Core Concepts Behind Machine Vibration
- Choosing Sensors and Mounting Methods That Hold Up
- Reading Frequency Spectra and Fault Signatures
- Route-Based versus Continuous Monitoring
- Setting Alarms and Thresholds That Operators Trust
- Connecting Vibration Findings to FMEA and RCM
- Bringing It Together and Next Steps
Why Vibration Analysis Matters on the Plant Floor
Turning a reading into a maintenance decision
A vibration reading earns its value only when someone can act on it. On a cooling-water pump, a rising overall value may justify a spectrum. On a critical compressor, a developing bearing signature may justify immediate engineering review, even if the broadband value still appears acceptable. The measurement has to connect to a known failure mode and an escalation rule.
The most common mechanical problems are imbalance, misalignment, looseness, and rolling-element bearing deterioration. Each changes the machine's dynamic behavior in a different way. An imbalance force usually follows running speed, coupling problems produce characteristic running-speed harmonics and directional changes, looseness creates repeated harmonics or subharmonics, and bearing damage introduces geometry-dependent impact frequencies.
A technician doesn't need to open the machine to collect the first evidence. A properly mounted sensor on a bearing housing can reveal a changing pattern while the motor, pump, or fan remains online. That makes vibration particularly useful for equipment where intrusive inspection would interrupt production or expose workers to process hazards.
Practical rule: An alarm should trigger a diagnostic question, not an automatic bearing replacement.
Why the trend matters
A single reading is a snapshot. A consistent trend shows whether degradation is stable, accelerating, or tied to a process condition. Route data becomes much more useful when technicians return to the same measurement point, in the same direction, under comparable load and speed.
Overall vibration can identify a meaningful change, but it doesn't always identify the cause. Temperature, acoustic inspection, oil analysis, motor current data, and process measurements can support the diagnosis. Vibration often serves as the earliest measurable signal of rotating-equipment degradation, while other indicators may become decisive later or under different operating conditions.
The field developed from qualitative machine-condition judgments into structured programs using severity charts, proximity probes, and spectral analyzers. Historical accounts trace the modern era to 1939, when T. C. Rathbone published qualitative vibration criteria, and to the 1960s, when overall vibration became widely used for condition monitoring. The 1965 fast Fourier transform milestone later made spectral analysis far more efficient for rotating machinery (DMC's history of vibration measurement).
For a plant manager, the practical outcome is straightforward. Vibration analysis helps move work from emergency response to planned intervention, but only when the site has defined measurement points, trustworthy data, trained interpretation, and a maintenance workflow that receives the findings.
The Core Concepts Behind Machine Vibration
Amplitude, frequency, and phase
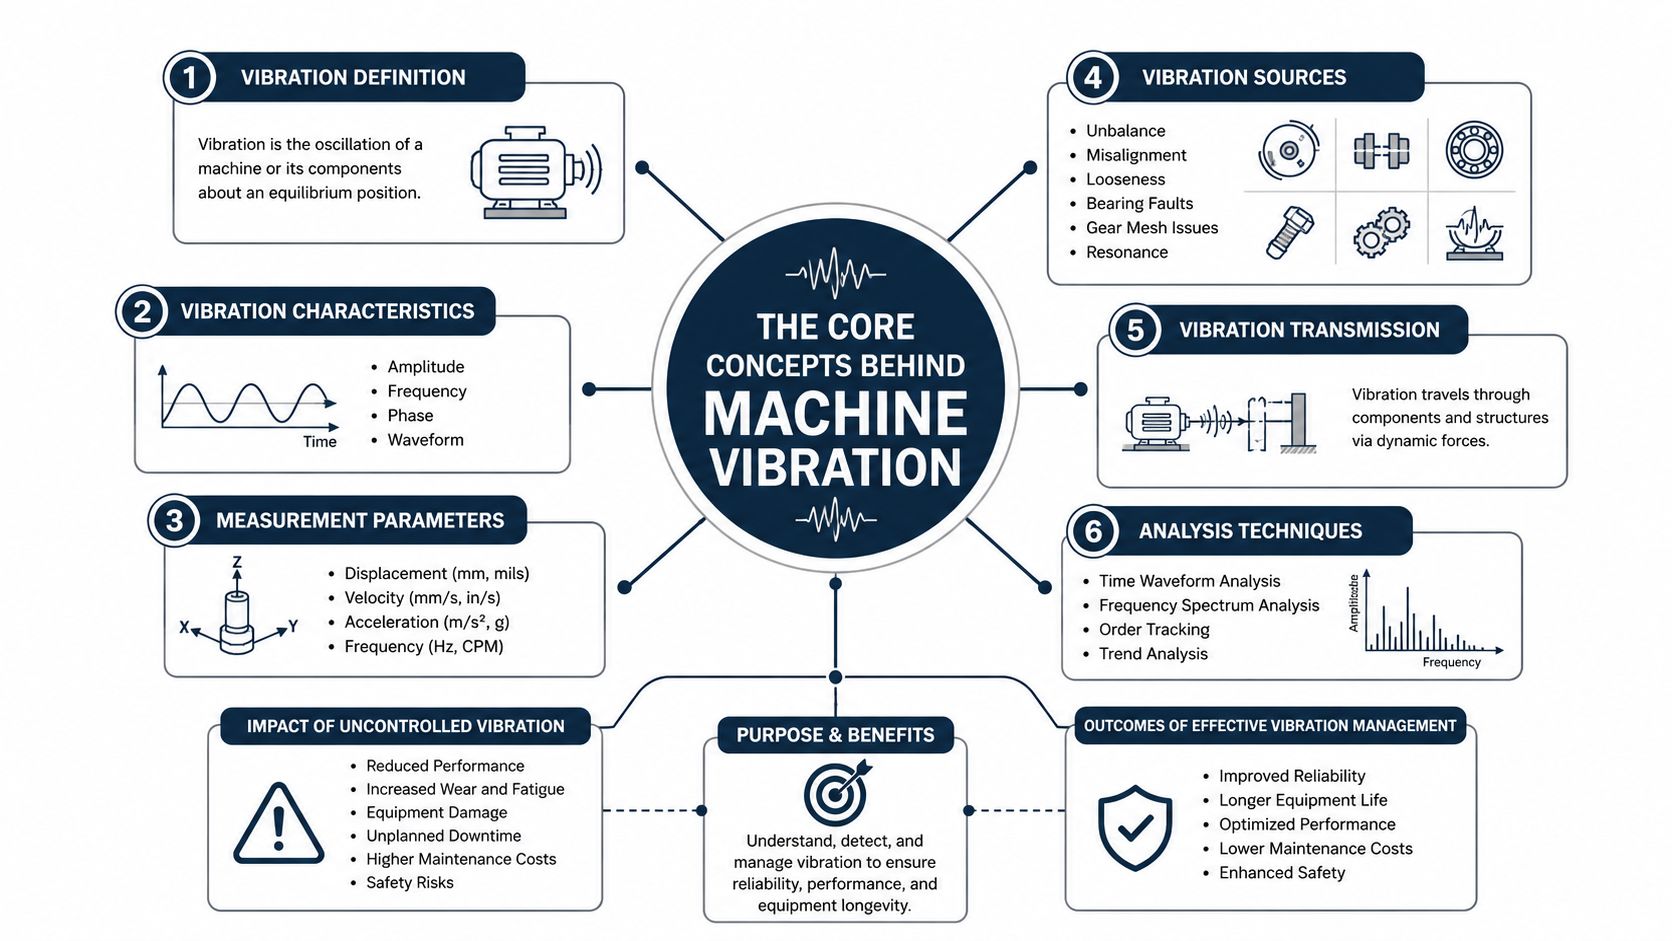
Vibration is motion that repeats or changes over time. A rotating shaft can move away from its normal centerline, while the bearing housing responds to forces transmitted through the machine structure. Amplitude describes the amount of motion or energy present. Frequency describes how quickly that motion repeats, in hertz or cycles per minute. Phase records the timing relationship between a vibration peak and a reference position.
Consider how a motor and pump respond differently. Imbalance produces motion once per revolution. Misalignment drives components at multiples of running speed and often produces a strong axial response. Overall amplitude can appear similar in both cases, yet frequency content and direction lead to different corrective work.
Frequency separates diagnostic signal from noise. A broadband value combines many components into one reading. An FFT spectrum, produced with a fast Fourier transform, separates those components for comparison with shaft speed, bearing geometry, gear ratios, and structural natural frequencies.
Choosing the right view
RMS represents the effective energy level of a vibration signal and supports severity trending. Peak values capture the highest excursion, making them useful for impacts or impulsive events that RMS can smooth out. Overall vibration works well for screening. Narrowband analysis isolates a selected frequency region when the cause needs to be identified.
The time waveform shows what occurs moment by moment. The spectrum shows where energy sits by frequency. Envelope analysis, also called demodulation, filters and processes high-frequency impacts, helping expose early bearing events when raw FFT impact energy is weak.
Physical forces create machine vibration. Residual imbalance produces rotating force. Coupling misalignment adds shaft and bearing loads. Structural resonance amplifies excitation near a natural frequency. Bearing defects generate impacts associated with rolling-element geometry. Gear tooth errors produce mesh-frequency components and sidebands.
Use one decision framework across route and continuous programs. Overall values can screen stable machines efficiently during route collection. A narrowband spectrum is warranted when a reading changes, a fault signature is suspected, or overall vibration cannot separate competing causes. Permanent instrumentation earns its cost when the machine is safety-sensitive, difficult to access, or capable of rapid failure between routes. During correction work, a precision balance setup also matters, and a practical lab balance table guide explains how a stable support surface supports measurement and balancing tasks.
Choosing Sensors and Mounting Methods That Hold Up
Sensor selection should begin with the fault target and machine construction, not with a preference for one transducer family. An accelerometer suits general-purpose casing measurements and high-frequency bearing or gear work. A velocity pickup can be more practical when a slow machine's dominant energy sits in a lower-frequency range and acceleration measurements carry excessive high-frequency noise. An eddy-current proximity probe measures shaft-relative displacement, which matters on sleeve-bearing machines where shaft position and clearance are central to machine protection.
The mounting method can change the usefulness of the data. A stud mount provides the most rigid connection and preserves bandwidth. Epoxy mounting can provide a durable semi-permanent point where drilling isn't practical. A magnetic base is fast for route collection, but its mechanical compliance reduces high-frequency response. A handheld probe is convenient for screening, yet repeatability depends heavily on pressure, angle, and exact placement.
| Sensor Type | Typical Bandwidth | Best Suited For | Mounting Method | Key Trade-Off |
|---|---|---|---|---|
| IEPE accelerometer | 1 Hz to 20 kHz | General casing vibration, bearings, gears | Stud, epoxy, magnet, or handheld probe | Broad coverage, but mounting quality controls high-frequency reliability |
| Velocity pickup | 4 Hz to 500 Hz | Slow-speed fans, mills, and lower-frequency machine behavior | Stud, magnet, or dedicated mount | Useful low-frequency response, with less high-frequency bearing detail |
| Eddy-current proximity probe | 0 to 1000 Hz typical, DC to 10 kHz | Sleeve-bearing machines and shaft-relative motion | Permanently installed probe system | Requires correct gap, target condition, and installation discipline |
The vibration analysis sensors guide provides additional context for matching transducers to machine and diagnostic requirements. Regardless of sensor family, measurement points should sit on or near bearing housings, preferably in horizontal, vertical, and axial directions where access allows. The loaded zone deserves attention because it transmits the dominant bearing forces, and the sensor should be as close to the rotational axis as practical without compromising safety.
Long cable runs to a control room can introduce cable noise, grounding problems, and signal degradation. Calibration drift also matters, especially when a site compares data across many assets or relies on permanent protection systems. A calibration program should record sensor identity, calibration status, mounting arrangement, and any replacement history.
Some large machines need dual mounting. A casing accelerometer captures structural response, while shaft-relative proximity probes capture rotor motion inside a sleeve bearing. Treating those signals as interchangeable creates confusion. They answer different questions.
Reading Frequency Spectra and Fault Signatures
Using the FFT as a diagnostic lens
When you examine an FFT spectrum, the first check is whether peaks align with shaft speed, bearing geometry, gear mesh, or structural response. Establish running speed from the machine operating condition, then compare the dominant peaks with the expected fault families. A waterfall display adds operating history, showing whether a peak grows, shifts, or remains stationary as load and speed change.
For a motor running at 1780 rpm, running speed is approximately 29.8 Hz. A dominant peak near 29.8 Hz with strong radial response points toward imbalance, although phase, load, mounting, and machine construction still require confirmation. Imbalance commonly falls near 0.8 to 1.2 times running speed (NCD's bearing-fault and vibration diagnostic guidance).
Misalignment commonly produces content around 2 to 6 times running speed, often with increased axial vibration. Looseness can produce components from about 0.5 to 3 times running speed, including harmonics and subharmonics. Treat these ranges as screening clues. Confirm the finding with peak shape, direction, phase, operating condition, and physical inspection.
Separating impacts from rotating forces
Rolling-element bearing faults require calculated defect frequencies. BPFO is the ball-pass frequency of the outer race, BPFI is the ball-pass frequency of the inner race, BSF is the ball-spin frequency, and FTF is the fundamental train frequency. The expected values depend on bearing geometry and shaft speed, so calculate them for the installed bearing rather than relying on a generic chart.
Envelope demodulation can expose weak, repetitive impacts. It emphasizes the high-frequency resonance excited by an impact, then extracts the modulation pattern associated with the defect frequency. Look for the predicted line, harmonics, sidebands, a raised high-frequency noise floor, and impulsive waveform behavior. The method is useful for rolling-element bearings in motors, pumps, fans, and gearboxes.
Gear faults often appear at gear-mesh frequency, with sidebands spaced by shaft speed. A resonance peak requires a different reading. It may remain fixed in frequency while the excitation changes, indicating a structural response rather than a rotating source.
| Fault | Characteristic Frequency | Dominant Direction | Spectral Pattern |
|---|---|---|---|
| Imbalance | About 0.8 to 1.2× running speed | Radial | Dominant running-speed peak with a stable phase relationship |
| Misalignment | About 2 to 6× running speed | Often axial, with radial response possible | Multiple running-speed harmonics and directional change |
| Looseness | About 0.5 to 3× running speed | Often radial | Several harmonics, subharmonics, and a distorted waveform |
| Bearing defect | BPFO, BPFI, BSF, or FTF | Direction depends on defect and load path | Defect-frequency harmonics, sidebands, impacts, and high-frequency energy |
| Gear damage | Gear-mesh frequency and shaft-spaced sidebands | Radial or casing direction | Mesh peak with sideband pattern and possible modulation |
| Resonance | Stationary structural natural frequency | Direction depends on structure | Fixed-frequency amplification as operating excitation changes |
Interpret the spectrum alongside machine history, process condition, phase, and inspection findings. A clean spectral match can still mislead if the sensor is mounted inconsistently or the machine is operating at a different load. Repeatable points and directions, covered in this guide to how to measure vibrations, make route data more trustworthy.
The final choice depends on degradation speed and consequence. Periodic spectra suit faults that develop gradually and remain accessible for follow-up. Permanent instrumentation earns its cost when a fault can progress between collections, operating conditions change quickly, or a missed event threatens production or safety.
Route-Based versus Continuous Monitoring
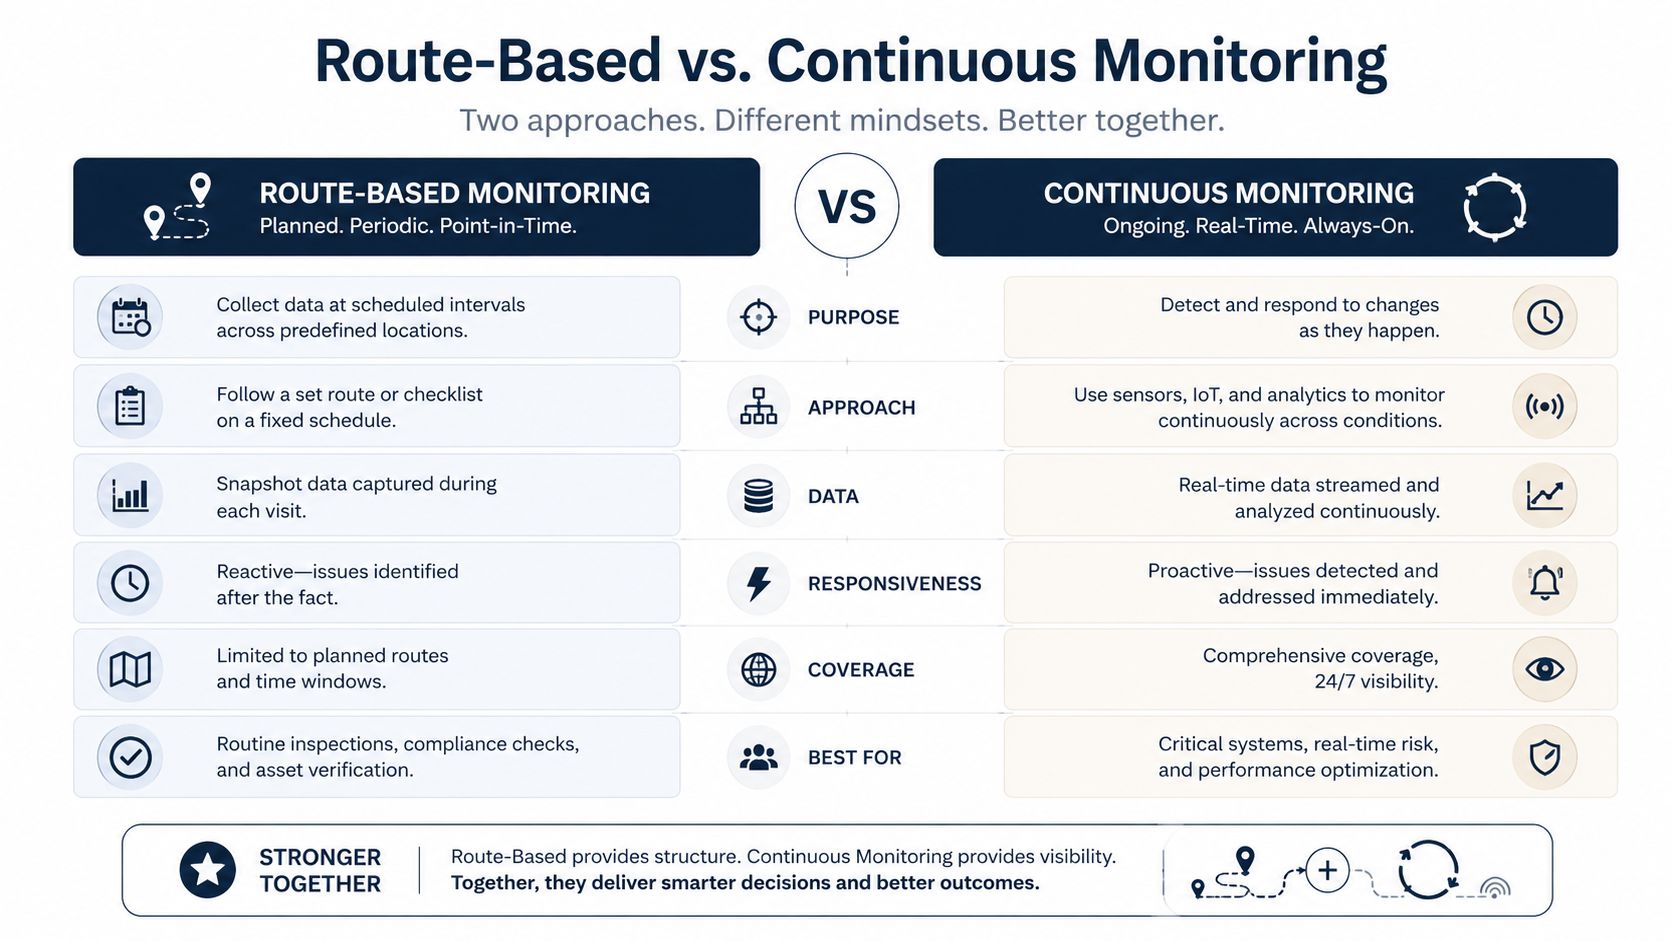
Route-based and continuous monitoring solve different operational problems. A portable collector with periodic FFT data remains effective for non-critical motors, pumps, and fans spread across a site. A trained technician can inspect the machine, verify operating conditions, listen for abnormal behavior, and collect additional spectra when an overall value changes.
Continuous monitoring makes more sense when a failure can develop between routes, when access is hazardous or difficult, or when the asset is so important that delayed detection carries unacceptable production risk. It can also capture transient behavior, startup events, changing loads, and short-lived bearing conditions that a scheduled visit may miss.
A decision framework for plant leaders
| Decision Factor | Route-Based Monitoring | Continuous Monitoring |
|---|---|---|
| Coverage | Broad coverage across many accessible assets | Focused coverage on selected critical assets |
| Data resolution | Periodic overall and spectral snapshots | Frequent or continuous trends, alarms, and event capture |
| Analyst workload | Higher field labor, concentrated interpretation | More data management and alarm review |
| Diagnostic depth | Strong when routes include quality FFT data | Strong for developing or transient faults when configured correctly |
| Best application | Scattered, lower-criticality rotating equipment | Critical pumps, compressors, gearboxes, and turbomachinery |
The common mistake is treating continuous monitoring as an automatic replacement for route analysis. Permanent nodes still need correct sensor placement, baseline definition, alarm logic, and human review. A poorly configured system can produce more alerts without producing better decisions.
Route data also has a valuable inspection component. The technician can observe lubrication leaks, loose guards, base damage, coupling condition, process changes, and unusual sound. Continuous systems provide persistence and speed, but they don't remove the need for physical verification.
The vibration analysis tools overview can help reliability teams think through the equipment and workflow required for either approach. Mature plants typically blend methods, using routes for general machinery and permanent instrumentation for assets where fault progression, access, safety, or production consequence demands faster detection.
Setting Alarms and Thresholds That Operators Trust
Alarm logic should distinguish severity screening from fault diagnosis. ISO 20816-3 covers coupled industrial machines above 15 kW operating from 120 r/min to 30,000 r/min, including pumps, compressors, motors, blowers, and fans (ISO 20816-3's standard scope). For machines approaching or below 600 r/min, the lower frequency response must be reduced so the running-speed component isn't missed.
The standard framework uses four condition zones. Zone A represents newly commissioned or as-new condition. Zone B supports unrestricted long-term operation. Zone C indicates unsatisfactory continuous operation and the need to schedule remedial action. Zone D indicates severe vibration likely to cause damage (this ISO vibration severity zone summary).
A plant shouldn't copy one broadband limit across every asset. Machine class, foundation, speed range, sensor response, operating load, and baseline condition all affect the meaning of a measurement.
Using thresholds without creating alarm fatigue
| Machine Class | Good (mm/s RMS) | Acceptable | Warning | Danger |
|---|---|---|---|---|
| Class I, small machines on rigid foundations | Not specified here | Not specified here | 2.8 | 4.5 |
| Class II, medium pumps and motors | Not specified here | Not specified here | 4.5 | 7.1 |
| Class III, large turbines | Not specified here | Not specified here | 5.4 | 8.5 |
The warning and danger values above should be treated as evaluation references, not automatic trip settings. The ISO vibration standards resource can support a more complete review of classification and application.
Broadband velocity limits can miss early bearing damage because impact energy may rise in a high-frequency band before the overall value changes significantly. Operators should receive a manageable combination of overall severity, narrowband trends, envelope indicators, crest factor, and event notifications.
A practical alarm hierarchy uses baseline behavior as the starting point, then adds a controlled margin. The specified approach of 10 to 20 percent above baseline can establish an initial plant-specific alert, but it must be validated against operating states and revised as components age. Threshold reviews should occur regularly, with analysts checking whether alerts resulted in confirmed faults, process changes, poor mounting, or noise.
Operator-facing rule: Every alarm needs an owner, a response time, and a defined next measurement.
Connecting Vibration Findings to FMEA and RCM
Vibration data becomes strategically useful when it changes the failure analysis. In an FMEA, a confirmed bearing race defect on a cooling-water pump can raise the assessed likelihood of a functional failure and justify a revised inspection, lubrication, or replacement strategy. A slowly rising running-speed component on a fan may increase concern about imbalance or structural condition without immediately requiring the same response.
The distinction is important. FMEA ranks failure modes by their effects, causes, detection, and risk. Vibration analysis improves the detection evidence and can reveal whether the failure mode is active, developing, or absent. The analyst should attach the spectrum, waveform, trend, operating state, and inspection findings to the asset record rather than leaving the interpretation in an email.
Selecting the right RCM task
Reliability-centered maintenance asks whether a condition-directed task can detect a failure early enough to support a useful intervention. Vibration monitoring can replace a fixed-time teardown when the fault produces a measurable, actionable signature and the inspection interval is short enough to catch progression. It can supplement time-based work when a planned overhaul still controls other failure modes. It may be inappropriate when the failure is hidden, instantaneous, or too low-consequence to justify monitoring.
A single-screw compressor gearbox illustrates the decision. Envelope demodulation identifies an outer-race spalling pattern months before a planned overhaul. The team doesn't automatically dismantle the gearbox. Instead, it validates the bearing frequency, checks lubrication and load conditions, increases observation, stages parts, and defers disassembly by one quarter while preserving a controlled intervention plan.
| Vibration Finding | FMEA Impact | Recommended RCM Task |
|---|---|---|
| Stable low overall value and clean spectrum | Low evidence of active rotating fault | Continue route monitoring at the approved interval |
| Rising 1× component with radial dominance | Increased imbalance or coupling concern | Confirm phase, inspect balance and alignment, then correct the cause |
| 2× to 6× content with axial elevation | Higher misalignment likelihood | Perform alignment verification and inspect coupling condition |
| Predicted bearing frequency with impacts and sidebands | Increased bearing-failure likelihood | Validate envelope data, review lubrication, stage parts, and plan intervention |
| Broadband increase without a matching fault pattern | Uncertain failure mode or process influence | Repeat measurement, verify mounting, check operating state, and broaden diagnosis |
The reliability-centered maintenance framework helps place each finding into a defensible task-selection process. For budget reviews and audits, the evidence package should include the original baseline, trend plot, alarm history, diagnostic spectrum, work-order outcome, and the resulting FMEA or RCM decision.
Bringing It Together and Next Steps
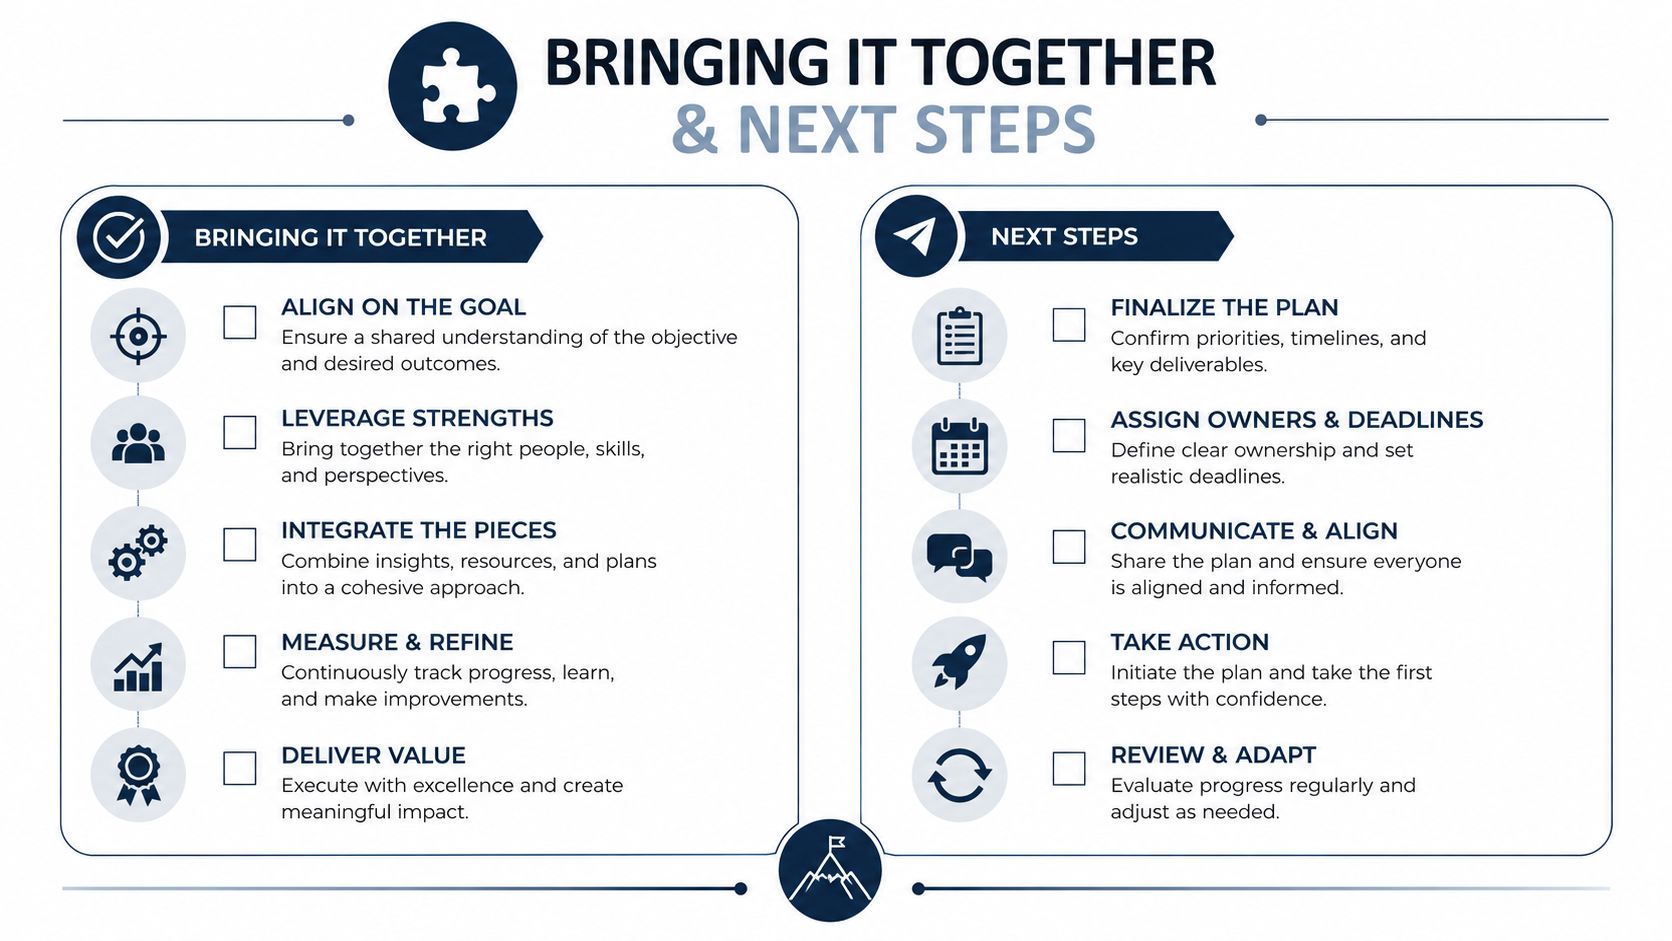
A reliability lead can turn the framework into a practical rollout without waiting for a perfect database or a sitewide technology purchase. The first requirement is consistency. Every point needs a known location, direction, sensor, speed, load state, and response path.
A Monday-morning execution checklist
- Rank the assets. Start with pumps, compressors, fans, gearboxes, turbines, and other machines whose failure affects safety, production, or difficult access.
- Define failure modes. Record imbalance, misalignment, looseness, bearing damage, gear faults, and resonance where each applies.
- Select the sensor. Match accelerometers, velocity pickups, or proximity probes to speed range, bearing design, and diagnostic target.
- Standardize mounting. Prefer stud or durable fixed mounting for diagnostic points. Document magnetic or handheld locations used for route screening.
- Mark measurement points. Use repeatable bearing-housing positions in horizontal, vertical, and axial directions where practical.
- Capture a baseline. Collect overall values, spectra, and operating context before setting plant-specific alarms.
- Calculate expected frequencies. Enter bearing geometry, shaft speed, gear ratios, and machine configuration into the diagnostic record.
- Separate screening from diagnosis. Use overall values to identify change, then use narrowband spectra, waveforms, phase, and envelope analysis to determine cause.
- Assign escalation rules. Each warning needs an owner, a review deadline, and a defined follow-up measurement.
- Choose route or continuous coverage. Use permanent monitoring where fault latency, criticality, access, or operating variability justifies it.
- Connect findings to work management. Include evidence, recommended action, priority, parts, and operating restrictions in the work order.
- Review the program. Revisit sensor condition, mounting quality, alarm performance, and FMEA or RCM decisions as the fleet changes.
A practical 90-day rollout can sequence these actions. The first phase establishes criticality, points, sensors, and baselines. The next phase validates spectra, thresholds, and response ownership on a focused group of assets. The final phase reviews alarm quality, closes the loop through work orders, and decides which additional assets deserve continuous coverage.
The first audit usually finds gaps, such as incorrect mounting locations, textbook alarm limits, incomplete asset data, or spectra that nobody reviews. Those are calibration points, not evidence that the program has failed. The important measure is whether the plant can convert a changing vibration pattern into a timely, documented reliability decision.
Forge Reliability offers vibration analysis, route-based and continuous condition monitoring, and reliability consulting for rotating equipment, with programs that connect diagnostic findings to FMEA, RCM, and maintenance planning. Visit Forge Reliability to request a free reliability assessment and benchmark sensor practices, alarm logic, monitoring coverage, and response workflows against the framework above.