
Most advice on CMMS asset management starts too late. It starts with software features, dashboards, and work order screens, as if the platform itself creates reliability discipline. It doesn't. A CMMS can just as easily preserve bad habits in digital form as it can support a serious reliability program.
That's why many plants feel disappointed after implementation. They bought a system, loaded assets, trained users, and still struggle with recurring pump failures, weak preventive maintenance execution, and poor visibility into what's driving downtime. The missing pieces usually aren't another dashboard or another report. They're asset structure, naming discipline, failure coding, and a clean handoff between condition monitoring and maintenance planning.
A CMMS becomes valuable when it helps reliability engineers, maintenance managers, and operations leaders make better decisions about failure modes, intervals, criticality, and lifecycle cost. In a food plant, that might mean tracing repeat gearbox failures on a packaging conveyor to lubrication contamination and correcting both the task and the interval. In a refinery, it might mean linking vibration alarms on a compressor train to a planned intervention before the unit forces an outage.
Table of Contents
- Why Your CMMS Is Not Yet an Asset Management Program
- Building the Foundation with Asset Hierarchies and Tagging
- Master Data Governance The Unseen Engine of Reliability
- Aligning Work Orders and Preventive Maintenance Strategy
- Integrating PdM Data for True Predictive Capability
- Turning Data into Dollars with KPIs and Lifecycle Planning
- A Phased Implementation and Migration Checklist
Why Your CMMS Is Not Yet an Asset Management Program
A plant doesn't have an asset management program just because it has a CMMS login. That assumption is one of the most expensive mistakes in maintenance. A work order system records activity. An asset management program uses that activity to control failure risk, optimize maintenance effort, and support capital decisions.
That distinction matters more now because CMMS is no longer niche software. The market is projected to grow from about US$1.636 billion in 2023 to approximately US$4.215 billion by 2033, at a CAGR of 9.1%, according to CMMS market projections and adoption data. That projection shows how standard these systems have become in asset-intensive operations. It doesn't prove those operations are using them well.
A reactive plant can still look organized inside a CMMS. Technicians close work orders. Planners schedule PMs. Managers review dashboards. Meanwhile, a critical cooling water pump keeps failing from seal distress, misalignment, or cavitation, and nobody can separate one mechanism from another because the failure history is vague. “Pump issue” isn't failure analysis. It's paperwork.
Practical rule: If the CMMS can't help a team explain why an asset failed, it's still acting like a filing cabinet.
True asset management requires decisions about criticality, strategy, and consequence. It asks different questions:
- Criticality first: Which assets can stop production, trigger safety risk, or create quality loss?
- Failure mode focus: Is the team managing bearing fatigue, lubrication failure, contamination, electrical insulation breakdown, or operator-induced damage?
- Lifecycle view: Is the plant spending money to preserve useful life, or repeatedly restoring failed condition at premium cost?
For maintenance leaders responsible for uptime, the CMMS should support the same thinking used in reliability work. That means linking assets, tasks, failure codes, costs, and condition data in a way that helps operations decide where to intervene next. Plants that want that shift usually need process redesign as much as software cleanup. That's where structured operations and maintenance support becomes more useful than another round of screen customization.
Building the Foundation with Asset Hierarchies and Tagging
A CMMS can't support sound analysis if assets are arranged like a parts room shelf. The hierarchy has to reflect how the plant operates, how equipment fails, and how maintenance work is planned. Without that structure, cost rolls up to the wrong place, repeat failures disappear into parent assets, and planners can't tell whether a problem belongs to a line, a machine, or a component.
In a food and beverage facility, a packaging line is a good example. If a conveyor gearbox failure is logged only against “Line 3,” the team loses technical meaning. If it's logged too low, such as only against a replaceable bearing with no link to the conveyor system, the team loses system context. Good hierarchy design keeps both.
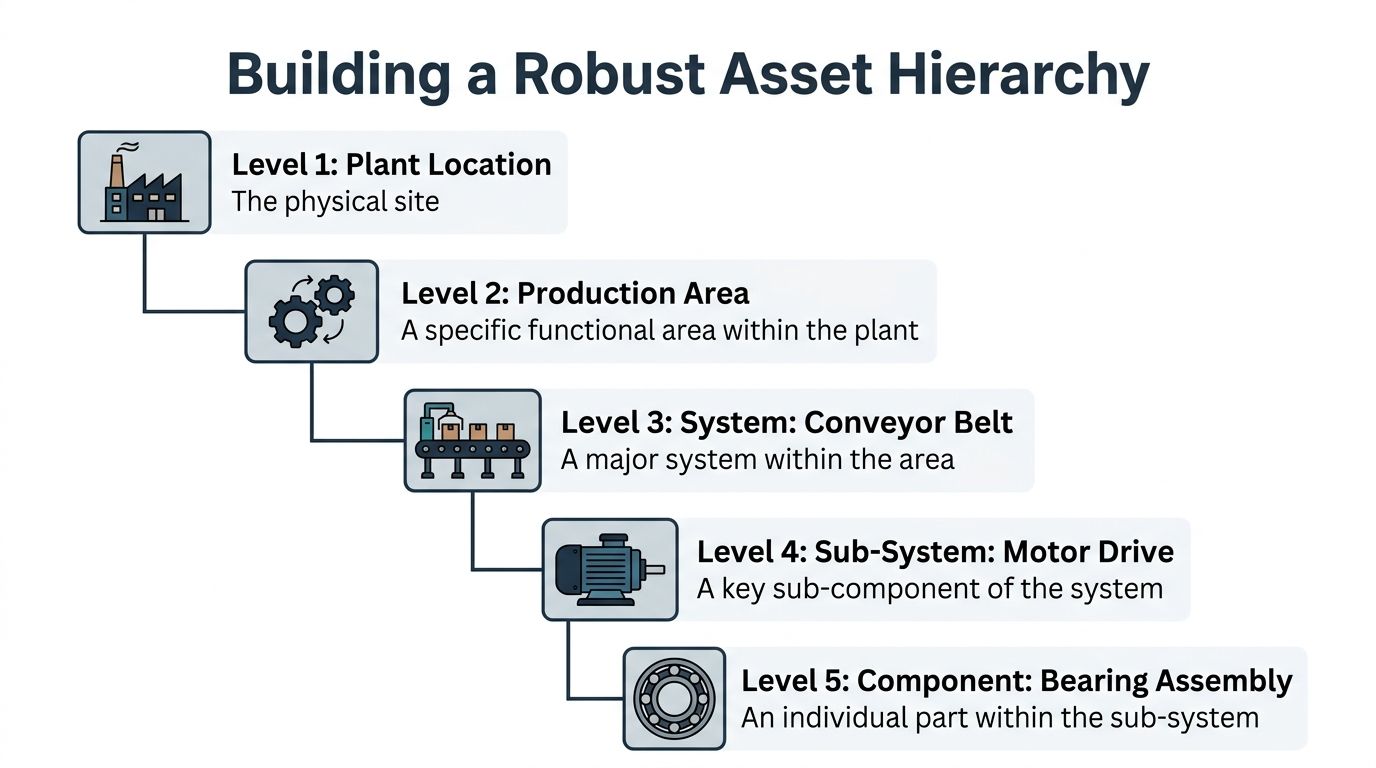
Functional locations versus maintainable assets
A functional location is where a process function happens. A maintainable asset is the equipment item technicians inspect, repair, replace, align, lubricate, or rebuild. Plants often mix the two and create reporting chaos.
A practical structure for a packaging line usually follows this logic:
- Plant location: The physical site.
- Production area: Packaging, mixing, utilities, warehouse.
- System: Case conveyor, filler, labeler, palletizer.
- Sub-system: Drive assembly, product feed, control panel, lubrication circuit.
- Maintainable asset or component: Motor, gearbox, coupling, bearing housing, photoeye.
That structure lets the team answer two different questions. Operations can ask which line system is constraining throughput. Reliability can ask which gearbox model is showing abnormal wear, backlash, or oil contamination.
Tagging rules that hold up over time
Tagging should be readable on the floor and stable in the database. If technicians can't identify the correct asset quickly, they'll choose the nearest match or skip the field. That one shortcut weakens every downstream report.
Useful tagging rules include:
- Keep the parent-child logic visible. A conveyor drive asset should clearly belong to the correct conveyor and line.
- Separate identical assets by duty and location. Two gearboxes with the same model number aren't interchangeable in analysis if one runs washdown duty and the other runs dry service.
- Avoid nickname drift. “North conveyor,” “pack line conveyor,” and “CV-03” can't all be accepted names.
- Decide what gets its own history. Motors, gearboxes, pumps, and valves often deserve individual records. Consumables usually don't.
A common failure in food plants is overbuilding the hierarchy. Teams create records for every small part, then technicians stop using the system because selecting the right asset takes too long. Underbuilding causes a different problem. The team loses failure mode visibility on items that drive downtime, such as a gearbox with recurring overheating from overfill, misalignment, or water ingress.
A scalable hierarchy isn't the most detailed one. It's the one that lets the team trace cost, downtime, and failure mode to the right decision point.
When plants want their hierarchy to support criticality ranking, PM design, and lifecycle planning instead of just asset lists, structured asset management services usually create more value than another bulk import.
Master Data Governance The Unseen Engine of Reliability
Most CMMS failures aren't software failures. They're master data failures. The hierarchy may look clean on rollout day, but if asset names drift, failure codes overlap, and technicians close work with vague notes, the CMMS stops being a reliability system and becomes a noisy archive.
That's why master data governance matters more than feature depth. A plant can't calculate meaningful failure intervals, compare like-for-like assets, or identify chronic bad actors if the same pump appears under multiple names or if every breakdown is closed as “mechanical failure.”
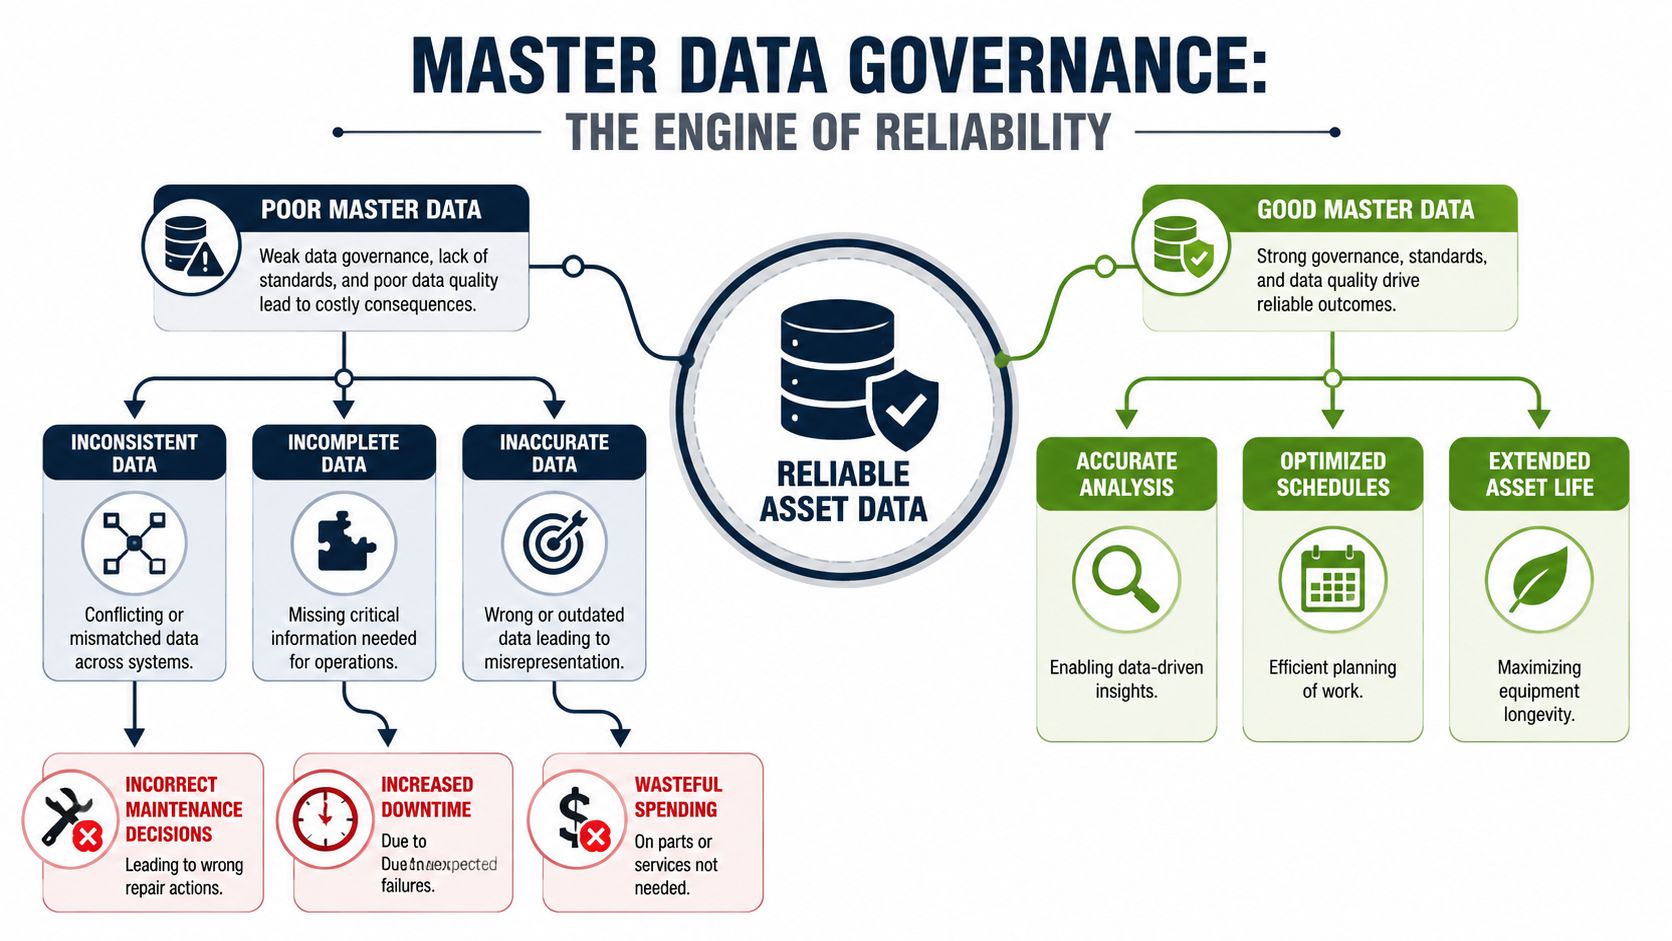
What governed data changes in practice
The performance difference is material. CMMS configurations with high-quality master data and governed asset records can achieve 80–90% PM compliance and see demonstrable MTBF improvements within 12–18 months, while sites with poor data often struggle to exceed 60% PM compliance and see rising unscheduled downtime, according to this discussion of asset master data in CMMS. The same source notes that this level of integrity is a prerequisite for advanced reliability analysis such as Weibull.
In a chemical plant, critical process pumps show the problem clearly. If one pump's seal failures are logged under several tag variations, and repair notes alternate between “seal leak,” “packing leak,” “mechanical issue,” and “repaired pump,” the reliability engineer can't establish recurrence or compare operating contexts. MTBF becomes mathematically possible but operationally useless. For plants that need a deeper governance framework, general data governance best practices offer a useful reference point for ownership, standards, and change control.
The minimum governance model that works
Good governance doesn't need bureaucracy. It needs decisions that stay enforced.
- Asset naming standard: One approved format for equipment class, location, and sequence.
- Failure code taxonomy: Distinct codes for failure mode, symptom, cause, and remedy. Don't collapse them into one field.
- Required closure fields: Work type, failed component, cause code, downtime attribution, and meter reading where relevant.
- Change control: New assets, renamed tags, and hierarchy edits should follow review, not convenience.
- Criticality ranking: Classify assets by production, safety, environmental, and quality consequence so reporting reflects business reality.
A pump example shows why this matters. Suppose a process pump sees repeated bearing damage. Without governed fields, the plant may blame bearing quality. With proper coding, the record may show a pattern: increased vibration, grease incompatibility after rebuild, and repeated soft foot after motor replacement. That changes the response from more frequent replacement to alignment correction, lubrication standardization, and task redesign.
Field lesson: Dirty data rarely fails loudly. It quietly trains the plant to accept weak decisions.
When teams want to evaluate whether the history they've collected can support interval analysis, failure mode review, and defensible MTBF calculations, master data quality is the first place to look.
Aligning Work Orders and Preventive Maintenance Strategy
A CMMS should do more than issue recurring work. It should trigger the right work at the right time for the right reason. Plants lose money when preventive maintenance is detached from actual asset usage and failure behavior. They also lose credibility when PM completion looks strong on paper but doesn't prevent breakdowns.
The biggest shift usually comes from moving beyond pure calendar logic. A haul truck in mining, a process pump in chemicals, and a fan in a cement plant don't accumulate wear solely because a month passed. They accumulate wear through load, starts, contamination, temperature, and operating hours.
Choosing the right trigger
Shifting from static calendar intervals to meter-based PM triggers within a CMMS can reduce premature or unnecessary maintenance by 25–40% and decrease failure-related downtime by 15–25% when PM compliance is high, according to this CMMS guide covering meter-based maintenance. That improvement happens because wear is nonlinear. Equipment like pumps and compressors doesn't age by the calendar alone.
A mining fleet shows the trade-off well. If a haul truck receives service every quarter regardless of operating hours, one truck may be overmaintained while another runs deep into fatigue because it worked a heavier route profile. Meter-based scheduling aligned to engine hours gives planners a truer exposure measure. Condition-based triggers go one step further by acting on actual machine health.
Comparison of PM Triggering Strategies
| Strategy | Trigger | Data Requirement | Pros | Cons |
|---|---|---|---|---|
| Time-based | Calendar date | Basic asset record and schedule | Simple to deploy, easy to audit | Overmaintains lightly used assets, misses heavily used ones |
| Meter-based | Runtime hours, cycles, output, mileage | Reliable meter capture in CMMS | Better aligns work to wear exposure | Fails if meters are inaccurate or missing |
| Condition-based | Alarm threshold, inspection finding, trend deviation | Condition data, clear limits, response rules | Focuses effort where degradation is real | Requires disciplined data flow and planning response |
What good work order design looks like
The trigger is only part of the strategy. The work order itself has to capture information that helps the next decision.
For a reciprocating compressor PM, a useful work order should include:
- Inspection points: Vibration condition, temperature trend, oil condition, fastener looseness, coupling condition.
- Failure-focused observations: Valve leakage signs, rod drop indicators, abnormal noise, lubrication contamination.
- Decision logic: Continue operating, inspect sooner, plan outage work, or escalate for immediate review.
- Closure discipline: Meter reading, findings, failed component if any, and action taken.
Plants often undermine PM strategy with poor task design. A task that says “inspect compressor” teaches nothing. A task that instructs the technician to inspect crosshead lubrication, review vibration route history, verify running temperature, and document any knock or pressure instability starts to build reliable history.
Where task quality is inconsistent, maintenance leaders usually need stronger execution standards, not just schedule changes. A practical guide on standard operating procedures can help teams tighten the structure of inspection and PM instructions so completion produces usable data. Teams weighing the boundary between calendar PM and advanced triggers can also use a clear predictive versus preventive maintenance framework to match strategy to asset criticality and failure behavior.
Integrating PdM Data for True Predictive Capability
Predictive maintenance fails when it lives outside the CMMS. A plant may collect vibration data, thermography images, oil analysis results, and motor current signatures, but if those findings don't change planning priority or generate traceable work, the program stays diagnostic instead of operational.
That disconnect is still common. Industry surveys indicate that less than half of asset-intensive organizations tightly integrate sensor-based condition data with their CMMS, despite the proven impact on MTBF and unplanned downtime, according to this discussion of CMMS and reliability integration. The gap matters because predictive maintenance only creates value when detection leads to disciplined execution.
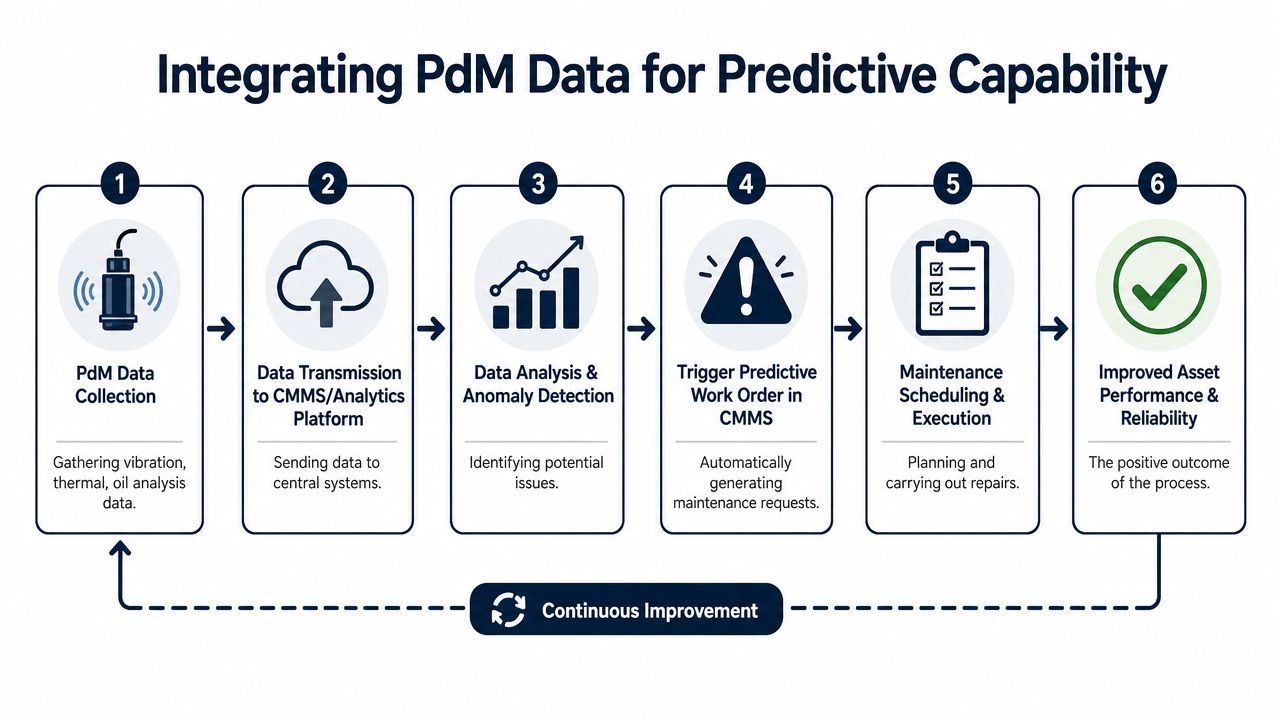
Closing the loop from detection to action
A functional integration model has a simple sequence:
- Collect condition data through route-based or continuous monitoring.
- Evaluate the signal against alarm limits, trend behavior, and asset context.
- Create or escalate work in the CMMS with the right asset tag and priority.
- Plan the intervention around risk, production schedule, labor, and parts.
- Capture findings at execution so the failure history reflects what was observed and corrected.
- Feed results back into alarm settings, intervals, and task design.
That loop sounds obvious, but plants often break it in small ways. A vibration analyst sends a report by email. A planner creates a generic work order without the spectral finding. The technician repairs the asset but doesn't close the condition finding properly. The next analysis cycle has no clean feedback.
The point of PdM isn't to identify defects. It's to convert a defect into planned work before the asset forces a consequence.
The turbine example that proves the point
In a power plant, consider a steam turbine auxiliary pump train or turbine-driven support equipment under continuous vibration monitoring. The system detects an emerging bearing defect signature. The analyst reviews trend acceleration, confirms the defect is real rather than process noise, and assigns risk based on speed, load, and redundancy.
A predictive-capable CMMS should then do several things well:
- Link the alert to the correct asset record.
- Create a high-priority work order with the diagnostic summary attached.
- Reference the suspected failure mode, such as outer race bearing degradation, looseness, or lubrication distress.
- Route the job to planning with required craft, outage window, and parts implications.
- Preserve the result when the job closes so the history improves future decisions.
For rotating assets, machine learning and reliability engineering begin to complement each other. Models may help sort patterns faster, but the plant still needs a governed asset structure and work process to act on the prediction. A practical reliability workflow connects condition monitoring, planner response, and asset history in one chain. Plants exploring that next step often start with a focused predictive maintenance and machine learning approach tied to specific critical assets rather than plant-wide experimentation.
Turning Data into Dollars with KPIs and Lifecycle Planning
The CMMS becomes strategic when it helps maintenance leaders justify action in business terms. Reliability teams already know a chronic equipment problem is costly. Operations and finance usually need that cost translated into availability loss, maintenance burden, and replacement logic.
The core KPI set should stay narrow. Too many dashboards blur accountability. The useful question isn't how many charts the system can generate. It's whether the metrics support a decision on strategy, resources, or capital.
The KPI set that matters
Effective programs track at least five core KPI categories: asset availability, MTBF, OEE, maintenance cost per asset, and work order completion rate, and critical asset availability in manufacturing often targets 93–98%, according to asset management KPI guidance. Those metrics become meaningful only when the underlying asset records and work history are structured correctly.
In a pharmaceutical plant, OEE can reveal where a reliability problem is constraining throughput. A blister packaging line may appear balanced across several machines until the CMMS history shows one cartoner repeatedly driving minor stops and maintenance labor consumption. That doesn't automatically mean replacement. It may point to a narrow failure set such as carton jam sensors drifting out of position, servo overheating, or recurring drive backlash.
Useful KPI interpretation usually works like this:
- Asset availability shows how often a critical unit is ready when production needs it.
- MTBF indicates whether corrective action is extending operating intervals or merely restoring function.
- OEE helps operations see whether maintenance loss is affecting throughput, quality, or both.
- Maintenance cost per asset highlights where reliability effort or redesign is economically justified.
- Work order completion rate shows whether the organization is executing the plan.
Decision test: If a KPI can't drive a change in task design, parts strategy, staffing, or capital planning, it's probably being monitored out of habit.
Using KPI history for repair versus replace decisions
Lifecycle planning depends on trend quality, not one bad month. A CMMS should help answer whether an asset is becoming more expensive to own, more disruptive to production, or more difficult to maintain safely.
Consider a clean-in-place system pump set in a pharmaceutical facility. If the history shows rising corrective work, repeat seal replacements, increasing downtime, and growing maintenance cost relative to comparable pumps, the team has a basis for structured review. The root issue may be poor seal environment, material selection, off-design operation, or simple age-related deterioration. Each path leads to a different decision: redesign, task revision, operating change, spare strategy adjustment, or replacement planning.
For instance, some plants use Forge Reliability for asset management work that connects CMMS history to criticality ranking, lifecycle cost analysis, and reliability-centered maintenance decisions. That type of support is most useful when a plant already has data but needs help converting it into actions that operations and finance will support.
A Phased Implementation and Migration Checklist
CMMS reset projects fail when teams try to fix everything at once. A phased approach is safer and usually faster because it forces the plant to prove the workflow before scaling it. In an automotive plant, starting with a single assembly line is often more effective than rebuilding the entire site hierarchy and PM library in one push.
The first win should be operational, not cosmetic. If the pilot line starts producing cleaner failure history, stronger PM compliance, and better planning decisions, the rest of the site will follow more easily.
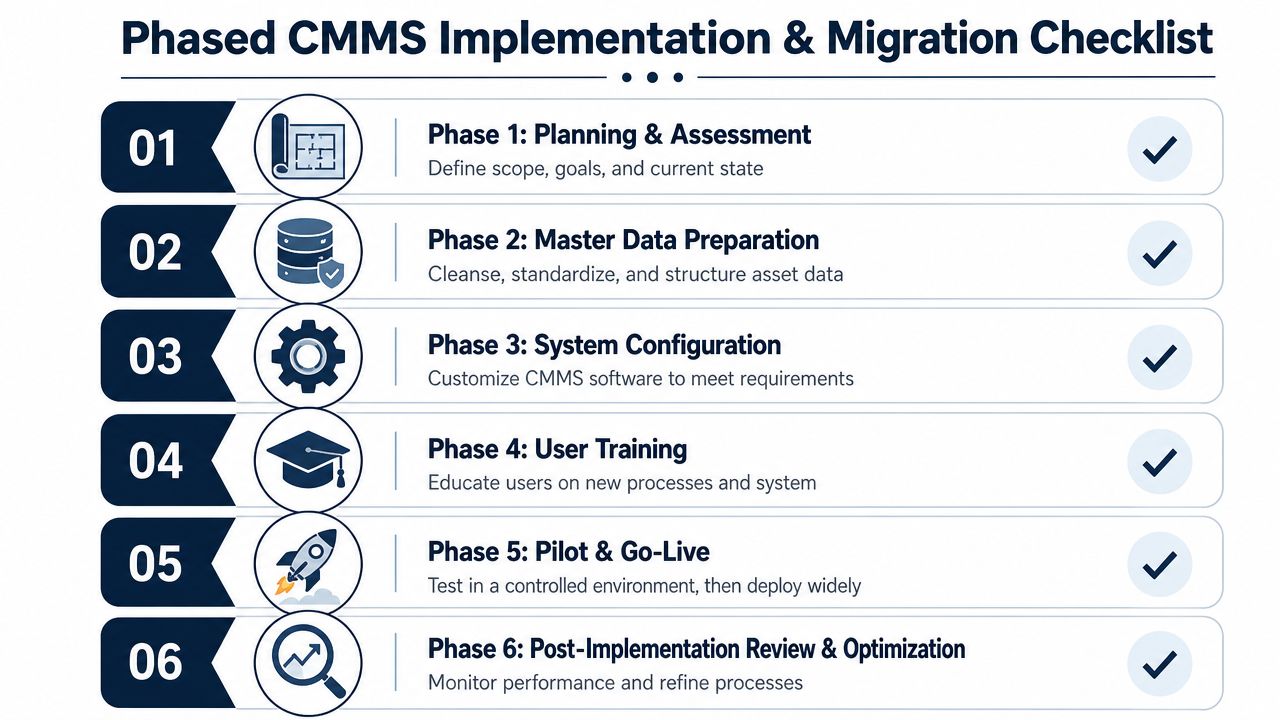
A practical checklist looks like this:
- Phase 1 planning and assessment: Form a cross-functional team with maintenance, reliability, operations, and planning. Define the pilot area and the asset classes that drive most downtime or maintenance effort.
- Phase 2 master data preparation: Clean tags, remove duplicates, define naming rules, and finalize failure code taxonomy before migration.
- Phase 3 system configuration: Set required fields, work order types, PM templates, meter logic, and approval steps to match the pilot workflow.
- Phase 4 user training: Train by role. Technicians need closure discipline. Planners need prioritization rules. Supervisors need review routines.
- Phase 5 pilot and go-live: Launch in one contained area such as an assembly line, utilities system, or packaging cell. Audit usage daily at the start.
- Phase 6 review and optimization: Review bad records, missed fields, confusing codes, and weak PM tasks. Fix them before full-site rollout.
A few checkpoints matter more than the software cutover itself:
- Choose assets with visible consequence. The pilot should include equipment that operations cares about.
- Define success before launch. Don't wait until after go-live to decide what improvement looks like.
- Audit closure quality early. Bad habits harden quickly.
- Scale only what works. Don't replicate a flawed taxonomy or weak PM template site-wide.
Plants that want stronger CMMS asset management usually don't need more software. They need cleaner asset data, sharper failure coding, better PM logic, and a direct link between condition monitoring and planning. Forge Reliability helps manufacturers and process plants benchmark those gaps and build practical reliability programs around them. For a free reliability assessment, reach out to review asset hierarchy quality, PM and PdM alignment, and the failure history needed to improve uptime.