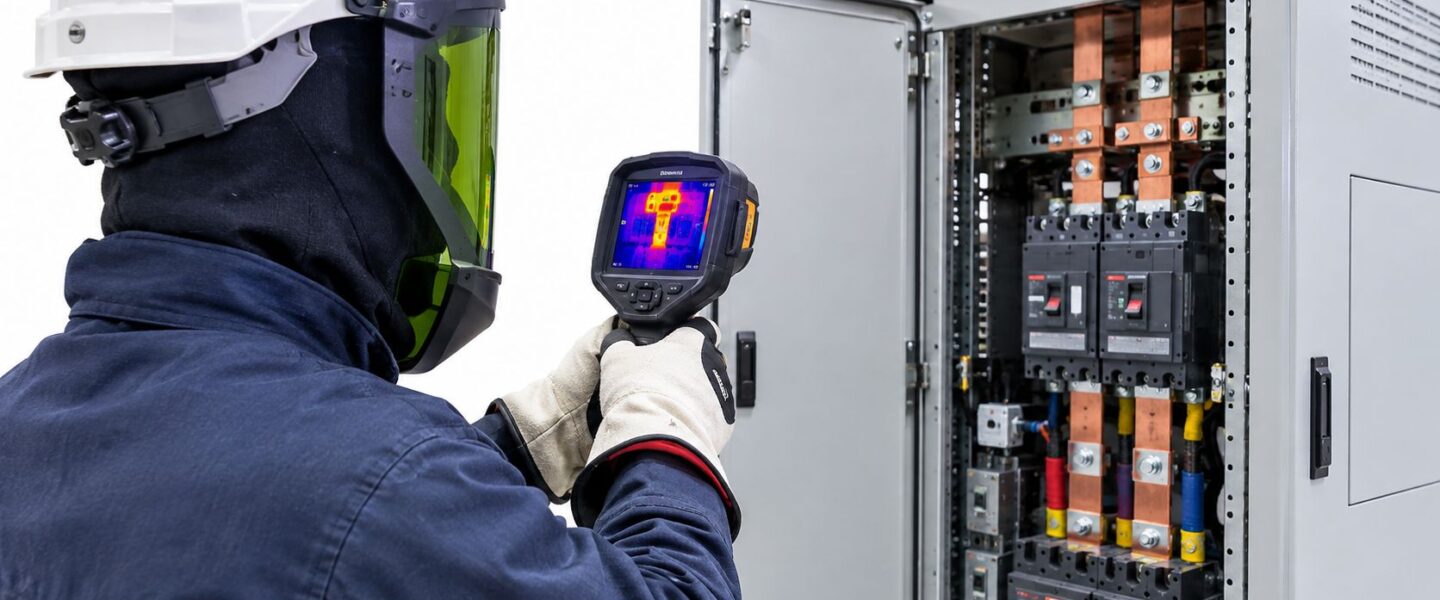
A maintenance manager receives the same message during a production run: one motor control center is warm, but no breaker has tripped and no operator alarm has appeared. A quarterly route-based scan may reveal the problem, but the camera alone won't explain whether the cause is a loose termination, overload, phase imbalance, reflection, or a low-load false negative. That distinction determines whether the plant schedules a controlled repair or waits for an electrical failure.
A sound thermography electrical inspection is therefore more than pointing an infrared camera at energized equipment. It's a load-dependent condition assessment supported by safe access, correct measurement geometry, comparable references, defensible severity criteria, and a work-order process that verifies the repair. The following approach is designed for reliability engineers, maintenance managers, and operations leaders responsible for switchgear, MCCs, transformers, distribution panels, and other high-consequence electrical assets.
Table of Contents
- What Thermography Electrical Inspection Actually Solves
- Pre-Inspection Planning and Safety Controls
- Camera Setup and Measurement Geometry
- Inspection Procedures by Equipment Family
- Interpreting Thermal Patterns and Severity
- When Handheld Scans Stop Being Enough
- Reporting Findings and Closing the Loop
What Thermography Electrical Inspection Actually Solves
During a 480V motor control center route, a reliability engineer may find one breaker stab running 28°C hotter than neighboring stabs under load. The thermal image doesn't prove the exact root cause, but it identifies a meaningful outlier. A loose line-side interface, oxidation, damaged contact pressure, or another resistance-producing defect becomes the next inspection target, not an invisible problem left to progress until a trip or arc-flash event.
Electrical resistance heating is the central failure mechanism. A degraded termination produces localized heat, while an overloaded conductor or phase imbalance can create a broader pattern across a circuit. Cooling failures can also appear as abnormal heat distribution around transformers, drives, and enclosures. The value lies in finding these conditions while equipment is energized and operating, when the thermal response is visible.
Practical rule: A hot spot is a symptom. The maintenance decision depends on load, comparison, geometry, and the corrective action that follows.
Thermography can't see through a metal cabinet, inspect the inside of a sealed bus duct, or diagnose equipment that is de-energized and producing no operating heat. It also won't replace insulation testing, power-quality analysis, protective-device testing, ultrasonic inspection, vibration analysis, or visual examination. A camera detects emitted infrared energy from accessible surfaces. It doesn't identify every electrical defect.
That makes thermography a complementary predictive-maintenance method. A route can identify an abnormal termination, while an electrician confirms torque and condition, a power-quality study investigates harmonics or imbalance, and a follow-up scan verifies the repair. Teams building a broader detection strategy can also pair this work with electrical fault detection and use a structured morning safety walk-through guide to identify access, housekeeping, labeling, and safety issues before the scan begins.
The practice has also moved beyond an informal best practice. Infraspection Institute first published infrared thermography guidelines in 1988, those guidelines were later adopted by hundreds of companies worldwide, and they were renamed standards beginning in 2007. ASTM E1934 was originally approved in 1997 and continued through later revisions, including the 2024 reapproved edition, a timeline documented by the infrared standards history. For an industrial reliability program, that history matters because repeatable inspection quality is now part of the expectation, not an optional camera exercise.
Pre-Inspection Planning and Safety Controls
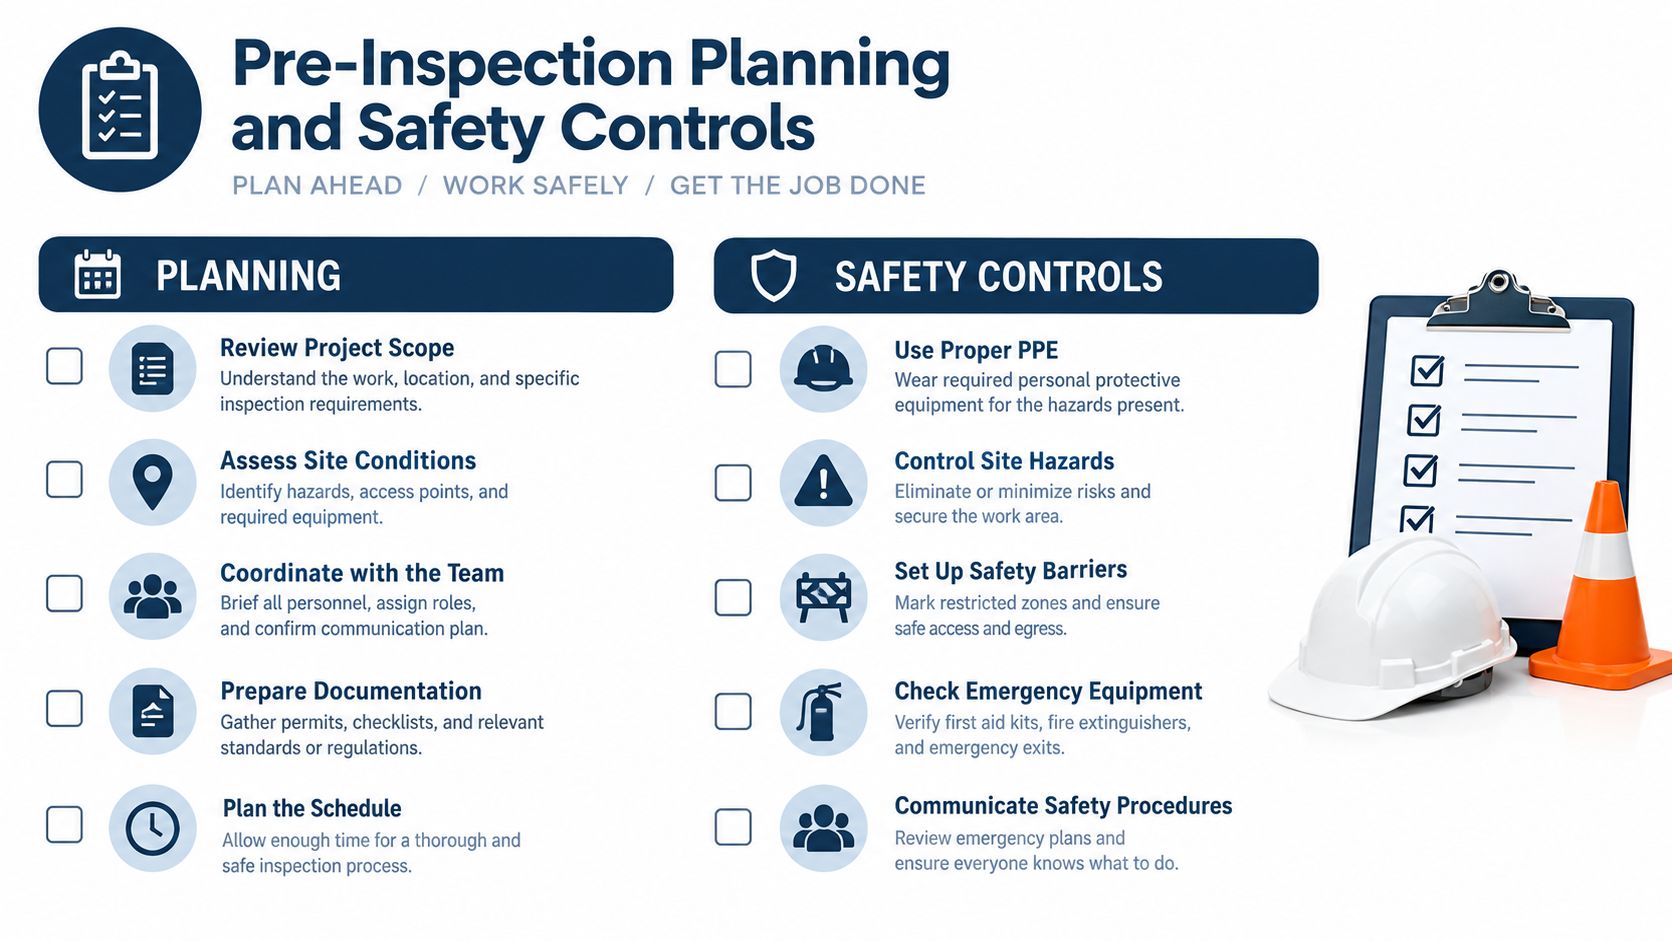
A thermographer arrives at a switchgear lineup, finds one hot termination, and later discovers the image was assigned to the wrong feeder. The technical scan was completed, but the inspection failed as a maintenance-control process. Planning must connect safe access, operating conditions, asset identity, and follow-up work before the camera enters the electrical room.
Establish the equipment boundary
Start with the current one-line drawing and verify it against the field. Confirm asset IDs, panel names, feeder destinations, voltage levels, and critical loads. A mislabeled MCC bucket can route a legitimate finding to the wrong work order. An unrecognized critical feeder can also cause operations to make an unsafe switching decision.
Thermography usually requires energized equipment with covers closed, or access under an approved electrical safety procedure. Lockout/tagout boundaries still apply because the crew may find damaged enclosures, water intrusion, adjacent equipment needing isolation, or conditions beyond the planned scope. Before entry, verify approach boundaries, incident-energy information, required PPE, and the site's NFPA 70E work practices.
Coordinate operating conditions
NFPA 70B changed electrical thermography from a recommended practice to a mandatory inspection requirement in its 2023 edition. It calls for infrared inspections at intervals not exceeding 12 months, while high-risk Condition 3 equipment requires inspection every 6 months, as summarized in NFPA 70B thermography maintenance guidance. Industry reporting also cites fewer than 35% of facilities performing inspections at the required frequency, indicating a scheduling and governance problem rather than a camera problem.
Keep fans, pumps, downstream motors, heaters, and process equipment operating normally whenever safe and practical. Record the operating state for every asset, including unusual process conditions and recent load changes. Control-room personnel should know the route timing so a planned change is not mistaken for an unexplained thermal event, and so the thermographer's position does not trigger a nuisance trip.
Teams coordinating routes across multiple condition technologies can review structured condition monitoring systems before finalizing the inspection schedule. The schedule should prioritize equipment whose failure affects safety, production, or power distribution, not the easiest panels to access.
Confirm the load and field conditions
NFPA 70B states that inspections should occur at normal circuit loading. If that is not feasible, a load of not less than 40% of nominal circuit loading is permitted, according to the NFPA 70B electrical thermography document. Bureau of Reclamation guidance emphasizes maximum practical load, comparable loading for trending, stabilization after load changes, and a viewing angle as close to perpendicular as possible. Angles above 45 degrees can introduce measurement errors, while reflections from nearby hot objects can create false hotspots, as explained in its infrared inspection field guidance.
Wet, recently washed, or chemically cleaned equipment should dry before scanning. Moisture changes apparent temperature and weakens comparisons between similar components. Before departure, confirm camera calibration status, clean the lens, load the route sheet, verify asset labels, and ensure the report records load, ambient conditions, and any limitation that could affect severity decisions.
Camera Setup and Measurement Geometry
A food-processing plant switchgear scan illustrates why camera configuration matters. Anodized aluminum bus bars were configured with an emissivity value that was too high, causing the surface to read 15°C lower than its actual apparent condition and nearly masking a developing finding. The issue wasn't camera sensitivity. It was a measurement model applied to the wrong surface.
Set the four measurement inputs
Emissivity describes how efficiently a surface emits infrared energy. Painted or oxidized conductors generally provide a stronger measurement surface than polished metal. Polished copper and aluminum can reflect surrounding heat, so the thermographer must use a verified surface value or place an appropriate high-emissivity target where the inspection procedure permits it.
Reflected temperature isn't ambient air temperature. It represents infrared energy reflected from nearby buswork, lighting, walls, adjacent hot components, and other surroundings. Atmospheric temperature and humidity affect the path between camera and target, particularly over distance. The camera's distance-to-spot ratio determines whether the detector can resolve the target rather than blending it with surrounding material.
| Surface Material | Condition | Emissivity (ε) |
|---|---|---|
| Painted conductor | Dry, matte surface | 0.95 |
| Oxidized conductor | Dull, weathered surface | 0.95 |
| Polished copper | Clean, reflective surface | 0.10 to 0.30 |
| Polished aluminum | Clean, reflective surface | 0.10 to 0.30 |
| Bus bar | Low-emissivity reference condition | 0.07 |
These values should be treated as inspection starting points, not automatic truth. Surface oxidation, coatings, dirt, viewing angle, and reflected energy can change the apparent reading. A qualified thermographer should document the selected value and avoid presenting uncertain absolute temperatures as precise measurements.
Control focus and geometry
Manual focus often matters more than autofocus when the target is distant or partially obscured. A blurred lug can spread a small hotspot across surrounding pixels, reducing the apparent peak temperature and making a localized defect look less severe.
The camera should be aimed as close to perpendicular to the target as practical. Guidance for electrical thermography warns that angles of incidence above 45 degrees can produce measurement errors, while a field procedure may target a much narrower angle for reliable comparisons. Staying within roughly 30 degrees of perpendicular is a useful operational discipline when cabinet access allows it.
Lock the span and level to the expected temperature range instead of allowing the camera to rescale every image automatically. Auto-scaling can make separate images look comparable when the color distribution has changed. Iron and rainbow palettes can help distinguish a 10°C to 20°C contrast across similar components, but color is not a severity standard. The numerical delta and the reference selection carry the decision.
Comparisons within one image are usually more reliable than isolated absolute temperature readings. The working currency is delta-T, the temperature difference between a suspect component and a similar phase or identical component under similar load. Additional guidance on camera technique and inspection documentation is available in infrared thermography electrical and mechanical inspections.
Inspection Procedures by Equipment Family
Equipment family determines where resistance heating is likely to appear and which thermal patterns deserve attention. A route sheet should record ambient conditions, load percentage of nameplate, asset history, and the inspection date before any cabinet is opened or viewed through an access point.
| Equipment Family | Priority Scan Targets | Common Failure Indicator |
|---|---|---|
| Switchgear | Primary disconnects, breaker stabs, bus joints, cable terminations | Localized heating at a high-current interface |
| Motor control center | Starter line sides, contactor lugs, fused disconnects, VFD feeders | One phase or lug hotter than comparable phases |
| Transformer | LV bushings, bolted connections, cooling fan contactors, tank surface | Connection hotspot or broad abnormal tank pattern |
| Distribution panel | Like circuits, breakers, lugs, phase terminations | Outlier temperature under comparable load |
Switchgear and MCCs
Switchgear deserves deliberate positioning because primary disconnects, breaker stabs, bolted bus joints, and cable terminations carry substantial current and can develop resistance without immediate protective-device operation. The thermographer should compare equivalent breaker interfaces and examine whether heating is concentrated at one contact or distributed through the conductor.
In an MCC, the line side of starters and contactor lugs deserves priority. Feeders supplying variable frequency drives may require attention to harmonic-related heating, particularly at terminations and neutral paths. The camera should not be used to declare a VFD healthy based on a cool enclosure alone. The thermal pattern must be tied to load, phase comparison, and the equipment's electrical design.
Transformers and distribution panels
A transformer scan should include low-voltage bushings, bolted connections, cable terminations, and cooling fan contactors. The tank can also be pattern-mapped. A broad warm area may indicate cooling loss or winding-related imbalance, but the image is a screening result that should lead to electrical and mechanical confirmation, not a stand-alone internal diagnosis. Teams managing this equipment can integrate thermography with condition monitoring of transformers.
Distribution panels are best scanned panel-by-panel with like circuits compared under similar load. The inspection record should identify the feeder, breaker, phase, conductor, and downstream process. A hot lug on a chiller feeder carries a different operational consequence from a similar reading on a lightly loaded convenience circuit, even when the thermal contrast looks similar.
Connection defects dominate much of the failure problem. One technical source reports that about 60% of electrical anomalies are connection-related, while 85% of new anomalies found in follow-up inspections were also connection-related, pointing toward recurring workmanship or maintenance-quality issues. The same source reports about 92% success for cleaning and reassembling contacts, compared with about 20% success for merely tightening connections, as documented in electrical inspection failure analysis. A repair plan should therefore investigate contact condition, oxidation, torque, alignment, and contamination rather than defaulting to a quick retorque.
Interpreting Thermal Patterns and Severity
A thermal image becomes actionable only after the thermographer selects a credible reference. The suspect lug should be compared with an identical lug, phase, breaker stab, or connection under similar loading. Absolute temperature alone can mislead because ambient conditions, load, emissivity, geometry, and surface finish all affect the reading.
NFPA 70B-based guidance calls for comparison among similar electrical components under similar loading and against ambient air temperature. A review of NFPA 70B thermography requirements illustrates the practical logic with a motor-control-center breaker stab. The outlier becomes more credible when adjacent identical stabs on the same feeder carry comparable current.
Read the pattern before assigning urgency
A localized bright area at a lug, stab, fuse clip, or cable termination usually points toward resistance at that interface. The repair investigation should consider looseness, oxidation, damaged contact surfaces, poor crimping, contamination, or loss of spring pressure.
A similar rise across all three phases suggests a different problem. Overload, restricted cooling, or harmonic effects can heat a broader region rather than a single connection. A wide warm zone across a transformer tank may indicate a cooling problem or winding imbalance, while a phase-to-phase outlier requires load confirmation before the team concludes that the connection itself is defective.
The referenced guidance classifies a temperature difference of more than 15°C between similar components under similar loading as a condition needing immediate repair. Differences above 40°C are treated as critical in several inspection guides, as summarized by this electrical thermography severity guide. These thresholds should be aligned with the facility's approved standard, NETA-based tables, safety rules, and engineering judgment.
Work through a real comparison
Consider a 400A distribution panel feeding industrial chillers. One lug reads 18°C hotter than adjacent lugs under comparable operating conditions. That crosses the cited immediate-action threshold. If one phase carries 380A and another carries 250A, the load difference must be investigated before assigning the temperature entirely to a loose lug, because current imbalance can create a legitimate thermal difference.
The work order should direct an electrician to verify current, torque, contact surfaces, conductor condition, and phase loading. After correction, the panel should be rescanned under comparable load. Guidance on motor-specific thermal interpretation is available through thermographic inspection for induction motors, but the same discipline applies across electrical assets: classify the finding from pattern, delta-T, operating condition, and consequence.
When Handheld Scans Stop Being Enough
Handheld thermography remains flexible and practical for route work. It can cover many panels during an outage window or production walk, and it allows a thermographer to investigate an unexpected temperature difference immediately. Its limitation is temporal. A route sees the asset only when the inspection occurs.
Periodic inspection creates blind spots between scans. Technician interpretation can vary, load may be unusually light during the route, and a defect that develops after the inspection won't appear in the report until the next visit. A 2026 review of thermographic imaging identifies these limitations and recommends combining periodic scanning with targeted continuous monitoring for the highest-risk equipment in this industry commentary on thermographic imaging.

Use risk to choose the inspection format
A fixed monitoring system is justified when the consequence of missing a developing fault exceeds the cost and complexity of continuous data collection. Three decision questions usually expose the need:
- Process criticality: Does the asset feed a single production line, utility, safety function, or continuous process with no practical standby?
- Failure history: Has the switchgear, MCC, transformer, or cable system produced repeated thermal anomalies or recurring connection defects?
- Failure speed: Can intermittent loading, harmonic heating, water ingress, or contact degradation progress between scheduled routes?
Fixed sensors or infrared monitoring points can be installed around critical switchgear bus compartments, transformer low-voltage sections, and major cable routes. They capture conditions under real operating load and can trend temperature changes between handheld inspections. The system still needs alarm governance, sensor validation, data ownership, and a response procedure. Continuous measurement without a defined work process only creates more notifications.
A 2026 academic review of autonomous power inspection points toward end-to-end inspection systems, standardized quality assurance, and stronger workflows. That reinforces the central decision: camera capability isn't the only constraint. Program design, asset criticality, data quality, and response speed determine whether monitoring reduces risk.
Route-based thermography is appropriate for many assets. Fixed monitoring becomes more compelling for a single-point-of-failure MCC, a repeatedly problematic breaker lineup, or equipment whose thermal failure mode can emerge between inspections. A reliability assessment should identify which assets need continuous monitoring and which can remain on an annual or risk-based infrared route.
Reporting Findings and Closing the Loop
A defensible report lets another engineer understand the finding without standing beside the camera. The document should identify the asset, operating condition, measurement method, reference component, severity, and required action. A colorful thermogram without those details is an image archive, not a maintenance decision.
Record the conditions that make the image credible
Each finding should include:
- Asset identity: Site, area, equipment number, panel or bucket, feeder, phase, and component.
- Operating load: Amperage or documented load condition at the time of the scan.
- Measurement inputs: Emissivity, reflected temperature, ambient temperature, humidity, distance, and viewing geometry where relevant.
- Comparison basis: Similar component, adjacent phase, prior inspection, or ambient reference.
- Thermal evidence: Thermogram, visible image, spot or box readings, and the measured delta-T.
- Severity and action: Priority rating, immediate controls, repair scope, and responsible owner.
A useful finding might read: “MCC-2 bucket 14, line-side contactor lug, phase B. Load recorded during scan. Localized temperature outlier relative to adjacent phases under similar operating conditions. Inspect torque, contact surface, oxidation, and conductor termination at the next safe opportunity. Rescan after repair.”
| Report Field | Example Value | Purpose |
|---|---|---|
| Asset ID | MCC-2 bucket 14 | Links image to the physical asset |
| Load condition | Recorded operating current | Establishes whether the thermal condition is representative |
| Emissivity | Surface-specific setting | Supports measurement credibility |
| Reference | Adjacent phase under similar load | Defines the comparison basis |
| Delta-T | Suspect lug versus reference | Supports severity classification |
| Failure code | Loose or oxidized connection | Guides corrective work |
| Recommended action | Inspect, clean, torque, and verify | Converts detection into maintenance |
| Verification image | Post-repair thermogram | Closes the evidence loop |
Convert findings into controlled work
The CMMS work order should preserve the thermography record rather than forcing planners to retype it from a PDF. Failure codes can distinguish loose connection, oxidation, overload, unbalanced load, cooling failure, or suspected component degradation. Root-cause coding helps the reliability team identify whether repeated findings originate in installation quality, environmental contamination, vibration, thermal cycling, or maintenance practice.
Priority should follow severity and consequence, not the inspection calendar. A high-temperature connection on a critical feeder may require immediate coordination with operations, while a stable low-level deviation on a noncritical circuit may fit a planned outage. The report should state what the technician must verify, which parts may be required, and whether the circuit needs load reduction until repair.
After the repair, the electrician or thermographer should repeat the scan under comparable conditions. The new image should be attached to the original work order, with before-and-after delta-T values and notes on torque, cleaning, replacement, or other corrective work. If the thermal difference remains, the team should reopen the diagnosis rather than closing the task because a connection was touched.
A closed-loop program also reviews recurring findings. If follow-up inspections continue to identify connection-related anomalies, management should examine workmanship standards, torque-tool control, contact preparation, enclosure sealing, and inspection frequency. Forge Reliability provides condition monitoring and reliability consulting that can help plants determine where route-based thermography, fixed monitoring, and CMMS governance fit within a broader predictive-maintenance program.
Forge Reliability can assess a plant's electrical thermography program, including asset criticality, load conditions, measurement quality, severity criteria, reporting, and the choice between handheld routes and continuous monitoring. Visit Forge Reliability to request a free reliability assessment and identify the electrical assets most likely to benefit from a more defensible inspection strategy.