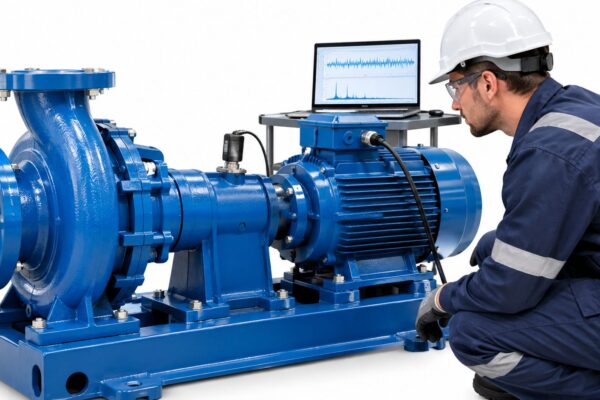
A vibration alarm appears on a compressor during the busiest production window. The dashboard marks the condition as abnormal, but no planner sees a justified task, no technician has a defined inspection scope, and the CMMS contains no work order. The compressor runs until the bearing damages the shaft, production stops, and the plant discovers that detecting degradation was never the same as managing it.
That gap defines how to implement predictive maintenance successfully. Predictive maintenance, or PdM, uses condition data and analysis to identify developing faults before failure. The difficult part isn't buying sensors or displaying trends. It's deciding which assets deserve monitoring, defining what an alert means, assigning ownership, and ensuring every credible signal becomes a planned intervention.
Table of Contents
- Aligning Predictive Maintenance with Business Goals
- Prioritizing Assets through Criticality Ranking
- Crafting Sensor and Data Collection Strategy
- Integrating Analytics with CMMS Workflows
- Executing Pilots and Planning for Scale
- Addressing Common Pitfalls and Industry Variations
- Conclusion and Next Steps
Aligning Predictive Maintenance with Business Goals
A production line stops during a high-demand order. The maintenance team replaces a failed motor, production loses its schedule, and finance records the event as an emergency repair. A PdM program can detect bearing wear, imbalance, lubrication problems, or misalignment earlier, but executives won't fund it because “more vibration data” sounds like an instrumentation project. They need a business case tied to operational consequences.
Start with the failure that matters. For a bottling line, a conveyor drive may be more valuable than dozens of low-cost auxiliary motors because its failure interrupts the entire process. The reliability engineer should document the failure mode, the operational consequence, the current response, and the decision that earlier warning would enable.
A concise executive summary should answer four questions:
- What fails: Identify the asset, component, and credible failure mode.
- What failure costs: Use the plant's actual downtime cost per hour, labor requirements, spare-parts exposure, quality risk, and safety implications.
- What action becomes possible: Explain whether the signal supports lubrication, alignment, bearing replacement, or a scheduled inspection.
- How success will be measured: Connect the project to unplanned downtime, maintenance cost avoidance, OEE, schedule compliance, or emergency work.
Reported business cases commonly justify PdM with 30–50% reductions in unplanned downtime, 18–25% lower maintenance costs, and payback within 12–18 months, although actual results depend on asset selection, data quality, workflow adoption, and intervention discipline. These figures should be presented as business-case benchmarks, not guarantees, and should be tested against plant-specific baselines using reported predictive maintenance ROI expectations for manufacturers.
Build the financial logic before selecting sensors
A useful proposal connects the predicted intervention to a financial planning process. Material handling operations can also benefit from a structured warehouse automation ROI calculator when PdM affects conveyors, sortation equipment, storage systems, or other automated assets. The same discipline applies in manufacturing: separate avoided downtime from avoided labor, reduced secondary damage, spare-parts optimization, and quality protection.
OEE, or overall equipment effectiveness, combines availability, performance, and quality. A PdM initiative should show which part of OEE it is expected to influence, rather than claiming that every sensor will improve the entire metric. Teams seeking a practical framework for connecting maintenance work to production performance can also review OEE improvement guidance.
Practical rule: A sensor earns budget only when the plant can name the maintenance decision it will change.
Prioritizing Assets through Criticality Ranking
A plant rarely has enough budget, analysts, or technician time to instrument every pump, motor, gearbox, and compressor. Criticality ranking prevents a broad rollout from consuming resources on assets where failure has little consequence or where degradation can't be detected with confidence.
The ranking should combine consequence and detectability. A motor that drives the only cooling-water pump may be highly critical even if its failure likelihood is moderate. A small exhaust fan may fail frequently but remain a reasonable run-to-failure candidate if its replacement is quick, safe, and inexpensive.
Score the asset, not the equipment category
Create an asset register with a clear equipment hierarchy. Record the parent system, driven equipment, operating duty, installed spare status, failure history, and current maintenance strategy. Then evaluate:
- Production consequence: How much process capacity disappears when the asset stops?
- Downtime exposure: What is the plant's verified cost per hour for that failure?
- Safety and environmental consequence: Could failure create a hazardous release, pressure event, fire risk, or product contamination?
- Failure likelihood: Does the asset show recurring bearing, seal, lubrication, electrical, or alignment problems?
- Detectability: Does the failure mode produce measurable vibration, temperature, oil, ultrasound, or electrical changes before functional failure?
- Intervention value: Can the team act during a planned window with available parts and skills?
A sample ranking can be used to establish the method. The values below are illustrative decision inputs, not plant performance claims.
| Asset | Downtime Cost ($/hr) | Likelihood of Failure | Criticality Score |
|---|---|---|---|
| Process cooling pump | 1,200 | High | 9 |
| Main production conveyor gearbox | 900 | Medium | 8 |
| Utility air compressor | 650 | Medium | 7 |
| Packaging-line motor | 400 | High | 7 |
| Warehouse exhaust fan | 100 | Medium | 3 |
The table isn't useful because of the labels alone. The reliability team should record why an asset received each score and retain the evidence in the asset strategy. A high score with poor detectability may justify preventive maintenance, redesign, redundancy, or a root cause investigation instead of PdM.
Use failure modes to choose the maintenance strategy
A pump with recurring bearing fluting and misalignment may justify continuous vibration monitoring. A food-processing gearbox with predictable lubricant degradation may need periodic oil analysis and temperature checks. A noncritical fan with accessible bearings may remain on a route inspection or corrective strategy.
A formal FMEA for manufacturing helps connect equipment functions to failure modes, effects, causes, controls, and recommended tasks. The result should be a ranked PdM backlog, not a shopping list.
Start with assets where failure is expensive, degradation is observable, and maintenance can act on the warning.
Crafting Sensor and Data Collection Strategy
Sensor selection should follow the failure mode. A vibration sensor installed on every motor won't detect every important problem, and continuous monitoring isn't automatically better than a well-designed inspection route. The practical choice depends on failure speed, consequence, access, operating variability, and the time available to plan an intervention.
Match the technology to the fault
| Failure mode | Useful diagnostic technique | Example application |
|---|---|---|
| Bearing wear or looseness | Vibration spectrum and time waveform | Motor-driven pump bearings |
| Lubricant degradation or contamination | Oil sampling and laboratory analysis | Compressor gearbox |
| Thermal hotspot or poor electrical connection | Infrared thermography | Motor terminal box or switchgear |
| Air or steam leakage | Ultrasound | Compressed-air distribution |
| Rotor imbalance or misalignment | Vibration analysis with phase and operating context | Pump and motor train |
| Electrical asymmetry or rotor-bar concern | Motor current signature analysis | Induction motor under stable load |
Vibration analysis measures mechanical movement and often identifies imbalance, misalignment, looseness, resonance, and bearing damage through frequency patterns. The analyst needs reliable measurement locations, consistent machine operating states, and enough context to distinguish a real fault from a load change.
Oil analysis can reveal viscosity change, wear metals, water, particles, and chemical degradation. It works best when sampling points are clean, repeatable, and tied to the correct component. A contaminated sample can create a false maintenance response just as easily as a bad sensor can.
Thermography is valuable for thermal differences, overloaded connections, blocked cooling paths, and insulation-related concerns. It requires a stable load and a safe inspection procedure. Ultrasound suits compressed-air leaks, steam traps, and early bearing friction, especially where route-based inspection is practical. Motor current signature analysis can complement vibration data when electrical and mechanical fault symptoms overlap.
Choose route-based or continuous monitoring deliberately
Route-based monitoring usually costs less and works well for stable assets with gradual degradation, accessible measurement points, and sufficient warning time. Continuous monitoring makes more sense for assets with rapid failure progression, difficult access, severe consequences, or highly variable operating conditions. A compressor in a hazardous area may justify fixed sensors because manual access is constrained. A redundant utility pump may not.
Sampling frequency should reflect the physics of the fault. Slow lubricant degradation doesn't require the same data cadence as a rapidly changing bearing fault. The program should define how raw data is stored, how features are retained, and how long maintenance history remains available for validation.
Edge processing analyzes data near the equipment, reducing dependence on network availability and supporting fast local alarms. Cloud processing supports broader fleet analysis and centralized governance. Many plants need both, but integration must account for cybersecurity, bandwidth, data ownership, and the skills available to maintain the system.
Industry sources report 70–75% fewer equipment breakdowns and 35–45% lower downtime when condition-based monitoring is implemented, particularly for rotating assets such as motors, gearboxes, and pumps. Those reported outcomes support careful targeting, not indiscriminate instrumentation, as described in industry reporting on condition-based monitoring results. A plant can define the required architecture through a documented condition monitoring system that links each measurement to a failure mode and response.
Integrating Analytics with CMMS Workflows
A predictive alert has no operational value until someone can interpret it, approve an action, plan the work, and close the loop. Industry analysis identifies the most common barrier as converting anomaly signals into work orders, planning maintenance, and completing interventions in the CMMS, rather than collecting data itself. That makes integration the center of the program, not an IT task at the end, as documented in recent maintenance workflow analysis.
Define the alert-to-action path
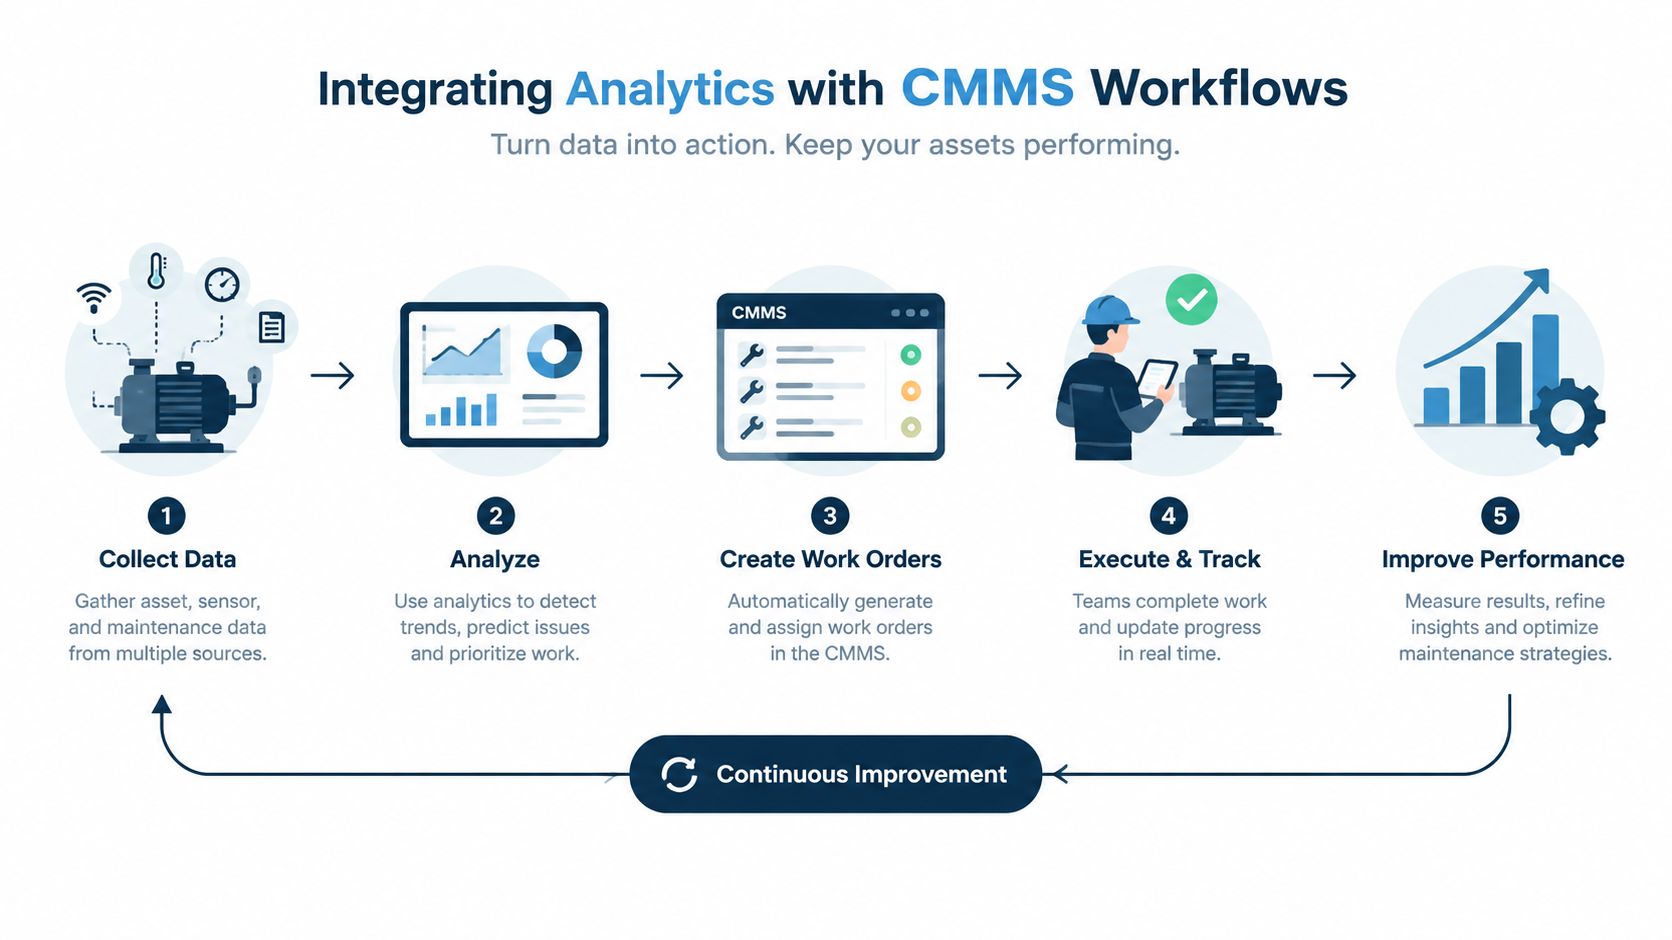
The workflow should be designed before the model is deployed:
- Detect: The analytics layer identifies a deviation from the asset's validated operating baseline.
- Classify: The reliability engineer reviews the signal against operating state, recent work, and known failure modes.
- Decide: A named role determines whether the condition requires observation, inspection, corrective work, or immediate escalation.
- Create: The system or planner creates a CMMS work request with asset identity, fault evidence, recommended scope, priority, and required craft.
- Plan: The maintenance planner checks parts, permits, labor, isolation requirements, and production availability.
- Execute and close: The technician records findings, measurements, repair details, and post-work condition.
- Learn: The reliability team compares the prediction with the actual finding and updates the rule, model, or failure-mode library.
A vibration threshold shouldn't create an automatic bearing replacement. It should create a defined inspection or diagnostic task unless the evidence and consequence justify escalation. Dynamic thresholds can account for speed, load, process state, temperature, and machine operating mode. Static limits often generate nuisance alerts when the equipment legitimately changes condition.
Prevent alert fatigue
Alert fatigue develops when technicians receive more notifications than they can investigate. Each alert should have an owner, a priority rule, an expiry condition, and a response time appropriate to the failure progression. The dashboard should distinguish a new anomaly from an acknowledged condition, a confirmed fault, and a completed intervention.
Model drift means that model performance changes as equipment, process conditions, sensors, or maintenance practices change. The governance process should review false alarms, missed faults, confirmed findings, and changes in operating regime. Teams responsible for deploying and maintaining analytical workflows can use Machine Learning Operations guidance to structure model ownership, version control, monitoring, and release decisions.
CMMS integration also depends on clean asset IDs, consistent failure codes, usable task lists, and planner adoption. A practical CMMS asset management framework helps establish the data foundation required for traceable work execution.
Executing Pilots and Planning for Scale
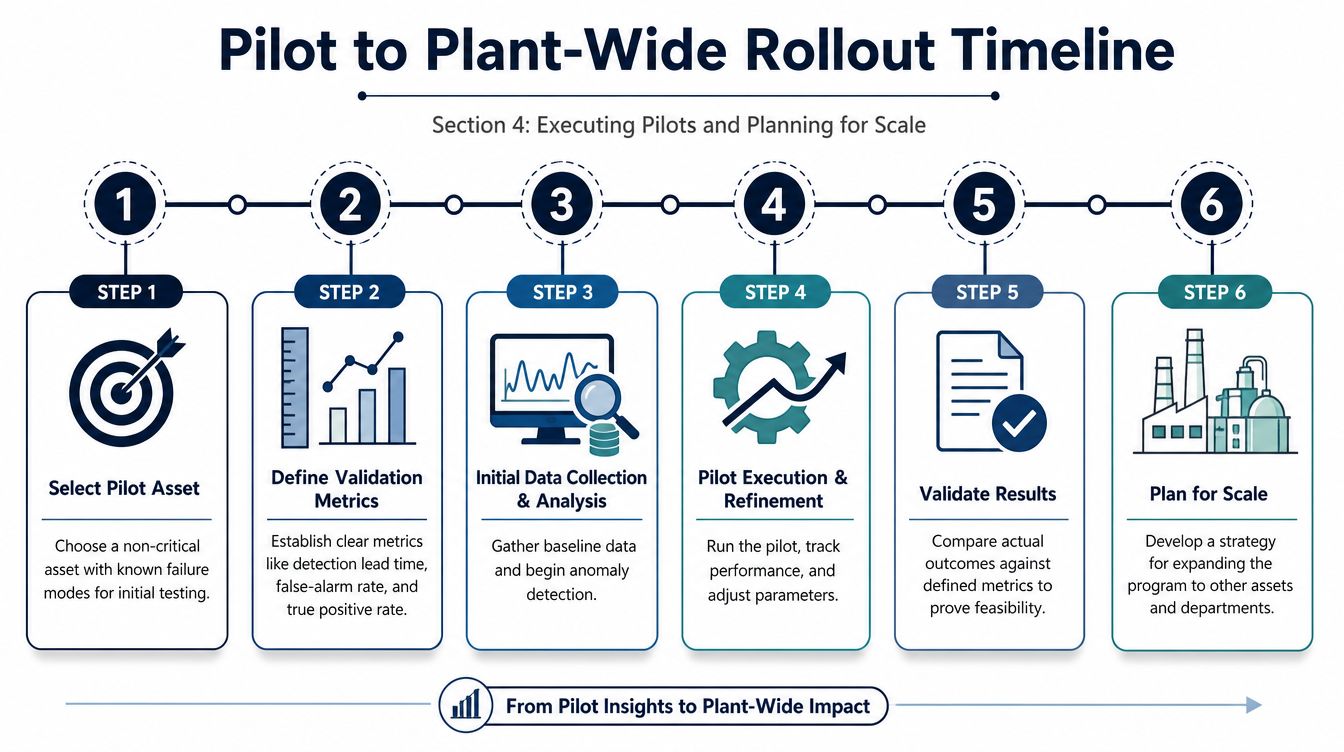
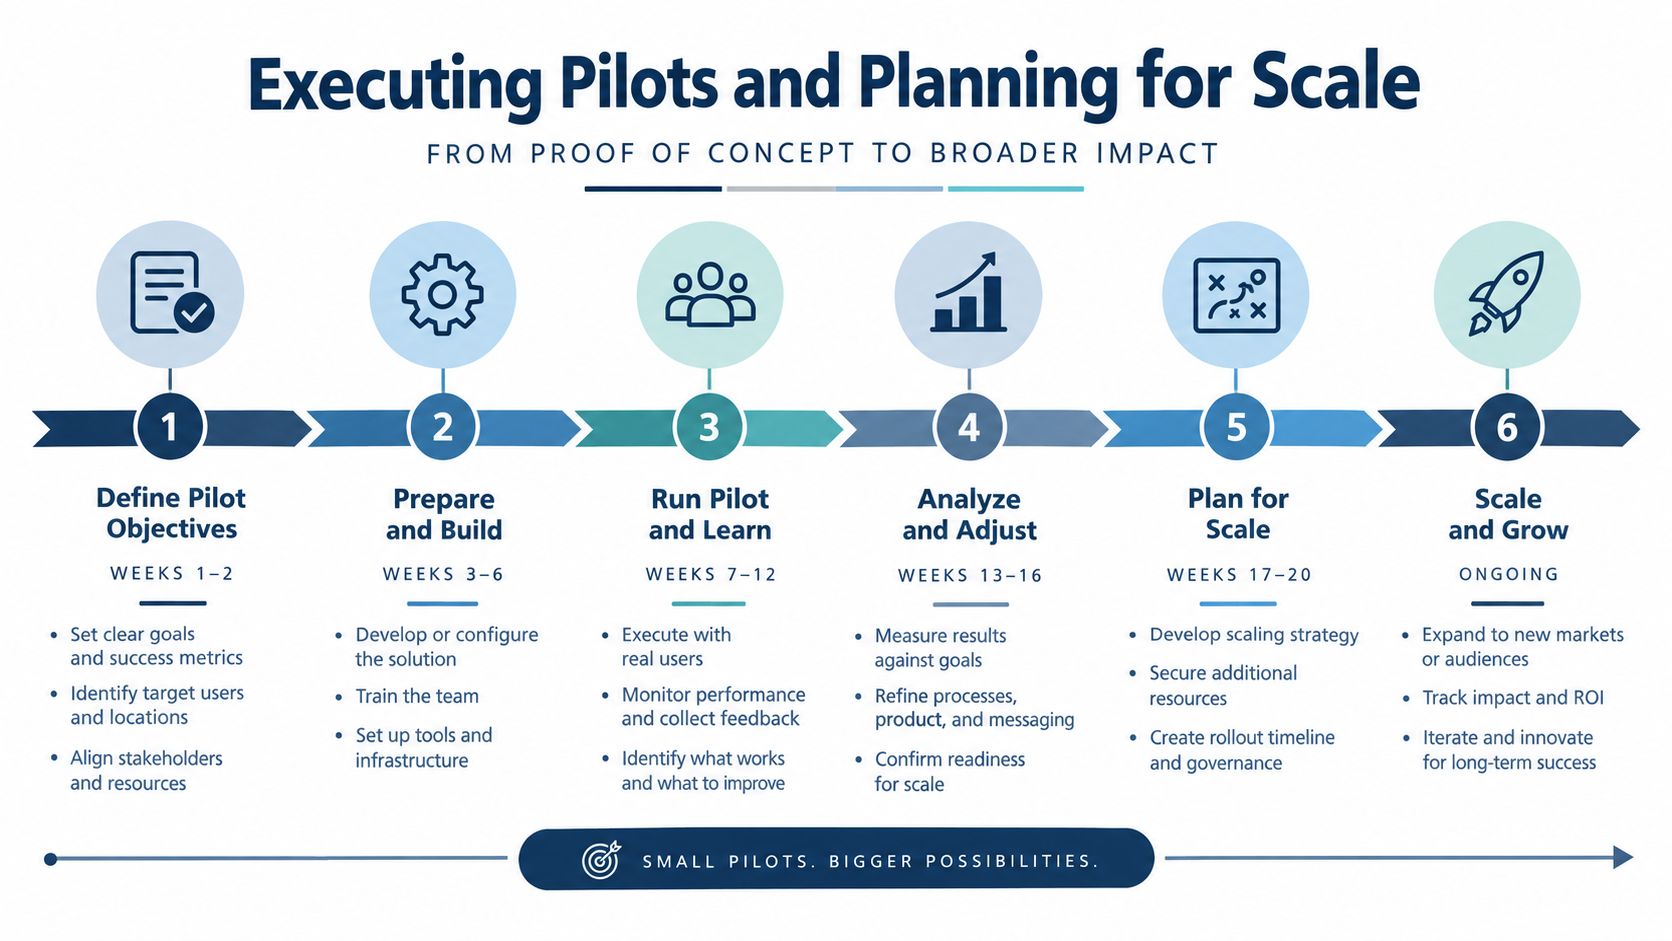
A pilot should prove more than whether a sensor can transmit data. It should test whether the plant can detect a meaningful condition, diagnose it, create a work order, complete the intervention, and verify the result. Selecting a noncritical asset with known failure modes limits operational risk while giving the team a realistic workflow to exercise.
A suitable pilot might involve a cooling-water pump with a documented history of bearing wear, coupling misalignment, or seal degradation. The team should establish the normal operating envelope, install or validate the measurement method, and document the baseline condition before setting alert logic.
Set validation metrics before launch
Useful pilot measures include:
- Detection lead time: How much planning opportunity exists between a credible alert and functional failure?
- False-alarm rate: How often does the system generate a signal that investigation cannot support?
- True positive rate: How often does a validated alert correspond to a real developing condition?
- Intervention success: Did the planned action address the confirmed failure mode?
- Workflow completion: Did the alert produce a closed work order with usable findings?
- Planner and technician acceptance: Can the team interpret and execute the recommended response?
The pilot should run long enough to expose normal operating variation and provide opportunities to test the complete handoff. It shouldn't be judged only by the number of alarms. A quiet pilot may indicate healthy equipment, weak sensitivity, poor data, or inadequate failure-mode coverage.
Calculate the economics using plant evidence
The practical formula is:
ROI = (Annual Savings − Implementation Cost) ÷ Implementation Cost × 100
Downtime savings come from baseline unplanned downtime hours multiplied by the verified cost per hour and the fractional reduction achieved. The model can also include avoided secondary damage, emergency labor, expedited parts, and quality losses, but each input should be traceable to plant records. The calculation method is outlined in this predictive maintenance ROI model.
Scaling should follow criticality tiers. Expand only after the team has validated the sensing method, alert logic, ownership, CMMS process, training, and data governance. A staged 12-month reliability program roadmap can help coordinate technical deployment with planning, competency development, and management routines.
Addressing Common Pitfalls and Industry Variations
Most PdM programs don't stall because the algorithm is incapable of finding an anomaly. They stall because the plant can't trust the input, nobody owns the decision, or the maintenance process doesn't record what happened. The remedy is operational discipline before analytical sophistication.
Poor data quality appears differently across industries. A chemical-processing pump may show a temperature increase because process conditions changed, not because the bearing is failing. A food-and-beverage line may be washed down in a way that affects sensor reliability and access. A mining conveyor may operate under changing loads that make a single baseline misleading.
The response should be specific:
- Assign data ownership: A cross-functional council should define who owns sensor calibration, asset identity, operating context, and maintenance records.
- Validate the model: Quarterly reviews should compare alerts with technician findings, rejected notifications, missed conditions, and process changes.
- Tailor alert visibility: Operators need clear equipment-state information, planners need scope and timing, and reliability engineers need diagnostic evidence. Every role doesn't need the same alert volume.
- Respect legacy integration limits: Where a legacy CMMS or SCADA system can't support direct automation, use a controlled interim workflow with documented fields and ownership rather than bypassing maintenance planning.
- Address workforce concerns: Technicians should help define the response task and should receive feedback when their inspections confirm or reject a prediction.
In chemical processing, safety and containment can outweigh a simple downtime calculation. In food production, sanitation windows and contamination controls shape the intervention plan. In mining, access, environmental conditions, and long travel distances influence whether continuous monitoring is worth the infrastructure. The same PdM architecture can't be copied unchanged across all three settings.
Conclusion and Next Steps
Successful predictive maintenance begins with a business problem, not a sensor catalog. The plant identifies consequential failure modes, ranks assets by criticality, selects monitoring methods that can detect degradation, and defines the response before the first alert is generated.
The decisive handoff occurs between analytics and execution. A credible anomaly must reach a named decision-maker, become a properly scoped work order, receive planning support, and produce a recorded finding that can validate or challenge the model. Without that loop, PdM becomes another dashboard competing for attention.
Scaling should remain conditional. The team should expand only when the pilot demonstrates usable detection, manageable alert volume, practical technician response, CMMS traceability, and an economic case grounded in plant records. Continuous validation then keeps the program aligned with changing equipment, processes, and workforce capability.
Forge Reliability provides a no-cost reliability assessment to identify where signal-to-work-order handoffs are failing and which assets offer the clearest opportunity for predictive maintenance. The assessment can help maintenance and operations leaders build a focused roadmap around criticality, condition monitoring, workflow integration, and measurable value.
Schedule a free reliability assessment with Forge Reliability to review critical assets, failure modes, sensor coverage, and CMMS handoffs. The reliability team will help identify where a prediction can become a planned maintenance action before the next avoidable failure.