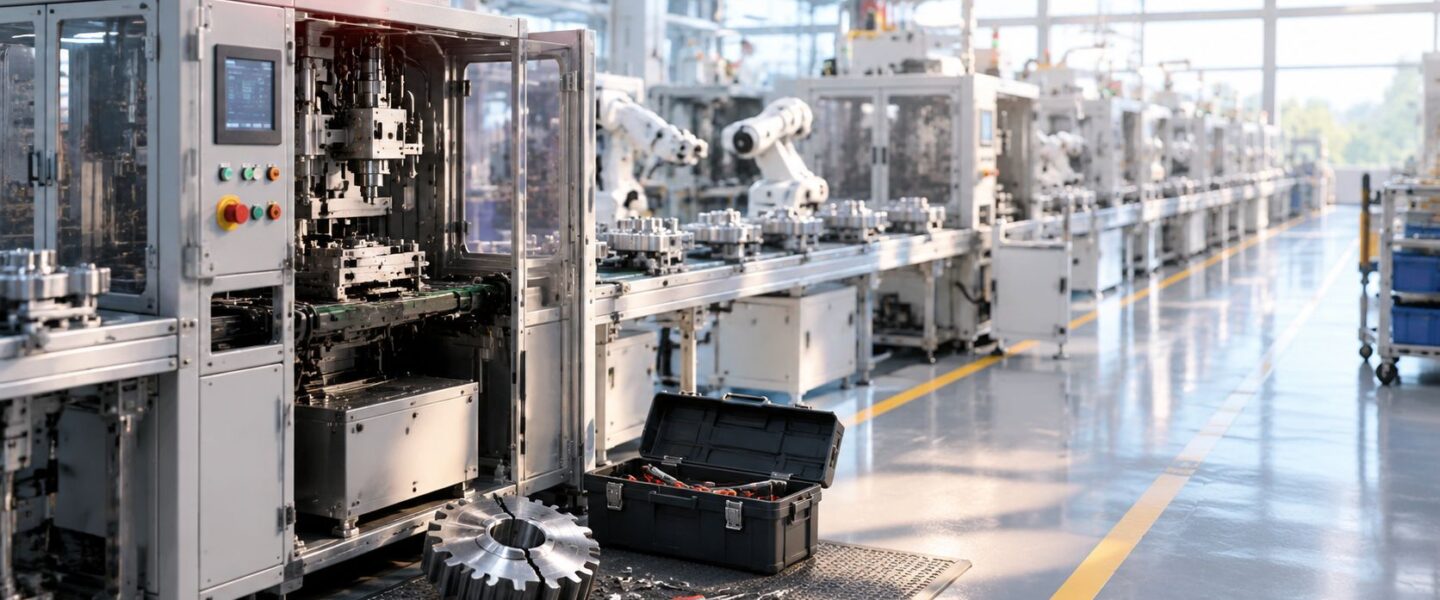
At 2 a.m., a bottleneck filler trips during a high-volume production run. Operators stop the upstream process, maintenance technicians search for the right seal, quality personnel isolate material in process, and the shipping team starts recalculating delivery commitments. The repair may take less time than the recovery, because the plant still has to clear scrap, stabilize the line, rebuild the schedule, and decide whether overtime or expedited logistics can protect the customer promise.
That scene captures the problem with unplanned downtime in manufacturing. A stopped machine is only the visible event. The larger loss often comes from repeated temporary repairs, undocumented adjustments, unstable restarts, and bottleneck assets whose failure affects every connected process.
Core takeaway: Downtime cost isn't limited to the technician's repair time. It includes the production, quality, labor, logistics, and schedule consequences that follow the stop.
This guide builds the subject from the plant-floor definition through cost analysis, recurring-failure diagnosis, condition monitoring, and a practical prevention workflow. It also shows why a machine can appear reliable in the CMMS while operators continue performing hidden rework around the same defect. Plant leaders who want an outside review can use Forge Reliability's reliability challenges in manufacturing equipment resource as a starting point, then request a free reliability assessment to identify the assets creating the greatest exposure.
Table of Contents
- What Unplanned Downtime Really Means on the Plant Floor
- The True Cost and Business Impact of Unplanned Downtime
- Why Unplanned Downtime Keeps Happening
- How to Detect and Monitor Failures Before They Stop Production
- Proven Strategies to Prevent Unplanned Downtime
- Your Action Plan to Measure Progress and Eliminate Downtime
What Unplanned Downtime Really Means on the Plant Floor
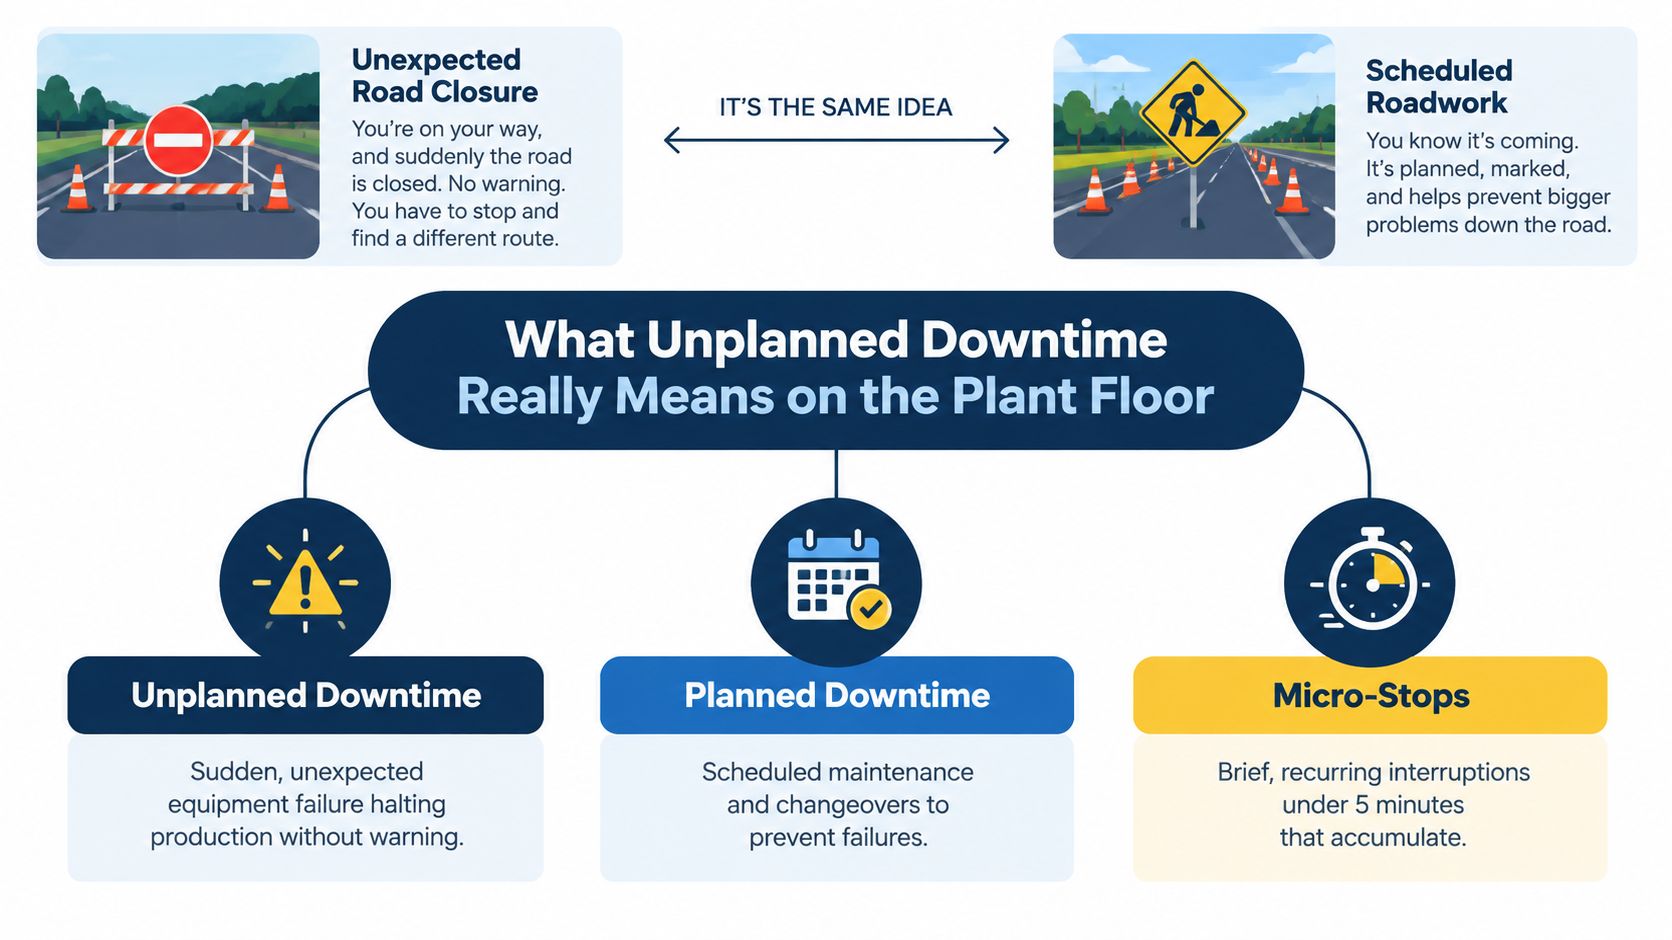
Planned downtime resembles scheduled roadwork. Production stops at an agreed time, the work scope is known, parts and people are prepared, and operations can protect the schedule. Unplanned downtime is an unexpected road closure. Traffic backs up immediately, drivers search for another route, and the disruption spreads beyond the original obstruction.
A planned changeover, inspection, or overhaul is therefore not the same as an unexpected stop. A micro-stop is different again. It may be a brief interruption caused by a sensor fault, jammed product, failed handshake between controls, or operator reset. Each event can look insignificant in isolation, but recurring micro-stops can consume capacity and conceal a developing failure.
The terms that shape the decision
A functional failure occurs when an asset can no longer perform a required function at the required operating condition. A pump that still turns but can't maintain the flow needed by a process has functionally failed, even if its motor remains energized.
Mean time between failures, or MTBF, describes the average operating time between failures. Mean time to repair, or MTTR, describes the average time required to restore function. Availability reflects whether the asset is ready to operate, and it depends heavily on both failure frequency and restoration time. A high MTBF can still mislead if technicians close work orders inconsistently or classify repeat repairs as unrelated events.
Consider a food and beverage line supplied by a process-water pump. A mechanical seal begins leaking, the pump loses pressure, and the filler trips on a low-flow interlock. The immediate failure is the seal, but the production consequence includes the stopped filler, material held for inspection, operators waiting for direction, sanitation or restart checks, and a shipping plan that no longer matches the original sequence.
Why asset position matters
A small pump in a redundant utility system may have limited production consequence. The same pump feeding a single bottleneck filler can stop the entire value stream. Utilities, shared compressors, critical chillers, and bottleneck CNC cells deserve consequence-based treatment because their position in the process amplifies the effect of failure.
Maintenance teams should record the first functional effect, not only the component replaced. “Seal changed” describes the repair. “Loss of process-water pressure stopped the filler” describes the business-relevant failure.
The True Cost and Business Impact of Unplanned Downtime
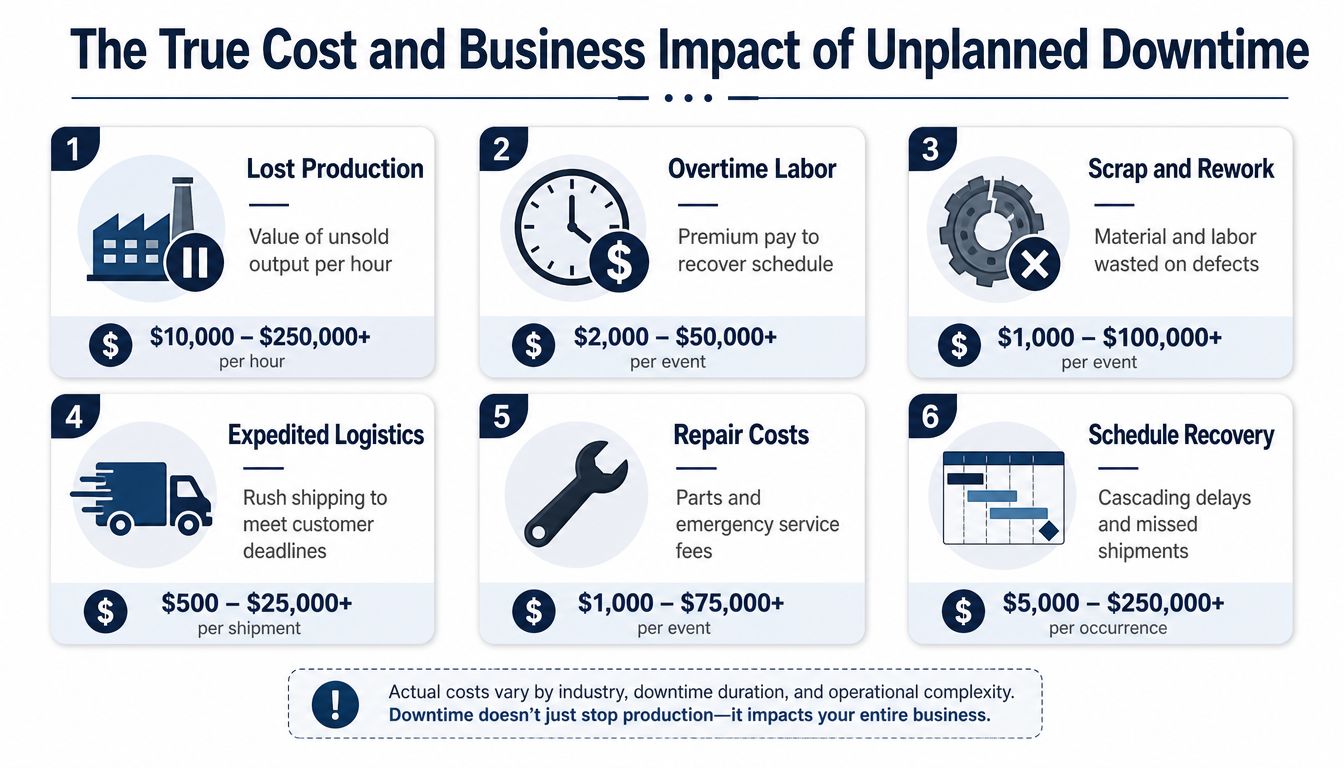
A stopped machine creates a visible repair invoice, but the invoice is only the first layer of the loss. During the outage, the plant also loses saleable output, uses overtime to recover the schedule, generates scrap or rework, expedites materials, and postpones planned maintenance while technicians handle the emergency. The same bottleneck asset can therefore create a much larger business event than its repair history suggests.
Industry analyses such as the linked cost study place typical downtime costs at about $260,000 per hour. Other analyses show that large plants can lose roughly $253 million per year. These estimates combine lost production, overtime, scrap and rework, logistics recovery, restart time, and schedule disruption, rather than counting only the output that stopped. Use our guide to reliability metrics such as MTBF, MTTR, and OEE to separate equipment performance from the broader business consequence.
Six costs that belong in the same conversation
- Lost production: The plant loses the contribution from units that could not be made while the asset was unavailable.
- Overtime labor: Supervisors may extend shifts or add recovery work to restore the schedule.
- Scrap and rework: A failed temperature-control loop, pump, or drive can push material outside specification before the unstable process is recognized.
- Expedited logistics: Missed production windows can require rush transport or emergency material movement.
- Repair costs: Emergency parts, specialist labor, and difficult access increase the direct maintenance bill.
- Schedule recovery: A bottleneck stop can delay several orders after the original asset returns to service.
Ranking assets by consequence
Failure frequency alone does not set investment priority. A frequently failing noncritical conveyor may create repeated nuisance work, while one infrequent failure of a single process compressor can stop production, expose product, and extend recovery.
Rank each critical asset across four dimensions:
- Production consequence, including bottleneck position and lost throughput.
- Quality consequence, including material exposed during an unstable process.
- Safety and environmental consequence, especially in chemical, oil and gas, and power operations.
- Recovery consequence, including access, specialist availability, parts, warm-up, and validation requirements.
For the largest companies globally, unplanned downtime is estimated at $1.4 trillion annually, equal to 11% of revenues. The Siemens report also gives an average cost of about $129 million per facility among Fortune Global 500 companies. The Siemens True Cost of Downtime report provides that broader business context. Reliability funding should follow consequence, not the number of work orders. That ranking also exposes which assets deserve documented repairs, targeted monitoring, and follow-up verification after the line restarts.
Why Unplanned Downtime Keeps Happening
Repeated downtime usually means the plant restored operation without removing the mechanism that caused the failure. A bearing may be replaced while misalignment remains. A gearbox may receive new teeth while lubrication contamination continues. A drive may be reset while electrical heat, loose terminations, or an overloaded motor keeps the initiating condition in place.
Failure modes by equipment class
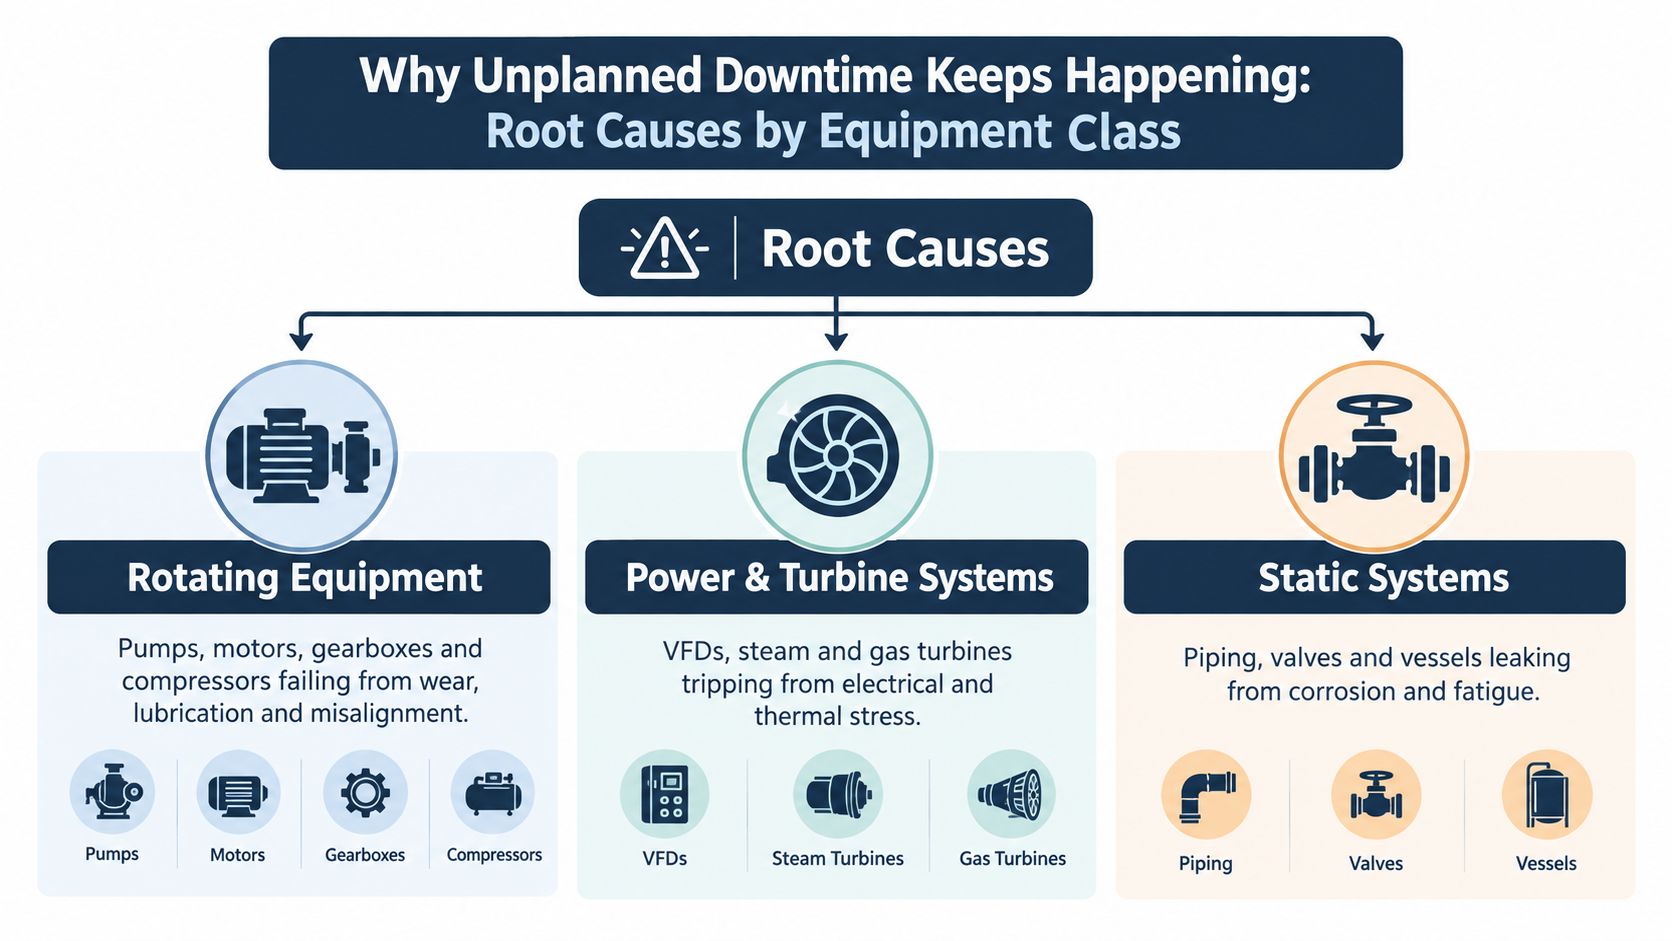
Rotating equipment often fails through bearing fatigue, inadequate or contaminated lubrication, shaft misalignment, imbalance, looseness, seal degradation, or coupling problems. Pumps add process-specific risks such as cavitation, which occurs when inadequate suction conditions create vapor bubbles that damage internal surfaces. Compressors can suffer from fouling, valve problems, poor lubrication, or abnormal loading. Gearboxes may develop tooth wear, pitting, backlash, or housing distortion.
Power and turbine systems bring another set of mechanisms. Variable-frequency drives, or VFDs, can trip because of thermal stress, cooling problems, electrical imbalance, or insulation degradation. Steam and gas turbines require attention to vibration, lubrication, thermal growth, and control-system behavior. Static systems, including piping, valves, and vessels, can leak through corrosion, fatigue cracking, gasket failure, erosion, or incorrect assembly.
The hidden factory behind the repair
A hidden factory is the work performed outside the formal production and maintenance process to keep equipment operating. Operators tighten a guard, adjust a sensor, shim a mount, bypass an alarm, or repeat a reset because the official work order doesn't capture the full condition. A temporary fix becomes normal practice, and the plant later treats the next recurrence as a new failure.
A 2025 survey of more than 600 manufacturing leaders across 46 U.S. states found that 72% said undocumented fixes and hidden factories contribute to recurring downtime, while 52% said downtime prevents production or shipping targets from being met. Those findings are reported in the discussion of hidden factory work and recurring downtime.
Poor CMMS data governance makes this worse. If technicians close a work order as “mechanical repair” without recording the failure mode, operating condition, evidence, and corrective action, the asset's MTBF can look healthier than reality. A Pareto analysis, which ranks failures from greatest to least contribution, should expose the few repeat modes creating the longest stops.
In a steel mill, recurring gearbox failures on a conveyor may appear to be separate bearing, coupling, and gear repairs. A deeper review may show that operators keep the conveyor running with an improvised alignment correction, while the permanent foundation or loading problem remains untouched. The repair cycle ends only when the plant documents the mechanism, standardizes the repair, verifies alignment and loading, and closes the root cause with evidence. A structured root cause failure analysis approach helps establish that discipline.
How to Detect and Monitor Failures Before They Stop Production
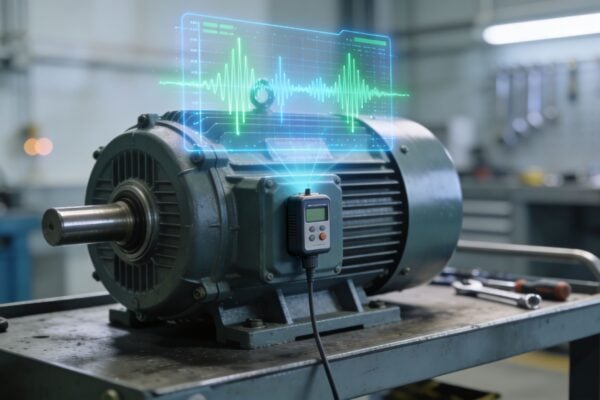
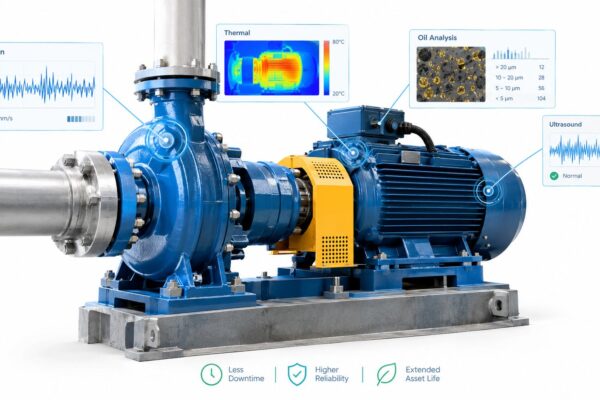
The right monitoring technique depends on the failure mode and how quickly the defect progresses. Vibration analysis is well suited to rolling-element bearing defects, imbalance, looseness, and misalignment. Oil analysis can reveal wear debris, viscosity change, contamination, and chemical degradation inside lubricated gearboxes or hydraulic systems.
Thermography identifies abnormal heat at electrical connections, motor terminals, bearings, and process equipment surfaces. Ultrasound is useful for compressed-air leaks, steam-trap problems, electrical arcing, and early bearing friction. Motor current signature analysis examines electrical current patterns to identify motor and driven-equipment abnormalities without relying only on mechanical measurements.
Condition monitoring technique selection matrix
| Technique | Best For | Lead Time | Monitoring Format |
|---|---|---|---|
| Vibration analysis | Bearings, imbalance, misalignment, looseness, gear defects | Useful when mechanical degradation produces a detectable signature before functional failure | Route-based or continuous |
| Oil analysis | Wear debris, contamination, lubricant condition, gearbox and hydraulic health | Depends on sampling quality and defect progression | Periodic route-based |
| Thermography | Electrical hot spots, overloaded components, abnormal surface temperature | Useful when temperature rises before protection trips or failure | Route-based or continuous |
| Ultrasound | Compressed-air leaks, steam traps, arcing, friction, early lubrication issues | Often useful for localized defects and leak detection | Route-based |
| Motor current signature analysis | Motor electrical condition and driven-load abnormalities | Depends on the electrical signature and operating stability | Route-based or continuous |
Turning signals into work
Alarm thresholds shouldn't be copied blindly from a generic standard. The reliability team should establish a baseline under known normal operating conditions, trend the measurement, and define an action for each alarm level. A rising vibration trend on a bottleneck pump may trigger confirmation measurements, alignment checks, and a planned repair window. A compressed-air leak found by ultrasound may enter a repair backlog without requiring an immediate shutdown.
Continuous monitoring makes sense for assets whose failure progresses quickly, carries high consequence, or is difficult to inspect safely. Route-based monitoring can suit stable assets with slower degradation, provided technicians collect readings consistently and record process conditions.
Maintenance managers who need a practical starting point can review this guide for maintenance managers from E & I Sales. A plant-wide program should then connect condition data to work execution, using condition monitoring systems that support decisions rather than creating an unmanageable stream of alerts.
Proven Strategies to Prevent Unplanned Downtime
Prevention starts with focus. A plant doesn't need every asset monitored in the same way. It needs a defensible method for deciding which failures deserve elimination, which require condition monitoring, which can be handled through planned replacement, and which can be allowed to run to failure.
Build the reliability workflow
Begin with criticality ranking. Score assets by production, quality, safety, environmental, and recovery consequence. A chemical-processing compressor train may outrank several frequently repaired utility pumps because its failure can affect process stability, product disposition, and restart complexity.
Use FMEA to expose the mechanism. Failure Modes and Effects Analysis lists how an asset can fail, what causes each mode, how the failure appears, and what control can detect it. The team should connect each important mode to an inspection, sensor, operating limit, or engineered correction.
Apply RCM to choose the task. Reliability-Centered Maintenance, or RCM, tests whether a preventive interval, condition-based task, redesign, or run-to-failure policy fits the consequence and failure behavior. Calendar-based replacement isn't automatically protective. If bearing damage is driven by installation misalignment, replacing bearings more often won't correct the installation process.
Use Weibull analysis where life data supports it. Weibull analysis models time-to-failure behavior and can help distinguish early-life defects, random failures, and wear-out patterns. It prevents the team from assuming that every component benefits from a fixed replacement interval.
Close the loop in the CMMS
A work order isn't complete when the machine runs. It should record the failed part, observed mechanism, evidence, operating context, temporary measures, permanent correction, and verification result. Failure codes must be specific enough to support repeat-failure Pareto analysis, and planners should link parts traceability to the asset and failure mode.
Spare-parts optimization should reflect consequence and lead time, not the largest stockroom count. Lifecycle cost analysis should include energy, maintenance labor, lost production exposure, and replacement decisions. For recurring problems, Apollo analysis, 5-Why analysis, or fault tree analysis can help the team move from symptoms to contributing conditions.
A logistics fleet faces similar logic in a different environment, and the predictive maintenance resource for hauliers offers useful context for condition-based decisions outside fixed plants. Within manufacturing, a chemical compressor train might receive vibration and oil monitoring, a defined alarm response, an engineered lubrication standard, verified alignment, critical-spares review, and a work-order audit. Forge Reliability can support this type of program through predictive maintenance for manufacturing.
Practical rule: A temporary repair should create a permanent corrective-action record, not disappear when the line restarts.
Your Action Plan to Measure Progress and Eliminate Downtime
Progress becomes credible when the plant measures failure behavior consistently. MTBF should reflect actual functional failures, not every minor adjustment. MTTR should include the time required to diagnose, access, repair, test, and return the asset to stable production. Availability and OEE should be reviewed alongside repeat-failure rate, because a rising work-order count can hide a small number of recurring mechanisms.
The same method adapts to different industries. A food and beverage plant may prioritize pump seals, filler sensors, sanitation-related conditions, and restart quality. A pharmaceutical plant may give greater weight to validation, environmental control, and documented release. A power-generation facility may focus on turbine vibration, lubrication, electrical protection, and the recovery consequence of a forced outage.
A practical 30, 60, and 90 day sequence
- First 30 days: Rank assets by consequence, clean up failure codes, identify undocumented fixes, and select the dominant repeat-failure modes.
- By 60 days: Pilot condition monitoring on bottleneck rotating equipment, utilities, or other consequence-ranked assets. Define alarm actions, not just alarm values.
- By 90 days: Review results, standardize successful work instructions, improve spare-parts governance, and extend the process to additional assets and sites.
The verified business context is substantial. Unplanned downtime is estimated to cost the world's 500 largest companies about $1.4 trillion annually, equal to 11% of revenues, and Siemens reports approximately $129 million per facility among Fortune Global 500 companies, as documented earlier. Those figures make consequence ranking and recurring-failure elimination leadership decisions, not merely maintenance improvements.
Forge Reliability's published service information describes documented outcomes including 30%+ reductions in unplanned downtime and 3–5x ROI, but each plant should validate its own baseline, scope, and measurement method before using such outcomes as a business case. A free reliability assessment can identify the dominant downtime exposure and the evidence needed for a defensible improvement plan.
Forge Reliability provides predictive maintenance, condition monitoring, and reliability consulting for manufacturers and industrial facilities, including vibration analysis, oil analysis, thermography, ultrasound, FMEA, RCM, and root cause failure analysis. Visit Forge Reliability to request a free reliability assessment and connect the recurring failures, hidden rework, and bottleneck asset risks to a practical uptime plan.