
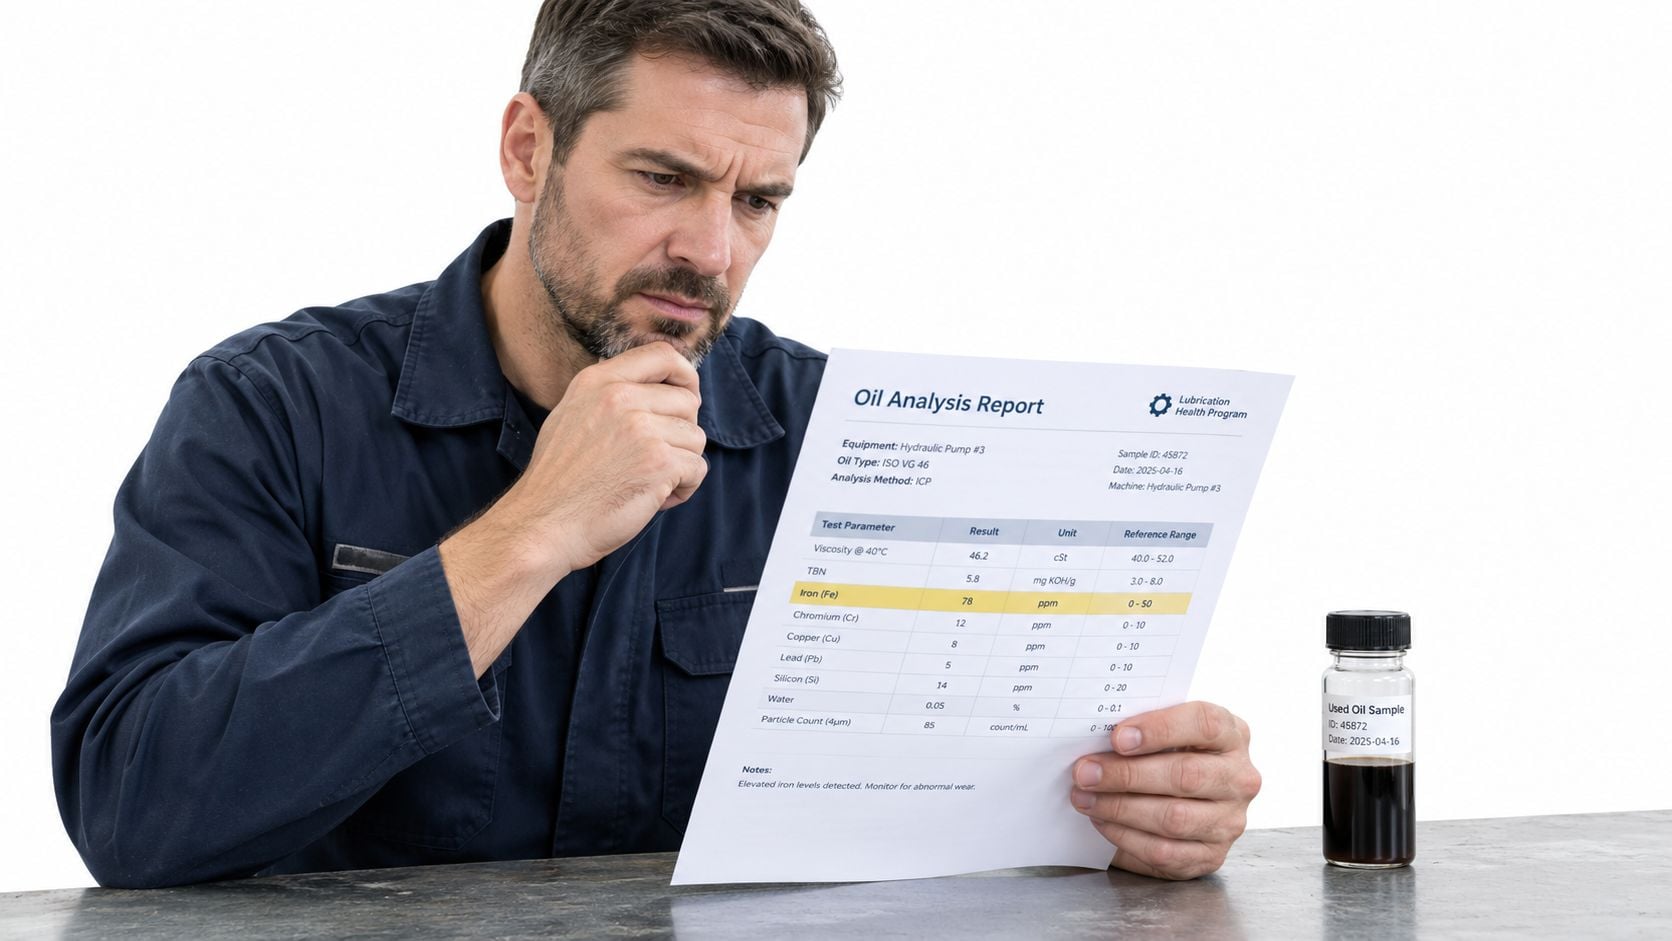
A hydraulic pump report lands in the maintenance manager's inbox with elevated iron and copper. The pump is critical, production is already constrained, and the lab has marked the result for attention. The immediate reaction is often to schedule a teardown. That reaction can be expensive, and it can still miss the true issue if dirt, water, a sampling mistake, or a recent repair caused the signal.
Oil analysis interpretation works best as a contamination-first decision process. Fluid condition, particle size, sampling quality, equipment metallurgy, operating duty, and historical trends all shape the meaning of a result. A single raised element isn't proof that a bearing or gear set is failing. It's evidence that deserves structured investigation.
Table of Contents
- Why Single-Sample Oil Reports Mislead Maintenance Teams
- Evaluating Fluid Health and Physical Degradation
- Decoding Particle Counts and ISO Cleanliness Codes
- Separating True Wear Metals from False Positives
- Building Statistical Baselines for Reliable Trending
- Translating Lab Data into Targeted Maintenance Action
Why Single-Sample Oil Reports Mislead Maintenance Teams
A maintenance manager sees high iron and copper on a hydraulic pump report after a difficult production run. The lab has flagged the sample, and the instinct is to plan a teardown. Start with contamination and sample validity instead. Dirt, water, mixed metallurgy, a sampling error, or recent maintenance can create a strong signal without proving that a bearing or gear set is failing.
Oil analysis interpretation should follow a decision tree rather than an isolated pass/fail threshold. First establish whether the sample represents the machine and its operating fluid. Then assess contamination, fluid condition, particle size, equipment metallurgy, operating duty, and historical behavior. A single result is evidence for investigation, not a diagnosis.
Iron is widespread in industrial equipment and does not identify one failure mode. Gear teeth, rolling elements, shafts, corrosion, ferrous dirt, and residue from an earlier event can all contribute iron. Copper may come from bearing overlay distress, a cooler, a bushing, brass or bronze components, or maintenance contamination. The element must be connected to the machine's construction and the rest of the report.
Practical rule: A high wear-metal result should trigger verification, not an automatic teardown.
The difference between background and active damage
Used-oil programs often apply equipment-specific alarm limits. Aviation used-oil evaluation guidance cites 10 ppm as a gross limit for monitored metals other than phosphorus in jet oils and notes that satisfactorily operating engines generally produce wear-metal levels close to zero. That benchmark provides context, not a universal industrial limit. Asset design, oil volume, duty cycle, manufacturer guidance, and historical behavior still determine the maintenance response. (aviation used-oil evaluation guidance)
A stable, low baseline may reflect normal background metallurgy. A rising pattern deserves more attention, especially when it coincides with increasing particle counts, abnormal viscosity, water, temperature, vibration, or changed machine performance. A high result after a documented repair may reflect residual debris. A smaller increase that breaks a long-established baseline may indicate active deterioration.
Oil volume and the total oil-wetted surface area also change the concentration. The same debris generation can produce a different result in a compact gearbox and a large circulating system. A high-pressure hydraulic pump and a lightly loaded gearbox therefore need different alarm logic, even when both reports contain iron.
Context changes the maintenance decision
Before approving an expensive intervention, verify:
- Sample identity: Confirm the asset, compartment, oil grade, service hours, and sample date.
- Sample location: Establish that the bottle came from a live, well-mixed zone rather than a drain pocket or stagnant reservoir.
- Recent work: Check for replaced filters, seals, hoses, bearings, gears, or oil.
- Operating state: Record load, temperature, production cycle, startup history, and unusual events.
- Corroborating evidence: Compare the result with particle count, water, viscosity, ferrous debris, vibration, ultrasound, and thermography where appropriate.
A sound oil sampling and analysis process protects the value of every later sample. Poor sampling can make a normal report falsely reassuring or make an abnormal report appear urgent. The maintenance decision should be tied to the machine, contamination path, and repeatable evidence, not only to a marked-up laboratory page.
Evaluating Fluid Health and Physical Degradation
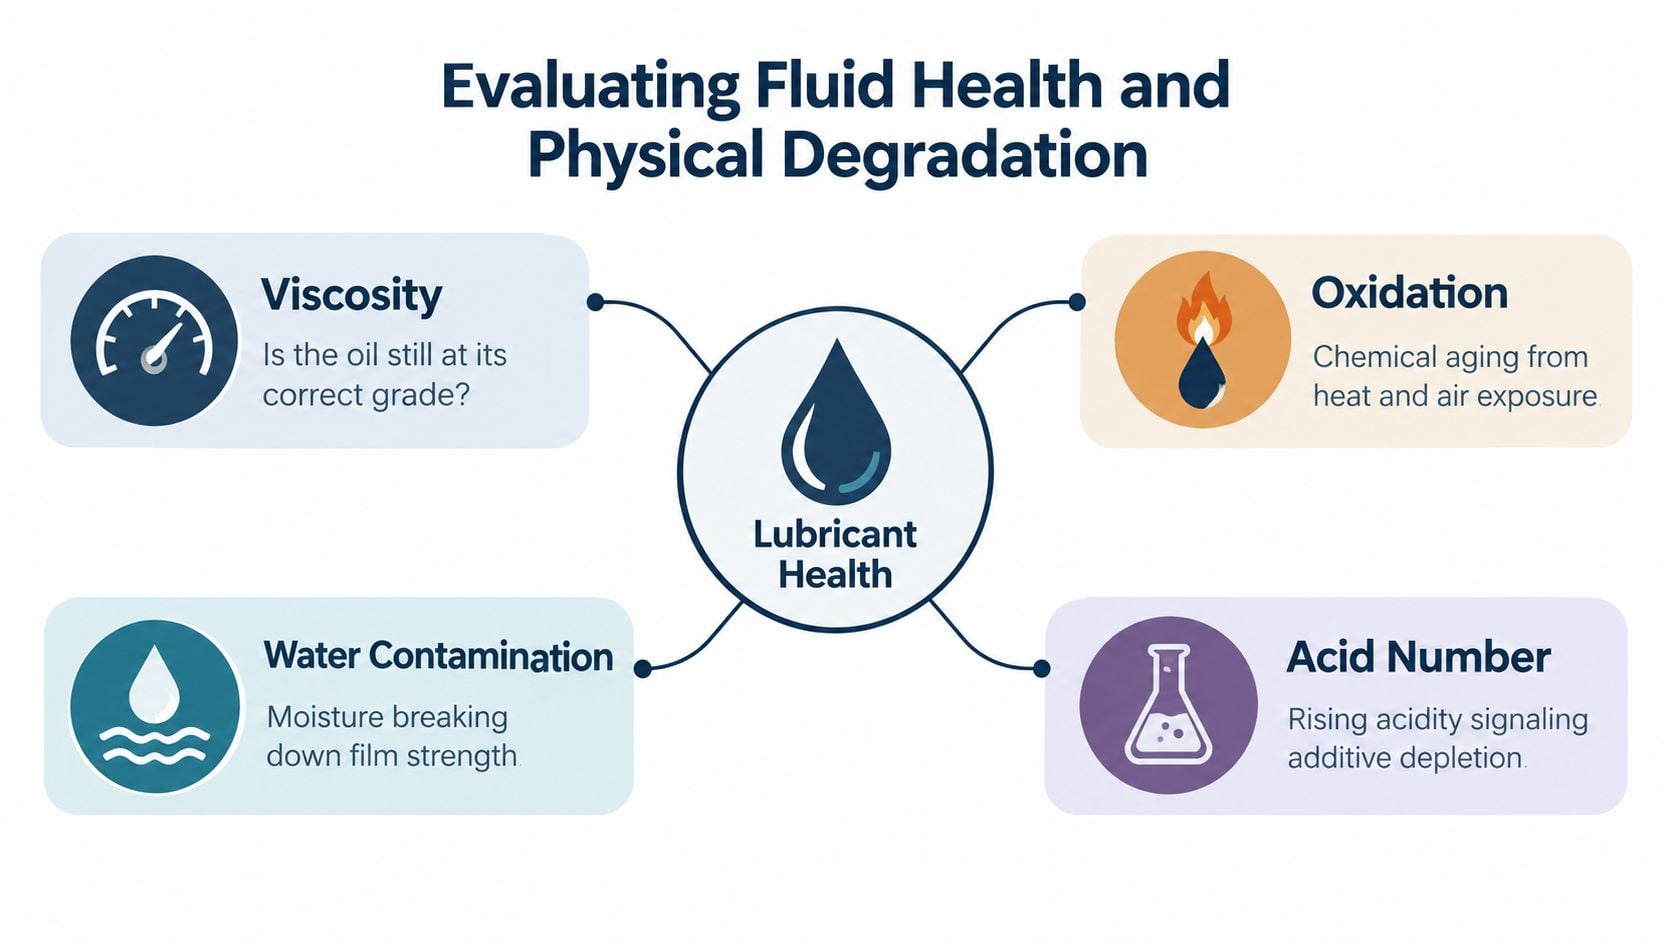
A machine can shed very little wear metal and still be at risk if its lubricant has lost viscosity, absorbed water, or accumulated incompatible fluid. Start with fluid condition before interpreting debris. This contamination-first sequence helps distinguish a damaged lubricant from a machine that is actively generating wear.
Start with viscosity and acidity
Viscosity measures the oil's resistance to flow. A shift can indicate physical degradation, contamination by another fluid, or an incorrect lubricant. Testing under ASTM D445 helps identify that change. In a circulating bearing system, oil that becomes too thin may fail to maintain the required film. Oil that becomes too thick can restrict flow, increase churning losses, delay circulation, or starve a component during startup. Industry oil analysis fundamentals guidance provides useful background for interpreting these results.
The original product and machine design set the proper context. A viscosity increase may indicate oxidation, thermal stress, or contamination. A decrease may point to shear, dilution, or the addition of a lower-viscosity fluid. Compare the result with fresh-oil reference data and prior samples from the same compartment, rather than judging it only against a generic grade. A high wear-metal result should trigger a verification plan, not an automatic teardown. Confirm the fluid condition and repeatability before assigning the result to a component failure.
Total Acid Number, or TAN, measures the alkaline material required to neutralize acidic constituents in the oil. A rising TAN can support a diagnosis of oxidation, additive depletion, or chemical contamination. Read it alongside viscosity, operating temperature, oil age, and service conditions.
Total Base Number, or TBN, describes the oil's reserve alkalinity. It matters particularly where combustion products create acidic compounds. A declining TBN may show that neutralizing additives are being consumed. TAN and TBN measure different conditions, so neither should determine an oil change interval on its own.
Treat water as a failure mechanism
Water can drive the failure rather than merely make the report look poor. It contributes to corrosion and wear, increases debris, reduces lubrication quality, plugs filters, impairs additives, and supports bacterial growth. A standard moisture determination method covers measurements from 20 mg/kg to 25,000 mg/kg, making it applicable to industrial gearboxes, turbines, and hydraulic systems. Standard moisture determination method
In a gearbox, water can damage bearing surfaces and promote rust. In a hydraulic system, it can reduce film strength and contribute to valve or servo problems. Trace the ingress path, which may involve breathers, seals, condensation, washdown, coolers, or process exposure. Removing water without correcting the entry point only resets the symptom. A practical industrial equipment oil analysis guide can help standardize which fluid indicators are reviewed together.
Inspect the bottle before the laboratory result
The bottle may reveal the first branch of the diagnostic decision tree:
- Cloudiness or haziness may indicate water, wax, coolant, refrigerant, or an incompatible lubricant.
- Non-magnetic sediment can point to dirt, dust, or sand.
- Magnetic particles may indicate rust or a more severe wear condition.
- Visible water or particles suggest abnormal equipment conditions and warrant corrective action.
These observations are consistent with lubricant analysis fundamentals guidance. A sample from a food-processing gearbox after washdown should not be interpreted like one from a sealed electric motor bearing. Appearance, fluid properties, and the wear result must agree before a teardown decision is made.
Decoding Particle Counts and ISO Cleanliness Codes
A hydraulic unit can show acceptable wear metals while particle counts rise sharply. That combination should send the team toward a contamination check before a component replacement. Small particles can interfere with valve clearances, damage load-carrying surfaces, accelerate abrasive wear, and reduce filter life. The risk is highest in hydraulic systems, servo circuits, precision lubrication points, and circulating oil systems.
The ISO 4406 cleanliness code reports particle contamination at three size thresholds, greater than 4 µm(c), 6 µm(c), and 14 µm(c). Results appear as a three-number code, such as 18/16/13. Each step upward represents a doubling of particle concentration, so a one-step increase deserves investigation rather than dismissal as normal variation. This convention is described in a contamination control handbook.
Read the code as a decision signal
The first number covers particles above the smallest threshold, the second covers the intermediate size, and the third covers larger particles. The code gives maintenance teams a consistent way to compare cleanliness between samples, machines, and service locations. It does not, by itself, define an acceptable condition for every asset.
For 18/16/13, example concentrations are approximately 1,300 particles/mL greater than 4 µm(c), 640 greater than 6 µm(c), and 80 greater than 14 µm(c). Use the trend direction for that asset, along with its component sensitivity, rather than treating the absolute code as a universal pass or fail limit. A worsening trend can justify breather inspection, filtration checks, or an ingress investigation.
The sample context determines how much confidence to place in the code. Record the sample point, whether the oil was circulating, the time since filtration or an oil change, and any recent top-up or maintenance activity. A sample taken from settled oil at a drain point may not represent the oil reaching a servo valve. A sample taken immediately after an oil addition may also reflect the transfer method more than the machine's normal condition.
Follow the contamination path
A rising code can result from environmental ingress, poor oil transfer, a degraded breather, inadequate filtration, filter bypass, or an active internal wear process. In a hydraulic power unit, a worsening count with stable wear metals may indicate contamination entering through a reservoir opening or breather. In a gearbox, a rise in larger particles deserves attention even if elemental results remain modest, because larger debris may be missed or underrepresented by some analytical methods.
Use the particle trend to test corrective work. If a filter change produces no improvement, check its rating, installation, location, bypass condition, and loading. The filter may be overwhelmed by an active ingress source. If the count improves while vibration or large-debris indicators worsen, suspended contamination is being controlled while a wear mechanism continues.
Document filtration state, breather condition, transfer practice, sample point, and recent fluid additions with every result. The lubrication systems oil analysis guidance can help standardize those records across critical assets.
Particle counting converts “dirty oil” into a measurable contamination trend. That trend gives the team a defined investigation path before a valve sticks or a bearing surface fails.
Separating True Wear Metals from False Positives
An iron spike on an oil report does not identify a failed component by itself. In a gearbox, iron may come from gear tooth wear, bearing distress, rust, or dirt introduced from outside. Copper may originate from a bearing overlay, bronze component, cooler, or residue left during maintenance. Aluminum, chromium, lead, and nickel require the same discipline. Their meaning depends on component metallurgy, oil-wetted surfaces, and operating conditions.
Start with the contamination path. Ask what entered the oil before deciding what the machine is shedding. Reversing that order can turn sampling error, mixed metallurgy, or fluid ingress into an unnecessary component replacement.
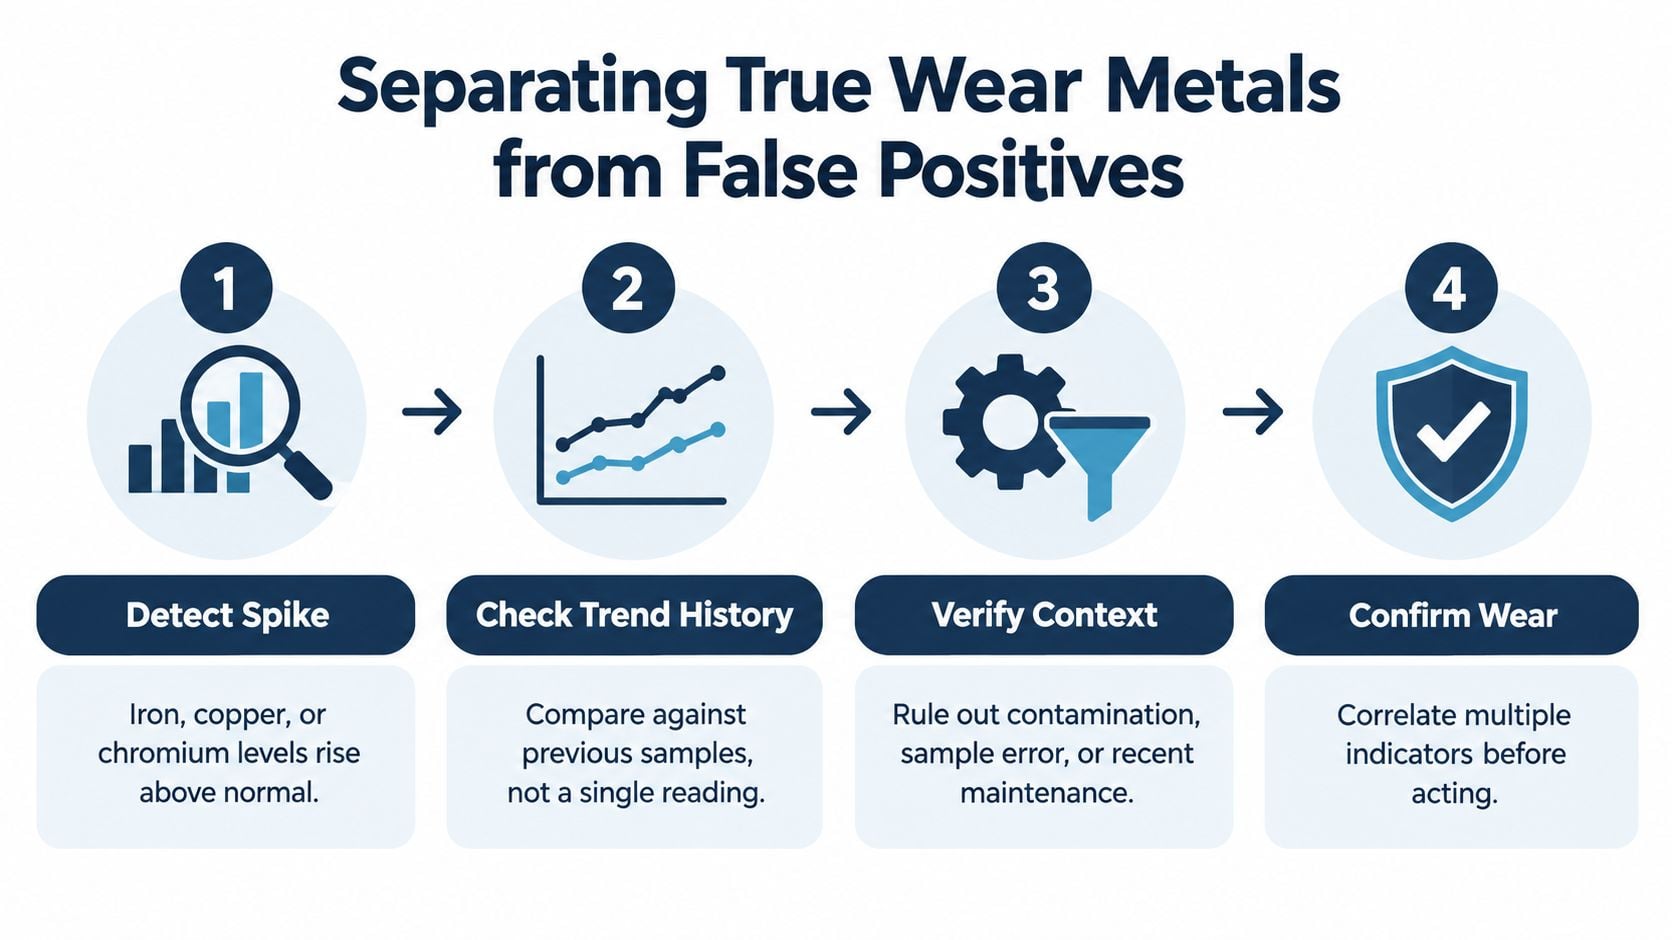
A contamination-first decision tree
First, verify the sample. Confirm the bottle, asset number, sample point, and collection timing. Check whether the sample followed an oil addition, came from a dirty port, or captured settled debris instead of representative fluid. A drain-plug sample can overstate localized sediment, while a return-line sample may contain a different particle population from reservoir oil.
Next, check contamination indicators. Review particle count, water, viscosity, appearance, coolant-related signals, and grease contamination together. A hose failure, washdown, seal replacement, or lubricant top-up can alter the report without demonstrating active internal wear.
Then, map elements to metallurgy. Correlate iron with ferrous debris and machine behavior. Consider copper alongside bearing and bushing materials. Chromium can indicate wear from plated or alloyed surfaces, but it has little diagnostic value until the oil-wetted surfaces are known.
Finally, confirm the failure mode. Take a repeat representative sample and compare it with debris inspection, vibration, ultrasound, temperature, or an accessible visual inspection. Schedule teardown only when several indicators support the same mechanism. An isolated elemental spike is a reason to investigate, not proof of failure.
Understand what the instrument cannot see
Spectrometric elemental analysis typically measures metals below approximately 10 µm and can miss larger debris trapped by filters, settled in the housing, or outside the method's effective range. Oil analysis interpretation guidance describes this limitation. A normal elemental result can therefore coexist with severe abnormal wear when the machine is producing larger particles.
Pair elemental results with particle counting, ferrous indexing, ferrography, filter debris inspection, and vibration. These methods add information about particle size, concentration, and morphology. Particle shape and appearance can help separate cutting wear, sliding wear, fatigue particles, and corrosion products.
Oil volume, total oil-wetted surface area, sample location, and the fresh-oil condition also affect reported concentrations. The bearing, gear, and seal failure interpretation resource helps connect high Fe, Cu, or Ni results with plausible component failure modes.
For a loaded conveyor gearbox, gradually rising iron accompanied by increasing vibration and coarse ferrous debris supports active gear or bearing wear. The same iron result alongside high dirt, water, and a recently cleaned sample port points first to contamination or sampling control. Those findings require different maintenance actions.
Building Statistical Baselines for Reliable Trending
A maintenance manager sees iron above the alarm limit in a gearbox report. Before scheduling an intrusive inspection, confirm whether the change is real. A useful trend begins with comparable samples, a known fluid baseline, and enough context to separate machine deterioration from sampling error, fluid changes, or contamination.
Trending depends on measurement discipline. Record how the asset behaves under normal conditions, how the oil changes during service, and how much variation the sampling method introduces. Use evenly spaced, representative samples, compare results with fresh-oil reference values, and review each result against prior reports. Oil analysis report interpretation and statistical trending describes this approach. A history built this way supports alarm limits that reflect the individual machine rather than generic thresholds alone.
Build the baseline deliberately
The sample plan should identify the asset, compartment, lubricant, sample location, operating hours or service interval, temperature, load, and recent maintenance. Take samples from the same location and under comparable operating conditions whenever practical. A reservoir sample collected after a long idle period may not represent the same condition as a live-zone sample collected while the system is running.
Fresh oil establishes the starting point. Additive metals and initial viscosity can otherwise be misread as wear or degradation. Include the indicators relevant to the asset, such as viscosity, water, particle count, elemental metals, TAN, TBN, and appearance. The baseline should also record lubricant changes, filtration work, unusual loads, and sampling-port repairs.
A compact hydraulic power unit shows why those notes matter. If an approved fluid with a different formulation is introduced during a changeover, the next report may show a viscosity or additive shift caused by product composition, not pump damage. Marking the event in the sample record prevents a false escalation.
Use mean, standard deviation, and z-score
With a sufficiently populated history, calculate the mean, the average result, and the standard deviation, which shows how widely normal results vary around that average. Convert the current result into a z-score:
z-score = (current result - historical mean) / historical standard deviation
A positive z-score places the current value above its established average. Analysts may also interpret it as a percentile, or the result's relative position within the historical distribution. It does not prove failure. It identifies an unusual result that needs confirmation and context.
A high iron z-score with stable contamination indicators, viscosity, water, vibration, and operating behavior should prompt a sample-quality check and repeat sample. A similar excursion accompanied by worsening contamination or mechanical evidence warrants faster escalation. The decision tree starts with sample integrity and fluid condition, then moves to wear diagnosis when the supporting evidence agrees.
Do not overfit a small dataset
Practitioner guidance often treats a substantially populated history as necessary before statistical classification becomes stable. A small dataset is more sensitive to random variation and unusual operating events, so early results should not define precise normal limits.
Early samples still have value. They establish equipment history, expose obvious contamination, and reveal major changes. During baseline development, use conservative review triggers, annotate operating events, and avoid closing a failure investigation just because one value remains inside a generic alarm band.
Separate screening from diagnosis. Screening flags a change. Diagnosis combines that change with sample quality, fluid condition, machine history, particle evidence, and other condition-monitoring results. This prevents statistical confidence from being mistaken for proof and helps maintenance teams spend inspection time where the evidence is strongest.
Translating Lab Data into Targeted Maintenance Action
A lab report earns its value when it changes a maintenance decision. Start with contamination, then test whether the result reflects an active failure, a sampling error, or fluid entering from outside. The corrective action should address the most probable mechanism and create a clear verification step.
For coolant ingress into a gearbox, isolate the source before treating the oil. Drain the contaminated fluid, flush the compartment, inspect affected surfaces, replace compromised filtration, and resample after the repair. For moisture entering a hydraulic reservoir, correct the breather or seal path, improve storage and transfer controls, remove the water, and verify the next particle and moisture results. An oil change cannot eliminate an active ingress route.
Rising wear metals require supporting evidence before intrusive work is scheduled. Check whether particle size, debris shape, vibration, temperature, or ultrasound confirms active wear. A bearing investigation may include vibration analysis, ultrasound, temperature confirmation, and inspection of lubricant delivery. Gearbox concerns may justify debris analysis or a controlled inspection of tooth surfaces. Match the response to the failure mode, not to the most alarming value on the page.
A practical validation checklist
Before closing the report, the maintenance planner should confirm:
- Sample quality: Verify the bottle, label, sampling location, timing, and equipment identity.
- Fluid condition: Review viscosity, water, acidity, appearance, and additive condition.
- Contamination source: Check dirt, coolant, grease, water, and handling practices.
- Wear evidence: Correlate elemental results with particle size, debris morphology, vibration, temperature, or ultrasound.
- Action verification: Schedule a follow-up sample or inspection to show whether the corrective action changed the trend.
- Work control: Record findings and next steps in a work order management process so the diagnosis remains available across shifts.
For teams strengthening their interpretation practice, the MA Hydraulics oil analysis guide offers practical context for common lubricant indicators. Oil analysis works best alongside vibration analysis and thermography because each method observes a different part of machine condition.
Forge Reliability pairs oil analysis with vibration and thermography to test whether a high iron or particle count reflects active wear or ingress, then documents the verification sample in the work order so the next trend is comparable. A free reliability assessment can identify where contamination control, sampling discipline, or cross-technology diagnostics will improve uptime.
Forge Reliability provides predictive maintenance, oil analysis, condition monitoring, and reliability consulting for industrial facilities. Visit Forge Reliability to request a free reliability assessment and discuss a contamination-first program for reducing unnecessary teardowns and unplanned downtime.