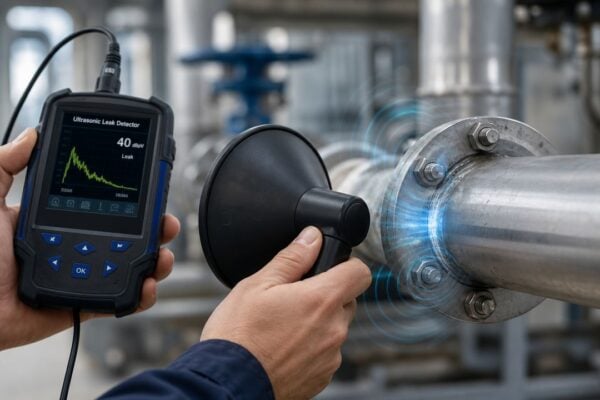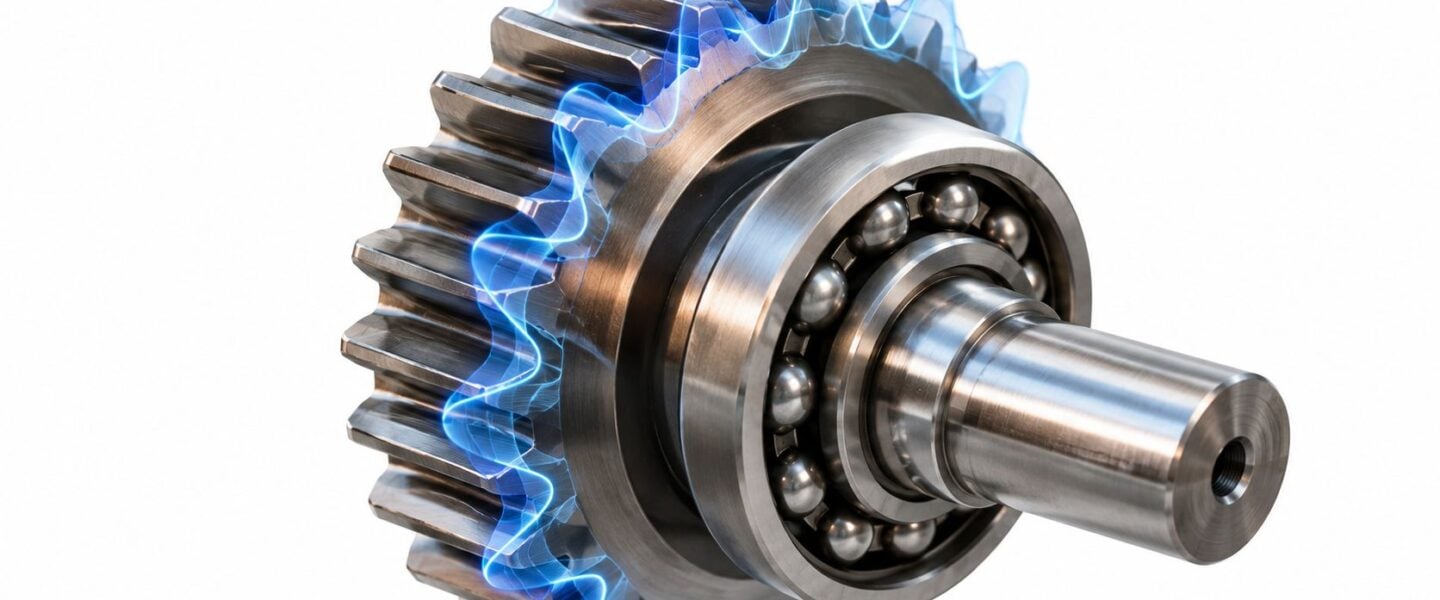
A boiler feed pump in a food and beverage plant can show acceptable overall vibration for months while a bearing defect develops inside the raw waveform. The pump sounds normal, temperature remains within its usual range, and a route report may show no urgent alarm. Then a rolling element damages the raceway, the defect grows rapidly, and the next inspection finds a bearing close to failure.
The warning may have been present all along, but hidden inside an amplitude modulated signal. A small, repeating impact can excite a much higher-frequency structural resonance, causing that resonance to grow and shrink in step with the defect. Overall vibration can average the pattern away, while a time waveform, spectrum, or envelope spectrum reveals the fault.
This diagnostic skill applies to pumps, fans, gearboxes, compressors, conveyors, and other rotating assets. The key is to recognize what modulation means, identify its carrier and modulating frequency, extract the hidden pattern with envelope analysis, and connect the result to a maintenance decision rather than treating every spectral peak as a failure.
Table of Contents
- Why Modulated Vibration Signals Hide Your Worst Failures
- What an Amplitude Modulated Signal Actually Is
- Reading Amplitude Modulation in the Time and Frequency Domains
- Diagnostic Signatures for Bearings, Gears, and Misalignment
- How Envelope Analysis and Demodulation Extract the Signal
- Interpreting Results and Troubleshooting False Alarms
- Turning Amplitude Modulation Detection Into Reliability Results
Why Modulated Vibration Signals Hide Your Worst Failures
A maintenance engineer reviewing the boiler feed pump may see a stable overall acceleration trend and close the work order. That decision is understandable if the route measurement uses a broad frequency range and a single overall value. It can still miss a localized bearing defect because the defect produces brief impacts rather than a large continuous vibration.
Each impact excites the pump housing or bearing structure at a natural resonance. A natural resonance is a frequency at which a structure responds strongly when it receives an impulse. The resonance may ring at a high frequency, but the impacts arrive at the bearing defect frequency. The result is a high-frequency vibration whose amplitude rises and falls at a lower repeating rate.
The raw signal therefore contains two behaviors at once:
- The carrier: the high-frequency ringing produced by the machine structure.
- The modulator: the repeating impact pattern produced by the fault.
- The envelope: the outline formed by the changing amplitude of the carrier.
- The defect frequency: the rate at which the fault repeats as the shaft rotates.
A normal overall reading compresses these behaviors into one value. That value can remain modest while the fault becomes more organized and more repetitive. The maintenance risk lies in the pattern, not only in the total energy.
Practical rule: A stable overall vibration value doesn't prove that a bearing is healthy. It only shows that the measured total energy hasn't crossed the selected alarm boundary.
A route program becomes more useful when the technician records consistent sensor locations, operating conditions, and signal-processing settings. The vibration monitoring route setup guide provides a useful framework for keeping those measurements comparable.
The failure path inside the pump
An outer-race defect can strike the rolling elements whenever they pass over the damaged zone. An inner-race defect moves with the rotating shaft and enters the loaded zone as the shaft turns. A poor fit, inadequate lubrication, contamination, or excessive load can accelerate the damage after the first defect appears.
The first indication may be a clean envelope peak at a bearing defect frequency, with several related harmonics. Later, the time waveform may show sharper impacts, the high-frequency carrier may become more energetic, and temperature or audible noise may begin to change. The maintenance team should treat the sequence as a developing failure mechanism, not as an isolated number.
The rest of the diagnostic process follows a repeatable path. The analyst examines the time waveform, identifies sidebands in the frequency spectrum, separates bearing and gear signatures, applies envelope analysis, checks for false alarms, and selects monitoring, planned repair, or immediate shutdown based on evidence.
What an Amplitude Modulated Signal Actually Is
A guitarist can strum a steady note while another hand repeatedly squeezes and releases the sound's volume. The pitch of the strum stays the same, but the loudness rises and falls. The steady note acts like the carrier, and the rhythmic squeezing acts like the modulation.
A rotating machine produces the same relationship mechanically. In a chemical processing plant gearbox, the gear teeth generate a repeating high-frequency mesh force. A damaged tooth, changing load, or shaft-related disturbance varies the strength of that force. The gear mesh frequency remains in the same location, but its amplitude rises and falls according to the fault event.
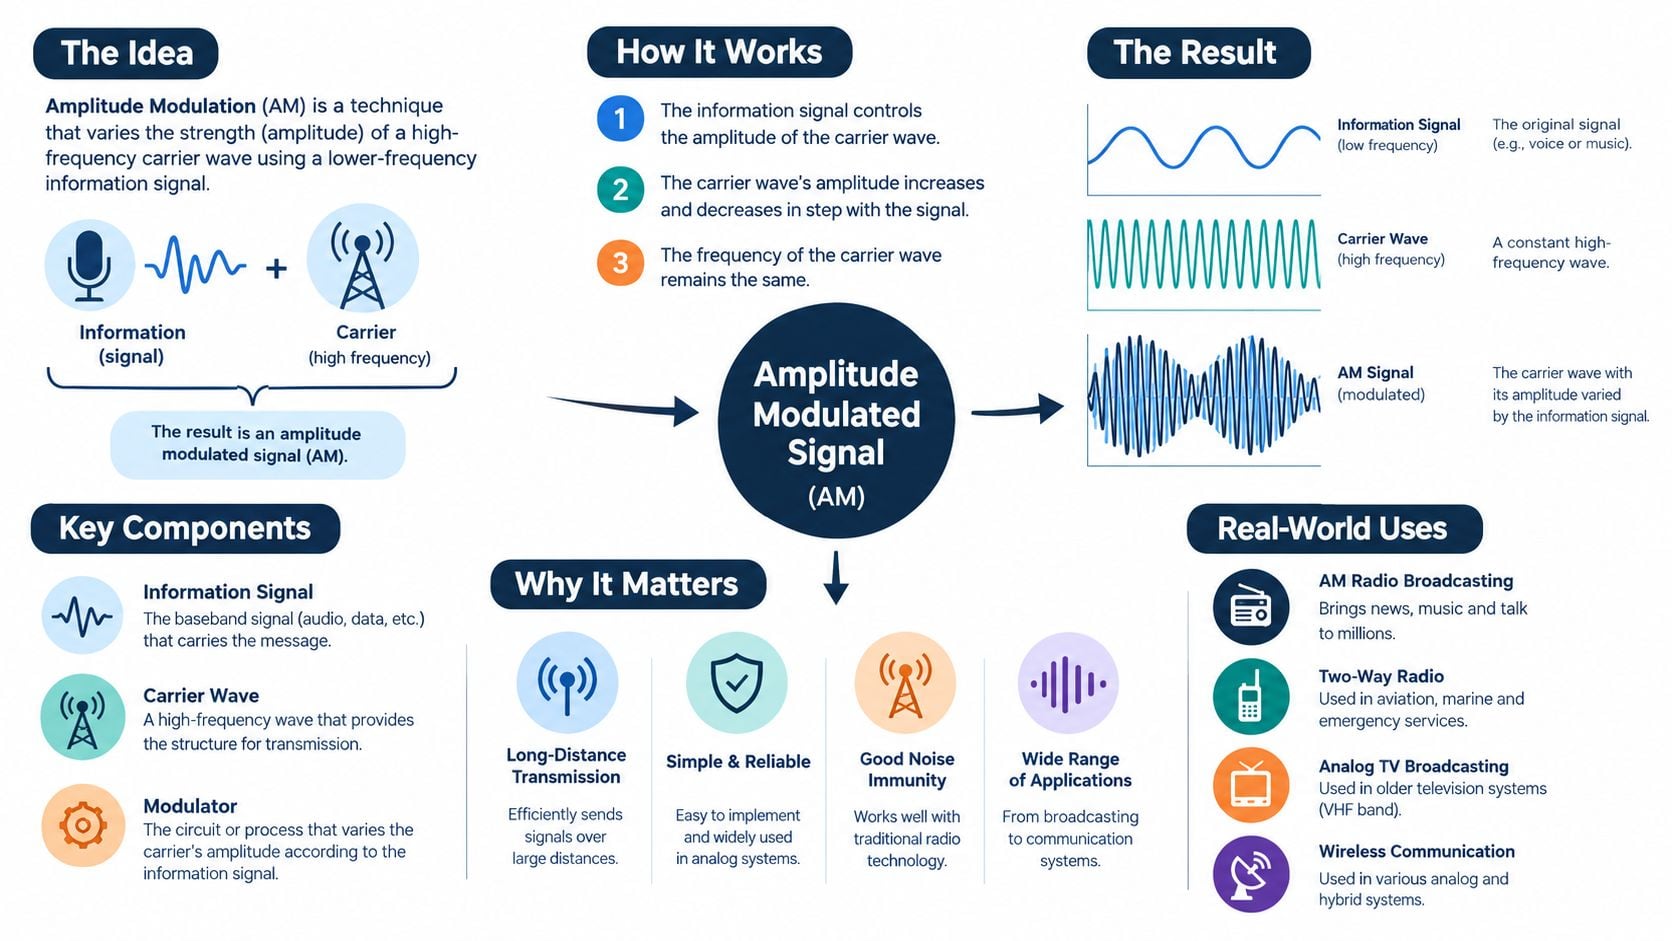
An amplitude-modulated signal is formed when the amplitude of a high-frequency carrier varies in proportion to an instantaneous modulating signal, while the carrier frequency itself remains unchanged. That distinction matters. A frequency shift means the carrier is moving in frequency. Amplitude modulation means the carrier stays in place while its strength changes. The technical description of AM signal formation describes this same core mechanism.
Translating the radio idea to machinery
Radio engineers vary a carrier's amplitude to carry information. The carrier provides a stable high-frequency vehicle, while the lower-frequency audio signal controls its amplitude. Rotating equipment produces modulation unintentionally when a periodic mechanical event changes the force acting on a structural resonance.
For the gearbox, the carrier could be a resonance near the gear mesh region. The modulating event could be a cracked tooth entering mesh once per shaft revolution. The analyzer sees a strong component at gear mesh frequency, but that component is not steady. It has a repeating amplitude pattern linked to the damaged tooth.
This distinction helps separate carrier frequency from fault frequency:
- The carrier identifies the structure or force being excited.
- The modulating frequency identifies the event controlling the carrier's amplitude.
- The sideband spacing confirms the relationship between the two.
- The envelope spectrum removes much of the carrier and makes the event easier to identify.
A technician measuring the gearbox shouldn't ask only, “Which peak is highest?” The better question is, “Which frequency is carrying the changing amplitude, and what machine event repeats at the spacing around it?”
Why measurement discipline matters
The sensor must have a reliable mechanical path to the bearing housing or gearbox casing. Loose mounting, paint, dirt, or a poor contact surface can attenuate high-frequency impacts and create misleading envelopes. Measurement location also matters because a resonance near the damaged component usually carries the clearest modulation.
A practical guide to measuring vibration can help technicians standardize sensor placement and collection technique. Without that consistency, a change in mounting may look like a change in machine condition.
Amplitude modulation doesn't identify a failure by itself. It identifies a relationship between a carrier and a repeating event. The maintenance decision comes from matching that relationship to bearing geometry, gear mesh, shaft speed, operating load, and supporting evidence.
Reading Amplitude Modulation in the Time and Frequency Domains
The same gearbox fault can look ambiguous in one view and obvious in another. The time domain shows how vibration changes moment by moment. The frequency domain shows which frequencies contain the vibration energy. A reliable diagnosis uses both.
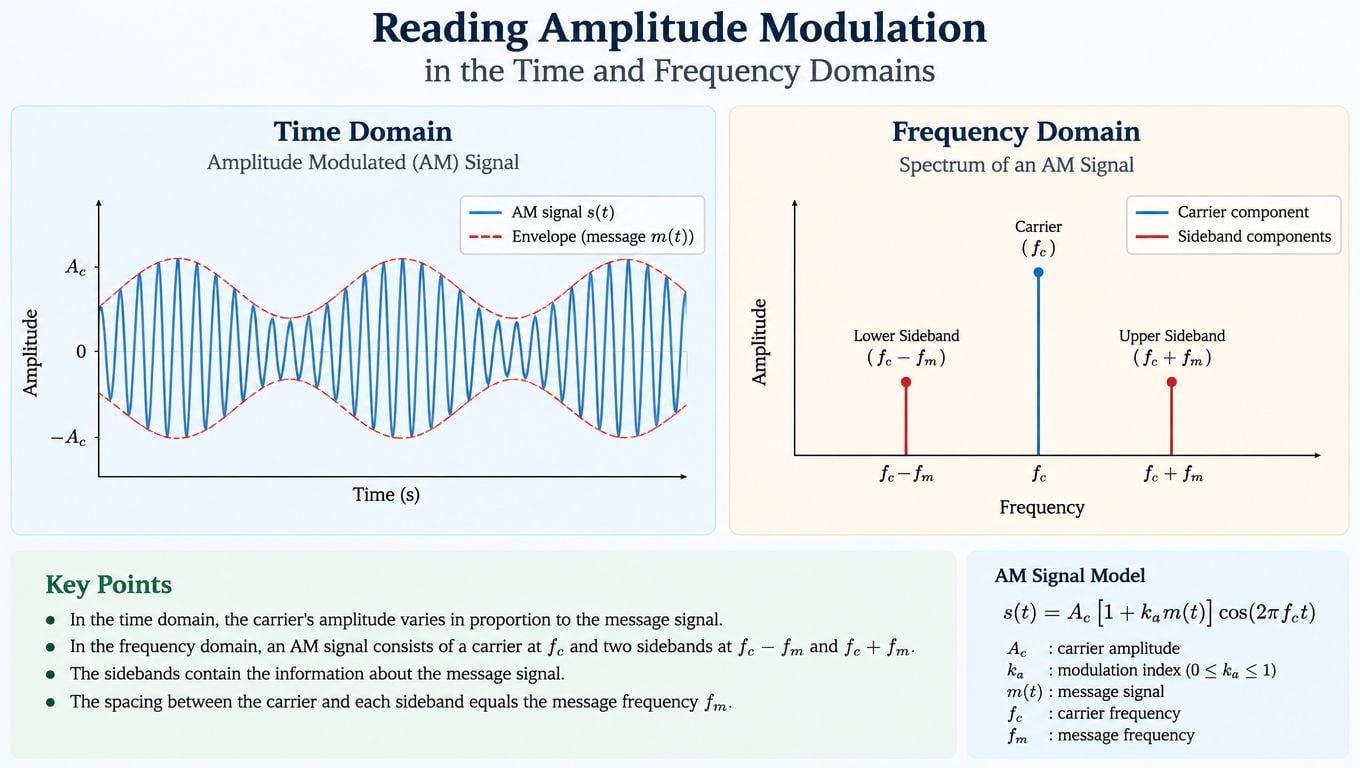
Suppose a mining conveyor gearbox has a localized tooth defect. Each time the damaged tooth enters mesh, the impact excites a casing resonance. In the time waveform, the resonance appears as a burst of rapid oscillation. Those bursts repeat at the shaft-related fault rate, so the waveform displays a visible envelope that grows and shrinks in a regular pattern.
The high-frequency oscillations are the carrier. The distance between successive bursts represents the modulating period. If the bursts become irregular, the analyst should consider changing load, speed variation, looseness, or a second source of excitation rather than assuming a single tooth defect.
What the spectrum adds
In the frequency domain, the carrier appears as a component at the gear mesh frequency or structural resonance. The fault-related modulation creates sidebands, which are smaller components positioned around the carrier. For a single-tone AM signal, the upper sideband occurs at carrier frequency plus modulating frequency, while the lower sideband occurs at carrier frequency minus modulating frequency. This relationship is described in the RF modulation fundamentals reference.
For the conveyor gearbox, sidebands spaced at running speed around gear mesh suggest that a shaft-related event is changing the mesh force. Sidebands spaced at another calculated bearing frequency point toward a bearing defect exciting the same resonance. The carrier tells the analyst where the energy is concentrated. The spacing tells the analyst what is controlling it.
The number and regularity of sidebands also matter:
- Symmetric sidebands suggest organized amplitude modulation around a carrier.
- Multiple harmonics of the spacing indicate repeated impacts or a non-sinusoidal modulating event.
- Uneven sidebands can reflect changing load, transfer-path effects, or a fault located away from the sensor.
- Extra unrelated peaks may indicate multiple faults, electrical interference, or another machine operating nearby.
A spectrum should be read against machine kinematics, not in isolation. Shaft speed, gear tooth count, bearing geometry, and known resonances provide the reference points needed to interpret the pattern.
A useful screen-side sequence
The analyst can review the data in this order:
- Confirm that the running speed and major mechanical frequencies are correct.
- Identify a high-frequency carrier or resonance with unusual energy.
- Measure the spacing between sidebands rather than focusing only on the carrier height.
- Compare the spacing with shaft speed, bearing defect frequencies, and gear-related frequencies.
- Return to the time waveform and check whether the impacts repeat consistently.
The ISO vibration standards resource can support broader severity evaluation, but standards-based overall values shouldn't replace pattern recognition. A machine can remain within a general vibration limit while a localized fault develops in a modulated high-frequency signal.
Diagnostic Signatures for Bearings, Gears, and Misalignment
The same amplitude modulation principle appears in several failure modes, but the carrier, spacing, and time waveform differ. A bearing defect usually produces impulsive excitation of a resonance. A gear fault often changes tooth-mesh force. Misalignment and looseness can vary load across the rotation cycle and modulate running-speed components.
In an oil and gas pumping train, an outer-race defect may create repeated impacts as rolling elements pass over the damaged raceway. Those impacts excite a bearing or casing resonance. Envelope analysis then reveals the outer-race defect frequency and its harmonics more clearly than a conventional low-frequency spectrum.
A cracked gear tooth in the same train produces a different pattern. The damaged tooth affects the mesh force when it enters contact, so sidebands often gather around gear mesh frequency at a spacing related to the shaft carrying that gear. Gear wear can create broader sideband activity and several harmonics because the mesh force changes over repeated tooth engagements.
Misalignment requires more caution. Angular or parallel misalignment changes coupling forces and bearing load as the shaft rotates. The resulting modulation can appear around 1X and 2X running speed, where 1X means shaft rotational frequency and 2X means twice that rotational frequency. Rolling element bearings can also show load-zone modulation, because the loaded portion of the bearing changes as the shaft and coupling geometry impose varying forces.
Comparing the main signatures
| Failure Mode | Where Modulation Appears | Distinguishing Signature | Typical Action |
|---|---|---|---|
| Bearing defect | High-frequency bearing or casing resonance | Envelope peaks match an inner-race, outer-race, or rolling-element defect frequency | Confirm lubrication, load, temperature, and defect progression. Plan bearing replacement or isolate the asset if severity escalates |
| Gear tooth damage | Gear mesh frequency and its harmonics | Sidebands around mesh frequency, often spaced by the shaft frequency associated with the damaged gear | Inspect tooth condition, backlash, lubrication, alignment, and load. Plan gear repair before tooth loss |
| Misalignment | Running-speed components and structural resonances | Modulation at 1X or 2X with directional or coupling-related changes | Check soft foot, pipe strain, coupling condition, shaft alignment, and operating load |
| Mechanical looseness | Running-speed harmonics and impact resonances | Nonlinear impacts, irregular bursts, and broad harmonic activity | Inspect fasteners, fits, baseplate, bearing housings, and structural joints before replacing components |
The bearing failure reference helps connect spectral evidence to physical damage mechanisms. That connection prevents a common mistake, replacing a bearing when the root cause is misalignment, contamination, poor lubrication, or an incorrect fit.
The consequence determines the urgency
A clean bearing defect frequency with stable amplitude may justify tighter monitoring and a planned intervention. A rapidly rising envelope, sharp time-domain impacts, increasing temperature, or visible lubricant debris changes the decision. A cracked gear tooth on a critical export pump deserves more urgency than a similar pattern on a standby conveyor, because the consequence of secondary damage and lost production differs.
The analyst should document the suspected failure, the carrier, the modulating frequency, the measurement location, operating state, and recommended action. “Abnormal vibration” isn't enough. The work order should state whether the team needs inspection, lubrication correction, alignment verification, a spare bearing, or a controlled shutdown.
How Envelope Analysis and Demodulation Extract the Signal
A conventional FFT can miss an early bearing defect because the impact energy is small and spread across a high-frequency resonance. The defect frequency may not appear as a strong low-frequency peak in the raw spectrum. Envelope analysis extracts the repeating impact pattern so the analyst can evaluate its frequency separately from the carrier resonance.
A paper mill fan provides a practical example. The fan's outer-race defect creates short impacts that excite a casing resonance. A normal velocity spectrum may show little change, while an acceleration measurement processed through a suitable high-frequency band reveals a clear envelope peak at the outer-race defect frequency.
Step one starts with the measurement
The technician should collect acceleration near the bearing suspected of carrying the defect. The sensor location should be as close as practical to the load zone, and the fan should be operating at a documented speed and load. Consistent mounting matters because high-frequency content is more sensitive to contact quality than low-frequency shaft vibration.
The next task is choosing a filter band. A bandpass filter allows a selected range of frequencies to pass while reducing energy outside that range. The band should contain a structural resonance excited by the impacts, rather than an arbitrary region with no response from the machine.
Useful selection methods include:
- Resonance search: review a high-frequency spectrum and choose the band with a strong, repeatable response to impact.
- Fixed plant band: use a validated frequency band when similar fans and sensor locations behave consistently.
- Comparison testing: collect more than one candidate band and select the band that produces the clearest, repeatable defect pattern.
Step two removes the carrier
Demodulation, in this context, means separating the changing amplitude from the high-frequency carrier. The analyzer may rectify the signal, calculate its envelope, or use an equivalent mathematical process to follow the carrier's amplitude changes. The output is a lower-frequency signal representing the impact repetition.
The final step is an FFT of that envelope. The resulting envelope spectrum can show bearing defect frequencies, harmonics, and sidebands with less interference from the original resonance. The analyst should compare the peaks with calculated bearing frequencies and verify that the pattern remains tied to the same physical location.
Step three checks repeatability
A single clean-looking envelope peak isn't enough for a repair order. The technician should repeat the measurement, compare neighboring bearings, check the same asset under similar operating conditions, and review the time waveform for periodic impacts. The vibration analysis sensors guide provides additional context for selecting and applying sensors in a repeatable program.
A poor filter can create a poor diagnosis. If the band excludes the resonance, the envelope becomes weak. If it includes strong unrelated vibration, the result may contain misleading peaks. If the machine speed changes, frequency resolution and tracking settings may need adjustment so a real defect doesn't appear to move or disappear.
Interpreting Results and Troubleshooting False Alarms
Detection becomes valuable only when it leads to a proportionate maintenance response. An envelope peak can indicate a real bearing defect, but it can also reflect a measurement problem, operating change, or interference from another machine. The maintenance manager needs a confirmation path before scheduling an outage.
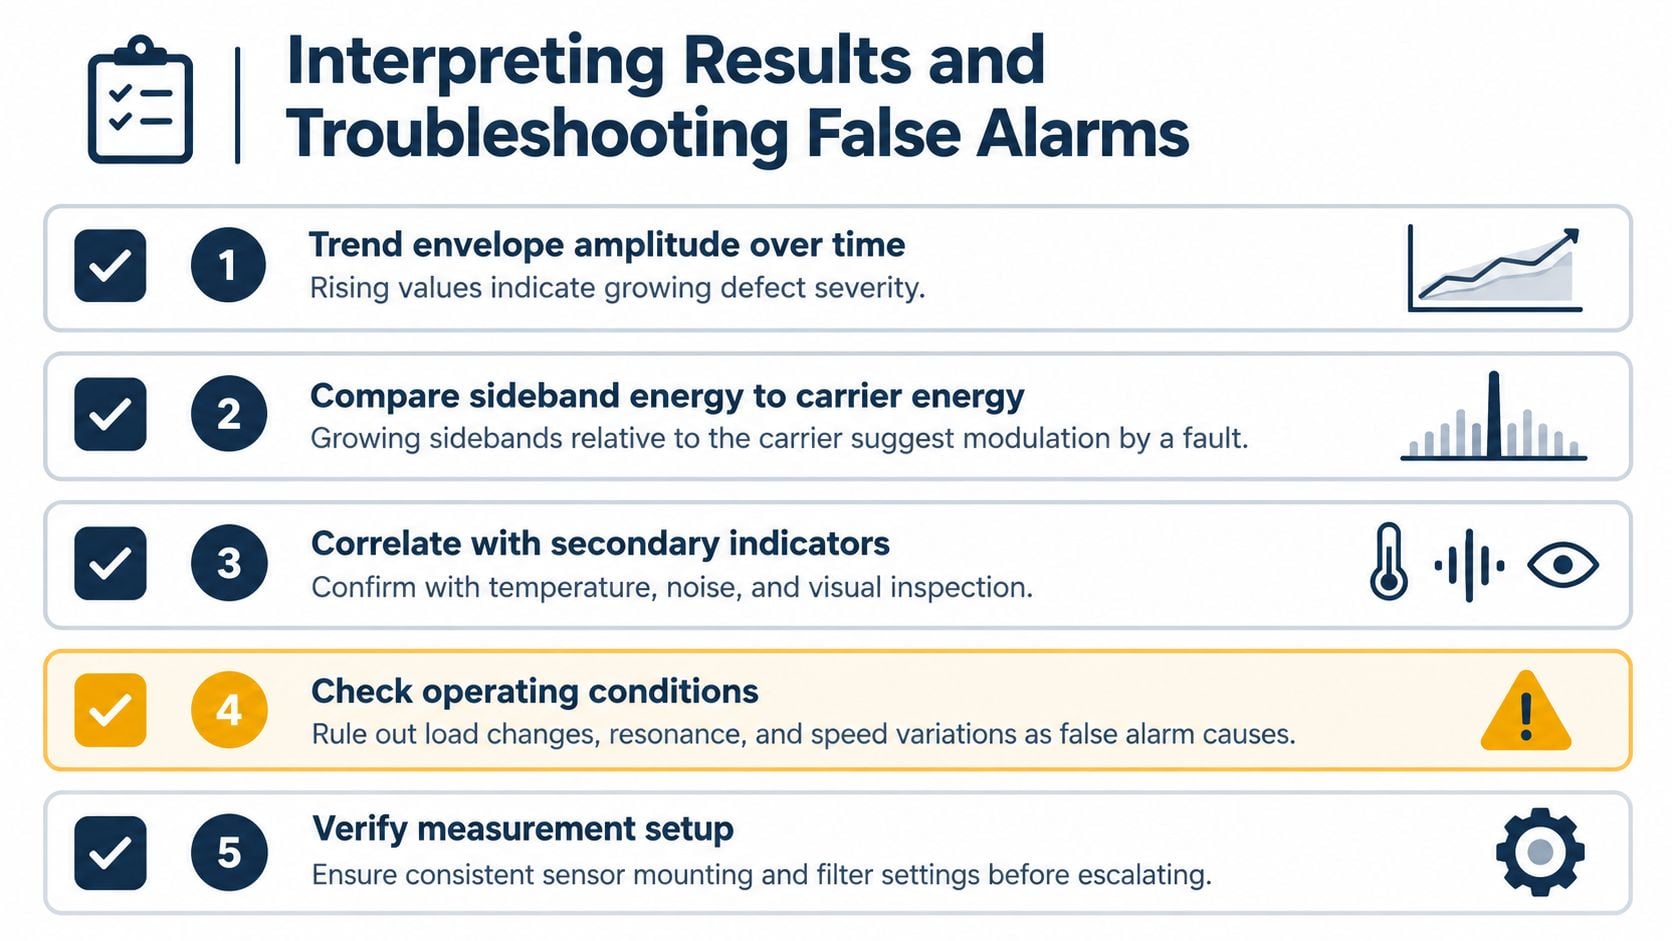
Start with the trend. A rising envelope amplitude under comparable operating conditions carries more weight than a single isolated reading. Compare sideband energy with carrier energy, then review the time waveform for sharper or more frequent impacts. A growing set of harmonics often indicates that the event is becoming more repetitive or nonlinear, but the pattern still requires physical confirmation.
A confirmation sequence
- Repeat the measurement. Use the same sensor location, direction, mounting method, filter band, speed, and load where possible.
- Check the calculated frequency. Compare the suspected peak with actual shaft speed and the bearing or gear geometry. A peak that only resembles a fault frequency deserves caution.
- Look for secondary evidence. Check bearing temperature, audible noise, lubrication condition, oil debris, coupling condition, and visual access points.
- Compare adjacent points. A true local bearing fault usually has a stronger response near the affected bearing than at distant machine locations.
- Test operating dependence. Changes with load, speed, or process state may indicate resonance or force modulation rather than progressing damage.
Common false alarms
Two nearby machines running at slightly different speeds can create a beat frequency. A beat frequency is a slow amplitude variation produced when two nearby frequencies interact. It can look like modulation even when neither machine has a bearing defect.
Electrical interference can also mimic a mechanically meaningful frequency, especially around motor-related components. Looseness may produce impacts and harmonics that resemble advanced bearing damage. A transducer mounted on paint, a curved surface, or a loose magnetic base can smear high-frequency data and change the apparent envelope.
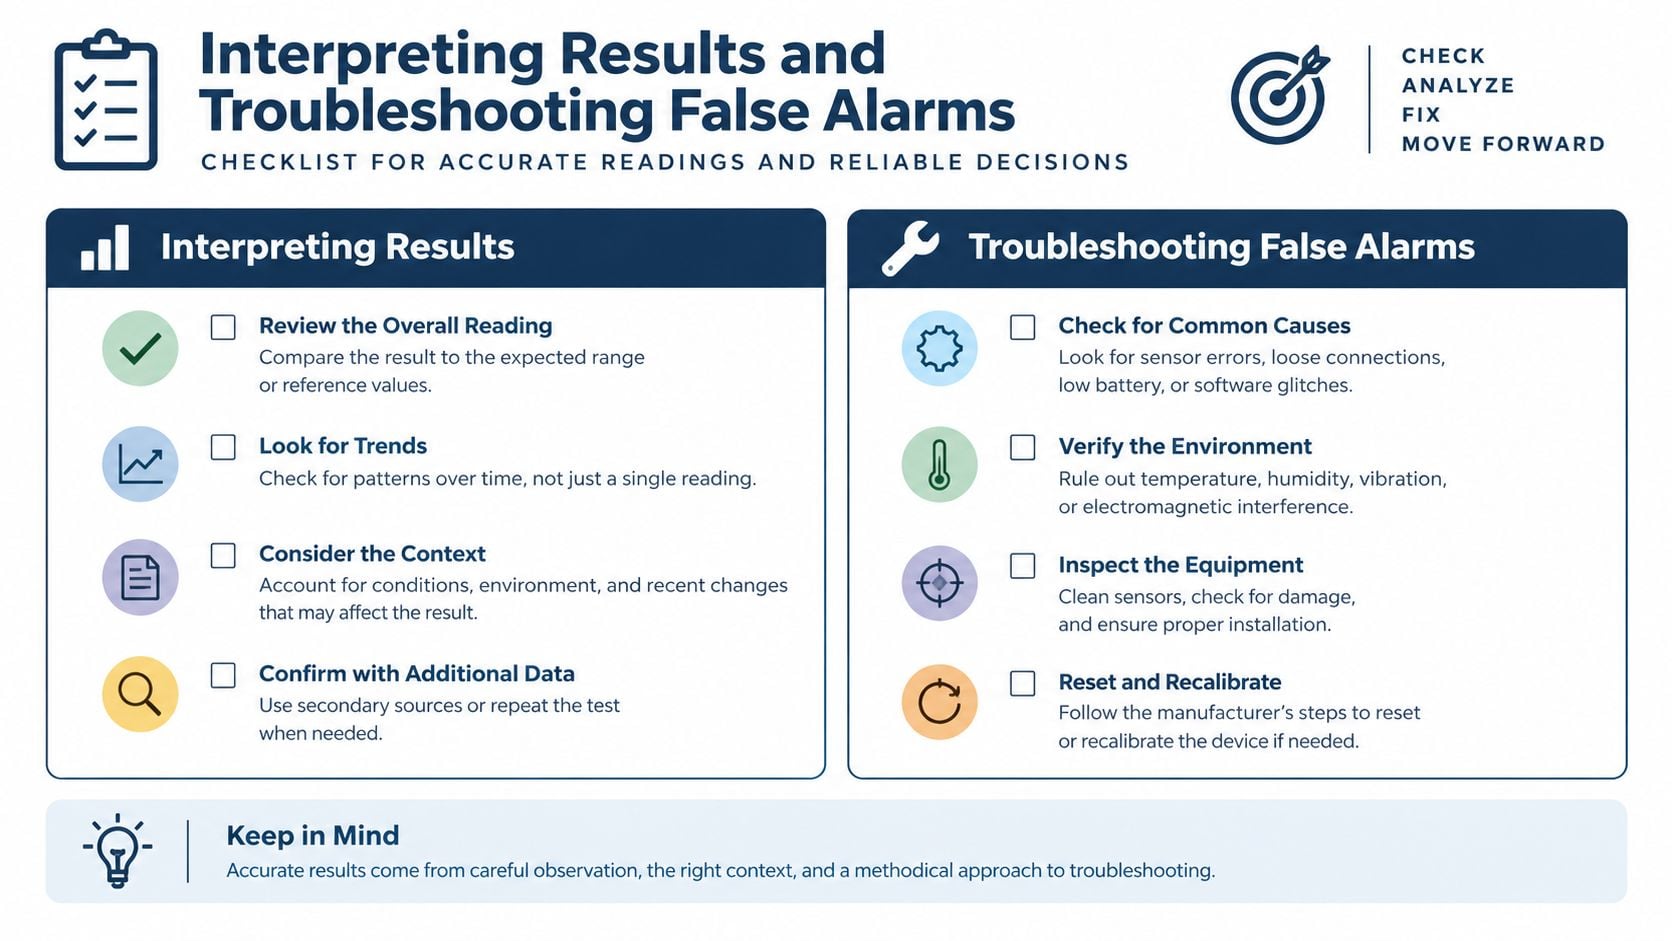
Confirmation before escalation: A diagnosis becomes stronger when the frequency relationship, physical location, trend, time waveform, and secondary condition indicators all point to the same failure mechanism.
Choosing the maintenance response
On a power generation cooling pump, a stable envelope peak with no temperature change and no worsening impact pattern may justify shorter monitoring intervals and a planned inspection. A confirmed bearing defect with a consistent upward trend can support bearing replacement at the next suitable outage, while the team prepares parts, labor, lifting equipment, and a root cause review.
Immediate action is appropriate when the envelope rises sharply, impacts become severe, temperature increases, lubrication debris appears, or the pump's condition threatens cooling capacity. The decision should also consider redundancy, process consequence, bearing criticality, and the possibility of secondary shaft or housing damage.
The critical point is to avoid both extremes. Ignoring a modulated signature wastes early warning. Replacing a component solely because an analyzer displayed a peak can waste outage time and leave the underlying cause untouched.
Turning Amplitude Modulation Detection Into Reliability Results
Amplitude modulation detection gives a reliability program a way to find localized damage before it dominates overall vibration. Bearing impacts, gear tooth defects, load-zone changes, and looseness can become actionable patterns when analysts connect the carrier, sideband spacing, envelope trend, and physical inspection.
A practical program treats envelope analysis as a standard part of condition monitoring for critical rotating equipment. Route-based teams can apply it during scheduled measurements. Continuous monitoring systems can trend the same indicators between inspections. In both cases, consistent sensor placement and operating context matter as much as the analysis method.
The most useful workflow is concise:
- Find the carrier in the high-frequency response.
- Identify the modulation rate from the envelope or sideband spacing.
- Match the rate to bearing, gear, shaft, or structural behavior.
- Confirm the mechanism with time waveform, trend, temperature, lubrication, and inspection evidence.
- Assign an action that reflects failure severity and production consequence.
Plants without in-house vibration expertise can use a qualified condition monitoring partnership to build this capability, establish repeatable routes, and document maintenance outcomes. The program should produce more than alarms. It should produce defensible work orders, better outage planning, root cause findings, and clear decisions about which assets need continuous attention.
Forge Reliability applies vibration analysis, envelope detection, oil analysis, thermography, and other condition monitoring methods to identify modulated signatures in critical pumps, fans, gearboxes, motors, and conveyors. Plant leaders can visit Forge Reliability to schedule a free reliability assessment and have plant-floor specialists evaluate the highest-risk assets, with a 24-hour response.