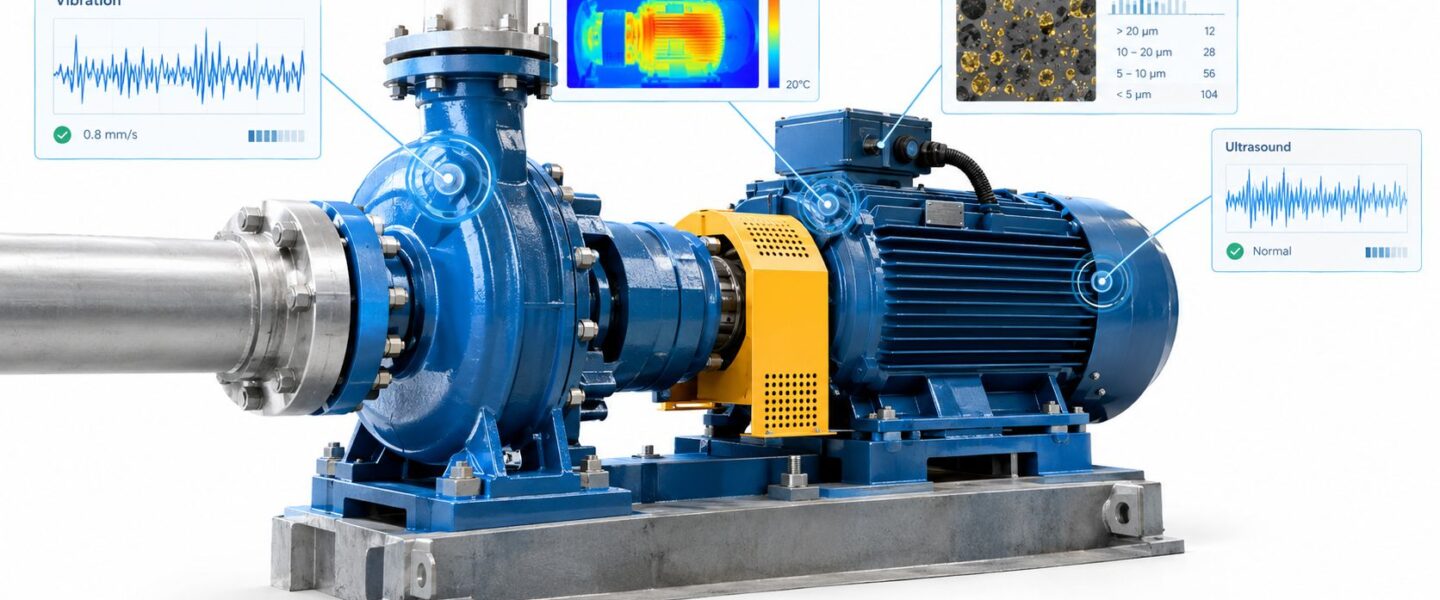
Industrial plants still lose an average of 27 hours per month to unplanned downtime, even after improvement from 39 hours in 2019, according to a Siemens industry report on the true cost of downtime. At a cement facility, those hours rarely represent only a failed bearing or a stopped motor. They also represent interrupted material flow, unstable kiln operation, emergency labor, expedited parts, and production decisions made under pressure.
Condition monitoring changes the maintenance question from “What failed?” to “What is changing, why is it changing, and when should the plant intervene?” The benefits of condition monitoring appear when vibration, temperature, lubricant condition, ultrasound, electrical signatures, and process data lead to a specific maintenance decision. Sensors alone don't create reliability. Evidence connected to diagnosis, planning, and execution does.
Table of Contents
- The Real Cost of Unplanned Downtime
- What Condition Monitoring Actually Does
- Quantifiable Benefits and the KPIs That Track Them
- How Each Diagnostic Technique Delivers Specific Benefits
- Route Versus Continuous Monitoring and How Data Becomes Decisions
- Industry and Equipment Examples of the Benefits in Practice
- Common Pitfalls That Quietly Erase the Benefits
- Building a Program That Actually Pays Off
The Real Cost of Unplanned Downtime
A cement plant can lose an entire production sequence because of a defect that began in one small component. A pump bearing starts to spall, a compressor coupling slips out of alignment, or a conveyor gearbox develops gear wear. The replacement part may cost far less than the lost operating time, disrupted material flow, and difficult restart that follow.
The downtime benchmark cited in the Siemens report is useful for framing exposure, but its operational effect depends on the failed asset. A raw mill conveyor gearbox can stop material feed. A process pump failure can disrupt cooling, lubrication, or slurry transfer. A motor-compressor train can restrict an entire process area instead of isolating one machine.
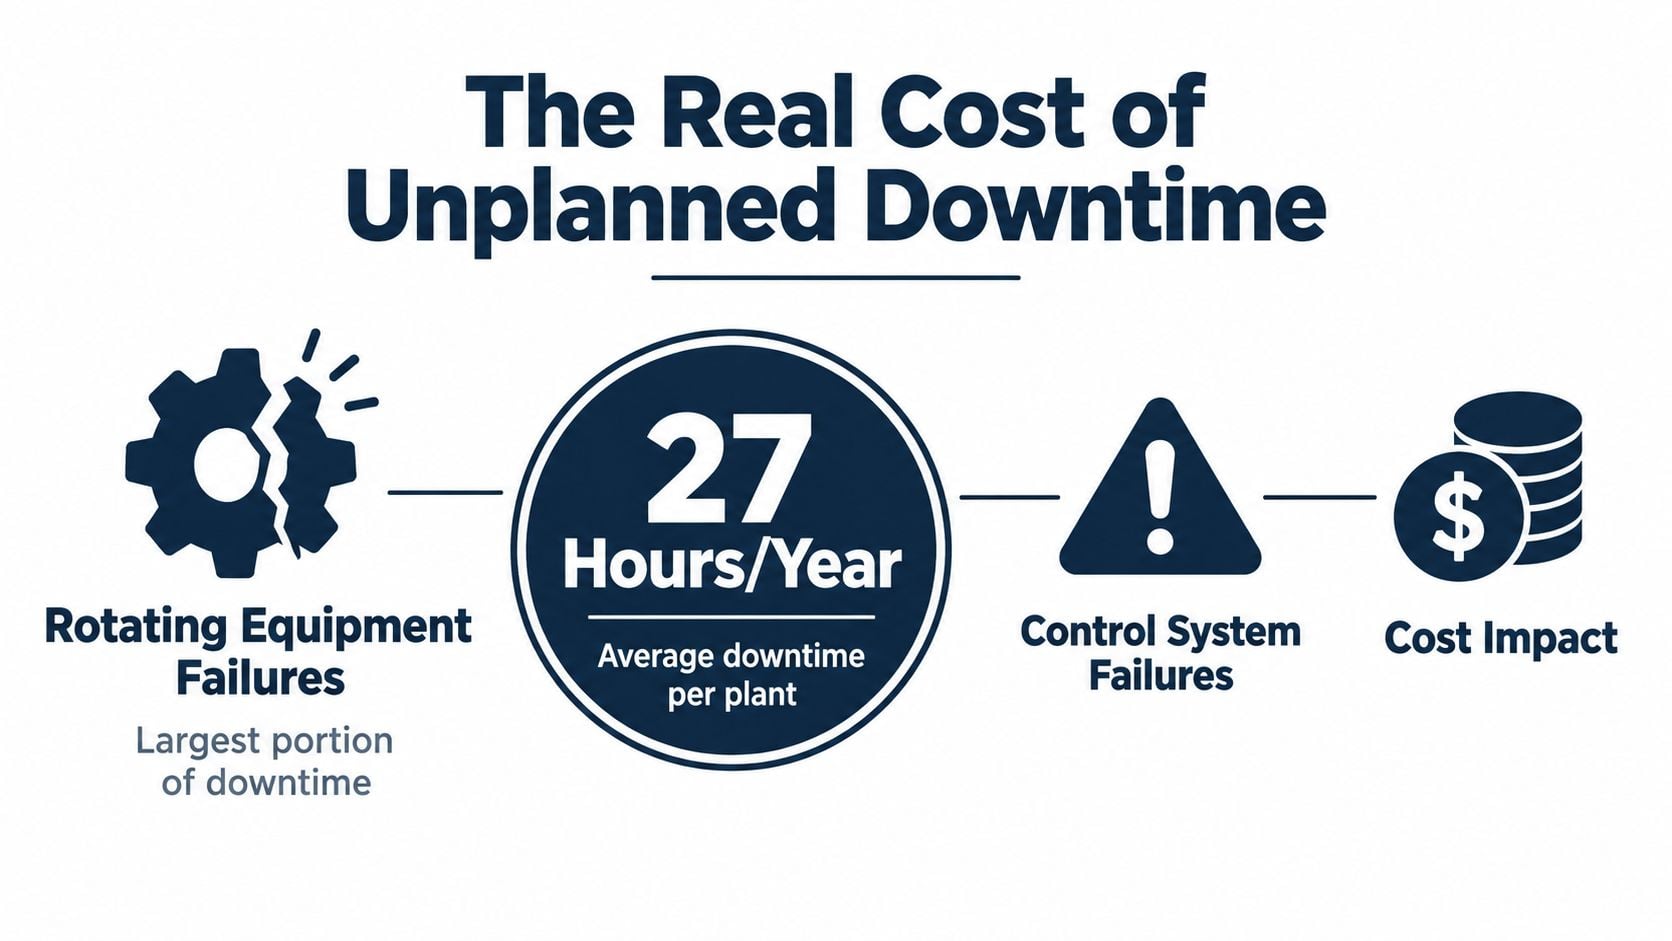
The loss extends beyond the failed part
Production loss is only the first line item. The maintenance and operations review should also cover:
- Scrapped or off-specification material: An interruption can leave material unusable or require a controlled restart sequence.
- Emergency labor: Corrective work may require overtime, extra supervision, and technicians removed from planned jobs.
- Expedited spares: The plant may pay more to move a bearing, seal, coupling, or gearbox component quickly.
- Downstream effects: A stopped conveyor or pump can starve the next process step and widen the stoppage.
- Lost planning time: The crew abandons scheduled work while diagnosing an unknown failure.
Reliability teams should compare intervention cost with the cost of uncertainty. A route-based vibration reading can identify developing bearing damage. Gearbox oil analysis can reveal wear debris or lubricant problems. A continuous motor temperature trend can show deterioration between inspection routes. The benefit appears only when that evidence changes the plan: stage the part, arrange isolation, assign the right craft, and select a controlled outage.
Use mean time between failure, or MTBF, as one baseline for tracking average operating time between functional failures. Teams establishing that baseline can use this MTBF calculation resource with downtime hours and failure-mode records. MTBF alone does not explain risk, since a few high-consequence failures can matter more than frequent minor stops.
Practical rule: Condition monitoring earns its place when it changes the work order, repair timing, or intervention scope.
The same discipline should influence equipment design. Engineers evaluating access, maintainability, modular replacement, and component interchangeability can use design criteria for modular systems to make future inspection and repair more practical before equipment reaches the plant floor.
What Condition Monitoring Actually Does
Condition monitoring is a decision system, not a collection of sensors. It observes machine condition, detects a meaningful change, analyzes the evidence, diagnoses a likely failure mode, estimates the need for intervention, and routes that conclusion to maintenance or operations.
ISO 17359:2018 provides a general framework for condition monitoring of machine systems and covers parameters including vibration, temperature, tribology, flow, contamination, power, and speed. Tribology means the study of friction, wear, and lubrication. These parameters matter because no single measurement describes every failure.
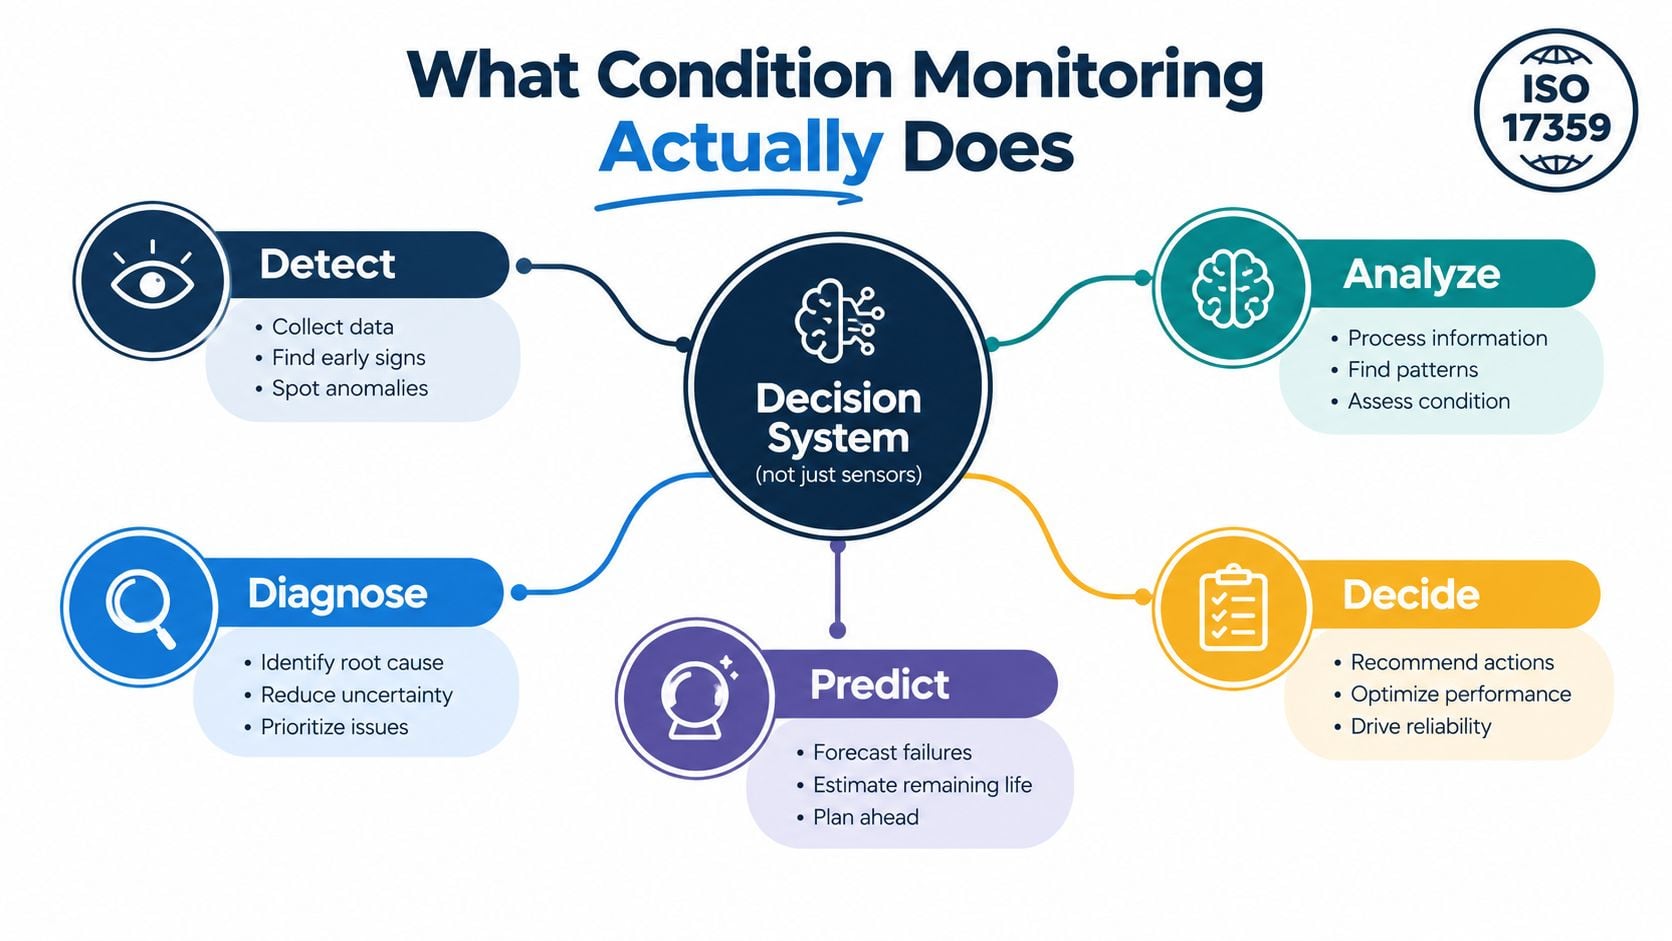
Reading a pump bearing before failure
Consider an inboard bearing on a centrifugal process pump. An outer-race defect can develop gradually, and its detectable signature changes as damage progresses.
- Detect: A high-frequency vibration or acoustic signal changes from the established baseline.
- Analyze: The analyst compares the time waveform, spectrum, speed, load, and operating condition.
- Diagnose: Bearing defect frequencies, sidebands, and directional response support a conclusion such as outer-race damage rather than simple imbalance.
- Predict: The team assesses whether the trend is stable, accelerating, or approaching a planned intervention limit.
- Decide: Maintenance schedules a bearing replacement, verifies the spare, prepares the job plan, and confirms the operating window.
Temperature can reveal lubrication loss or increasing friction. Vibration can expose imbalance, looseness, misalignment, and bearing or gear damage. Lubricant analysis can identify wear debris, contamination, viscosity change, or additive depletion. Flow and power can show process or load changes that explain why mechanical condition is shifting.
Condition monitoring differs from predictive maintenance, which uses condition information and degradation behavior to forecast when action should occur. It also differs from a route inspection. A route provides periodic observations, while a decision system determines what a change means and what a person should do next. A practical overview of condition monitoring systems helps distinguish the sensing layer from the workflow that creates value.
Quantifiable Benefits and the KPIs That Track Them
A condition monitoring program earns support when each benefit connects to a failure mode and a measure that maintenance and operations already use. “Better reliability” is too vague. Track whether bearing wear, lubrication breakdown, electrical faults, or gear damage result in fewer emergency interventions and less lost production.
Reported implementation outcomes provide a reference point, not a guarantee. The Siemens report associates condition monitoring and predictive maintenance at scale with an 85% improvement in downtime forecasting accuracy, a 50% reduction in unplanned machine downtime, a 55% increase in maintenance staff productivity, and a 40% reduction in maintenance costs. A separate Baker Hughes paper reports plant studies showing a 50% reduction in maintenance costs, a 55% reduction in unplanned machine failures, a 60% reduction in MTTR, a 30% reduction in spare-parts costs, and a 30% increase in machinery life and availability. See the Siemens report and Baker Hughes paper for the cited studies.
| Benefit | Failure mode and diagnostic method | KPI to track |
|---|---|---|
| Downtime reduction | Bearing wear, misalignment, or gear damage identified through vibration, ultrasound, or oil analysis | Unplanned downtime hours per critical asset |
| Maintenance cost reduction | Lubrication breakdown or recurring looseness identified through oil analysis, vibration, or thermography | Corrective wrench hours and cost per unit produced |
| Shorter MTTR | Unclear failure scope or secondary damage reduced through cross-validated diagnosis | Average repair time and first-time-fix rate |
| Longer machinery life | Progressive wear, contamination, or lubrication faults identified through oil analysis and vibration trending | Overhaul-to-replacement ratio and asset availability |
The KPI must follow the work order, not stop at the alert. Record whether an alert became planned work, whether technicians had the correct diagnosis before teardown, and whether the same failure mode returned. This distinguishes useful detection from a noisy monitoring system.
Program maturity changes the expected return. A new route-based program may first show better inspection coverage and fewer missed defects. A more mature program should demonstrate planned repairs, shorter outages, controlled spare-parts use, and fewer repeat failures. Compare each asset with its own baseline, then review production impact with operations. Use this reliability metrics guide covering MTBF, MTTR, and OEE to align the measures across maintenance and operations.
How Each Diagnostic Technique Delivers Specific Benefits
Diagnostic methods work best when selected against a failure mode, not purchased as a uniform package. A cement plant's pump, kiln drive, electrical cabinet, and conveyor gearbox don't degrade in the same way. The monitoring method must match the physics of the defect.
| Technique | Primary Failure Modes Detected | Best-Fit Asset | Key Strength | Practical Limitation |
|---|---|---|---|---|
| Vibration analysis | Bearing defects, imbalance, misalignment, looseness, gear mesh damage | Pumps, motors, fans, gearboxes | Provides detailed frequency and severity information | Can be difficult on slow-speed, variable-speed, or poorly accessible assets |
| Oil analysis | Wear debris, contamination, viscosity change, gear scuffing, lubrication breakdown | Large gearboxes, hydraulic systems, lubricated compressors | Reveals internal wear and lubricant condition | Sampling quality and laboratory turnaround affect response time |
| Infrared thermography | Electrical hot spots, poor connections, overloads, insulation problems, refractory hot spots | Switchgear, motor terminals, kiln systems | Finds abnormal heat without physical contact | Load and environmental conditions can distort comparisons |
| Ultrasound | Steam trap failure, compressed-air leakage, lubrication issues, early bearing defects | Utility systems, bearings, valves, pneumatic equipment | Works well for high-frequency and low-energy signals | Interpretation depends heavily on operator technique and background noise |
| Motor current signature analysis | Broken rotor bars, stator winding faults, air-gap eccentricity | Induction motors and motor-driven trains | Assesses electrical and mechanical condition without touching the motor | Load variation and drive configuration can complicate the signature |
Vibration analysis remains the primary method for a pump bearing with a known running speed and accessible measurement point. Oil analysis becomes more valuable when a raw mill gearbox has internal wear that hasn't yet produced a strong external vibration signature. Thermography can expose a loose motor termination that a mechanical route would miss.
Ultrasound also has a distinct role. A technician can identify a leaking compressed-air connection or a failing steam trap without waiting for a large temperature change. On bearings, airborne or structure-borne ultrasound may reveal early friction or lubrication changes before conventional spectral bands become decisive.
For electrical inspections, motor current signature analysis, or MCSA, evaluates current waveform behavior to identify rotor, stator, and air-gap problems. It complements vibration rather than replacing it. A mechanical coupling defect may be clearer in vibration, while an electrical rotor issue may be more visible in current data.
Technicians selecting infrared equipment should understand emissivity, reflected temperature, focus, field of view, and load conditions. A practical thermal imaging camera guide can help establish the inspection fundamentals, but a reliable program still needs repeatable measurement points and clear escalation rules.
Route Versus Continuous Monitoring and How Data Becomes Decisions
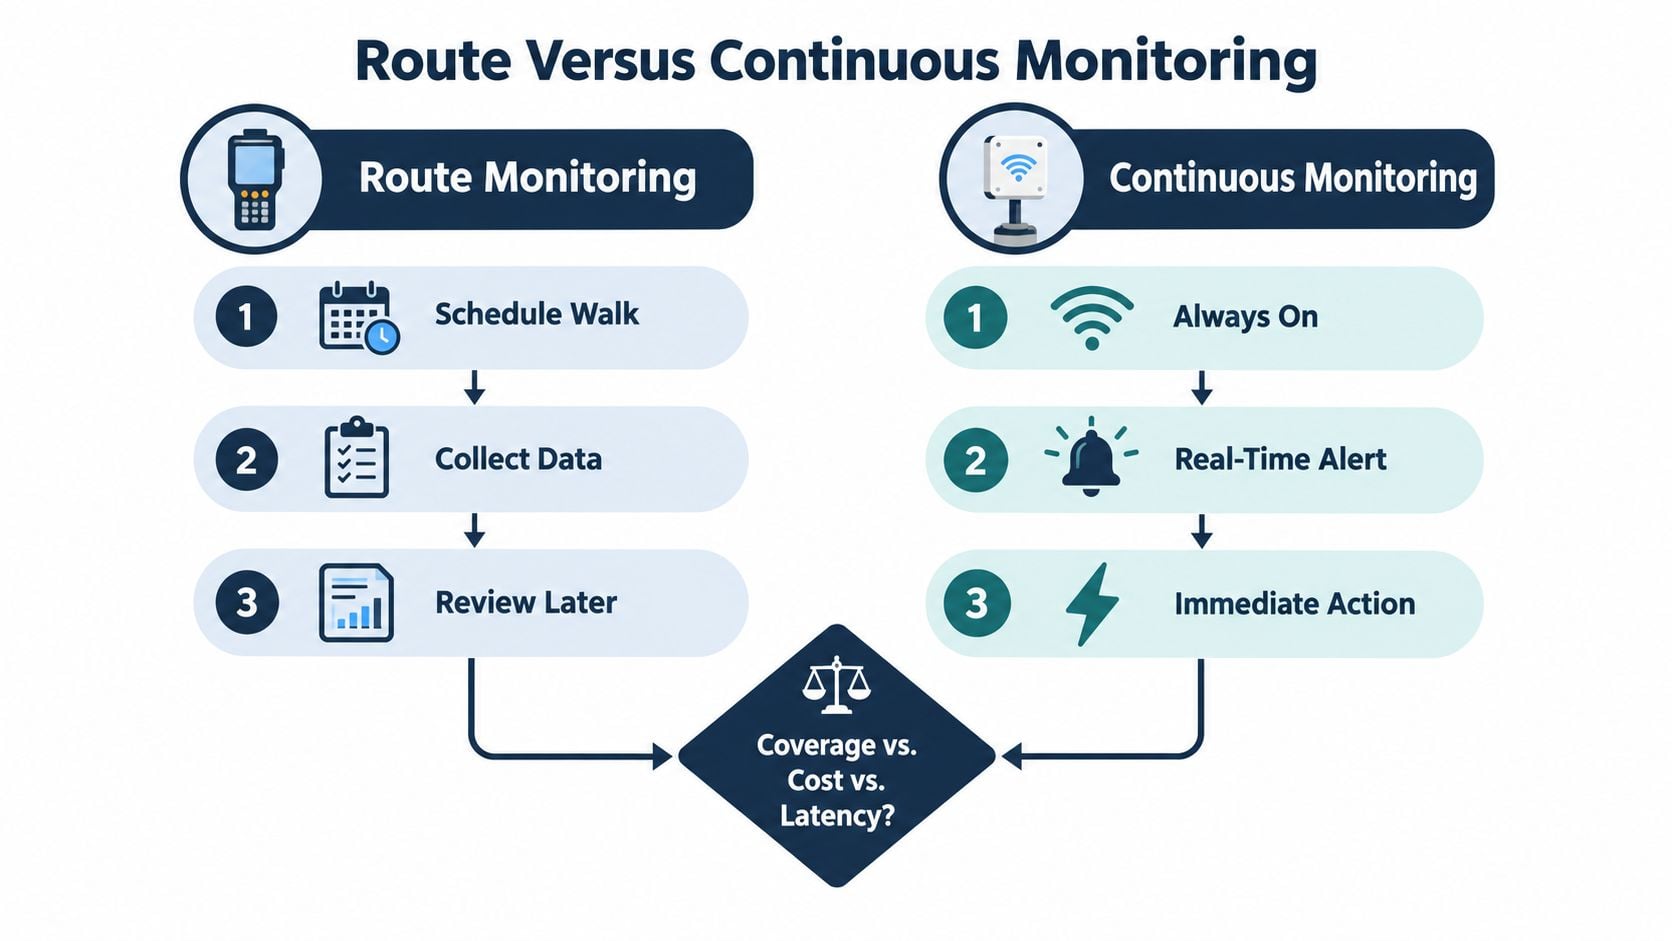
Route and continuous monitoring solve different operational problems. A handheld route is efficient when a plant has many lower-criticality assets, stable operating patterns, and enough staff to collect and review readings. Continuous monitoring is justified when failure consequences are severe, failure progression is fast, or the asset operates in a location that technicians can't inspect frequently.
| Decision factor | Route-based monitoring | Continuous monitoring |
|---|---|---|
| Coverage | Broad population coverage through scheduled visits | Focused coverage on selected critical assets |
| Cost | Lower installed cost, higher dependence on labor and discipline | Higher installation and data-management requirement |
| Decision latency | A fault may be found during the next route | A changing condition can generate an immediate alert |
| Best fit | Fans, auxiliary pumps, utility equipment, accessible assets | Critical compressors, large motors, gearboxes, and pump trains |
| Main risk | The defect progresses between inspections | Alert volume exceeds the team's ability to act |
A cement plant might use handheld vibration, ultrasound, and thermal routes for auxiliary equipment while applying continuous monitoring to a raw mill drive or critical compressor. The choice should follow criticality, failure development speed, access, operating variability, and the cost of a missed event.
Turning signals into work
Alarm thresholds need context. Teams can establish baseline behavior, define severity zones, and account for speed, load, process state, and time in alarm. Static limits that ignore operating condition create nuisance alerts, while limits set too loosely delay action.
A useful workflow is:
- Detect: Identify a meaningful deviation from the asset baseline.
- Validate: Check operating state, sensor health, recent work, and process changes.
- Diagnose: Compare spectra, trends, phase, temperature, oil condition, or electrical data.
- Prioritize: Assign severity based on consequence, progression, and available operating margin.
- Execute: Create a CMMS work order with evidence, job scope, parts, and recommended timing.
The CMMS should receive the validated event with the trend chart, spectrum, thermal image, or oil result attached. Otherwise, the data lake becomes storage rather than a maintenance system. Teams evaluating forecast-based intervention can also use a remaining useful life resource to connect degradation trends with planning decisions.
Industry and Equipment Examples of the Benefits in Practice
A chemical plant's ANSI process pump train illustrates the value of combining methods. Weekly vibration routes can identify a developing bearing defect, while periodic oil sampling checks for contamination and wear debris. If the evidence is strong, planners can stage the bearing and schedule the repair during a controlled operating window instead of waiting for a seizure during production.
The diagnostic decision matters more than the alert itself. A technician who receives a likely inner-race defect, a confirmed measurement point, and the required bearing specification can prepare differently from a technician assigned to “investigate pump noise.” The first work order supports a planned repair. The second often begins with open-ended troubleshooting.
A motor-driven centrifugal compressor presents a different problem. Continuous vibration can reveal coupling misalignment or changes in bearing condition, while MCSA can identify developing rotor-bar or stator issues without removing the motor from service. When the two data sets support the same diagnosis, operations can bring forward a maintenance window and avoid allowing a mechanical or electrical defect to become a high-consequence event.
At a cement facility, a raw mill conveyor gearbox may need a combination of ultrasound and oil analysis. Ultrasound can identify abnormal friction or lubrication behavior during a route. Wear-debris analysis can then show whether internal gear or bearing surfaces are generating particles. The plant may adjust lubrication practice, inspect alignment, stage components, or defer a full overhaul until a planned outage, depending on the evidence.
A condition report creates value only when it changes the next maintenance decision.
These examples also show why no single technique provides complete coverage. The pump benefits from vibration and lubricant evidence. The compressor needs mechanical and electrical diagnostics. The conveyor gearbox depends on both acoustic observation and internal wear information.
Common Pitfalls That Quietly Erase the Benefits
More sensors don't automatically produce more savings. Low-maturity programs often collect abundant data while leaving diagnosis, planning, and execution disconnected.
| Pitfall | Root Cause | Corrective Action |
|---|---|---|
| Threshold fatigue | Static alarm limits aren't adjusted for speed, load, baseline, or machine changes | Re-baseline after repair and use time-in-band logic |
| Alarm floods | Every deviation receives the same urgency | Suppress nuisance alerts and escalate by severity and consequence |
| Data silos | Vibration, oil, electrical results, and work orders sit in separate systems | Attach validated evidence and recommendations to the CMMS job |
| Coverage gaps | Vibration alone is applied to slow-speed, static, electrical, or utility assets | Add oil analysis, thermography, ultrasound, process, or power measurements |
| Skill gaps | Analysts lack the training to interpret cross-spectrum, acoustic-emission, or MCSA data | Define competency requirements and provide qualified review support |
Threshold fatigue damages trust first. When a pump produces repeated alerts that never lead to a finding, operators learn to ignore the alarm. That weakens response time and can increase unplanned downtime even while the monitoring dashboard shows high utilization.
Data silos create a different failure. An analyst may identify a gearbox defect, but if the work order doesn't include the spectrum, severity, and recommended action, the planner has to recreate the context. The repair can then be delayed by uncertainty, parts availability, or a competing priority.
Coverage gaps distort KPI results. A team may report good vibration-route completion while missing electrical hot spots, contaminated oil, steam leakage, or slow-speed gear damage. The correction is not to install sensors everywhere. It is to map failure modes to detection methods and measure whether each critical failure mechanism has a credible path to detection.
Building a Program That Actually Pays Off
Return on investment depends on the weakest link in the reliability chain, not the number of sensors installed. A plant with strong preventive maintenance, disciplined routes, capable analysts, and CMMS integration can gain value from targeted continuous monitoring. A plant without those foundations may create a sensor-rich, decision-poor program.
A practical maturity path looks like this:
- Reactive: The plant repairs failures after they occur. The primary KPI is emergency downtime, with bearing seizure and gearbox breakage as typical consequences.
- Preventive: The plant performs calendar-based inspections and replacements. The KPI is PM compliance, but over-maintenance and missed condition changes remain possible.
- Route-based predictive: Technicians collect vibration, oil, ultrasound, or thermal data and convert findings into planned work. The KPI is unplanned downtime per critical asset.
- Continuous predictive: Selected assets stream condition data into diagnostics and the CMMS. The KPI is the percentage of validated alerts converted into timely, successful work.
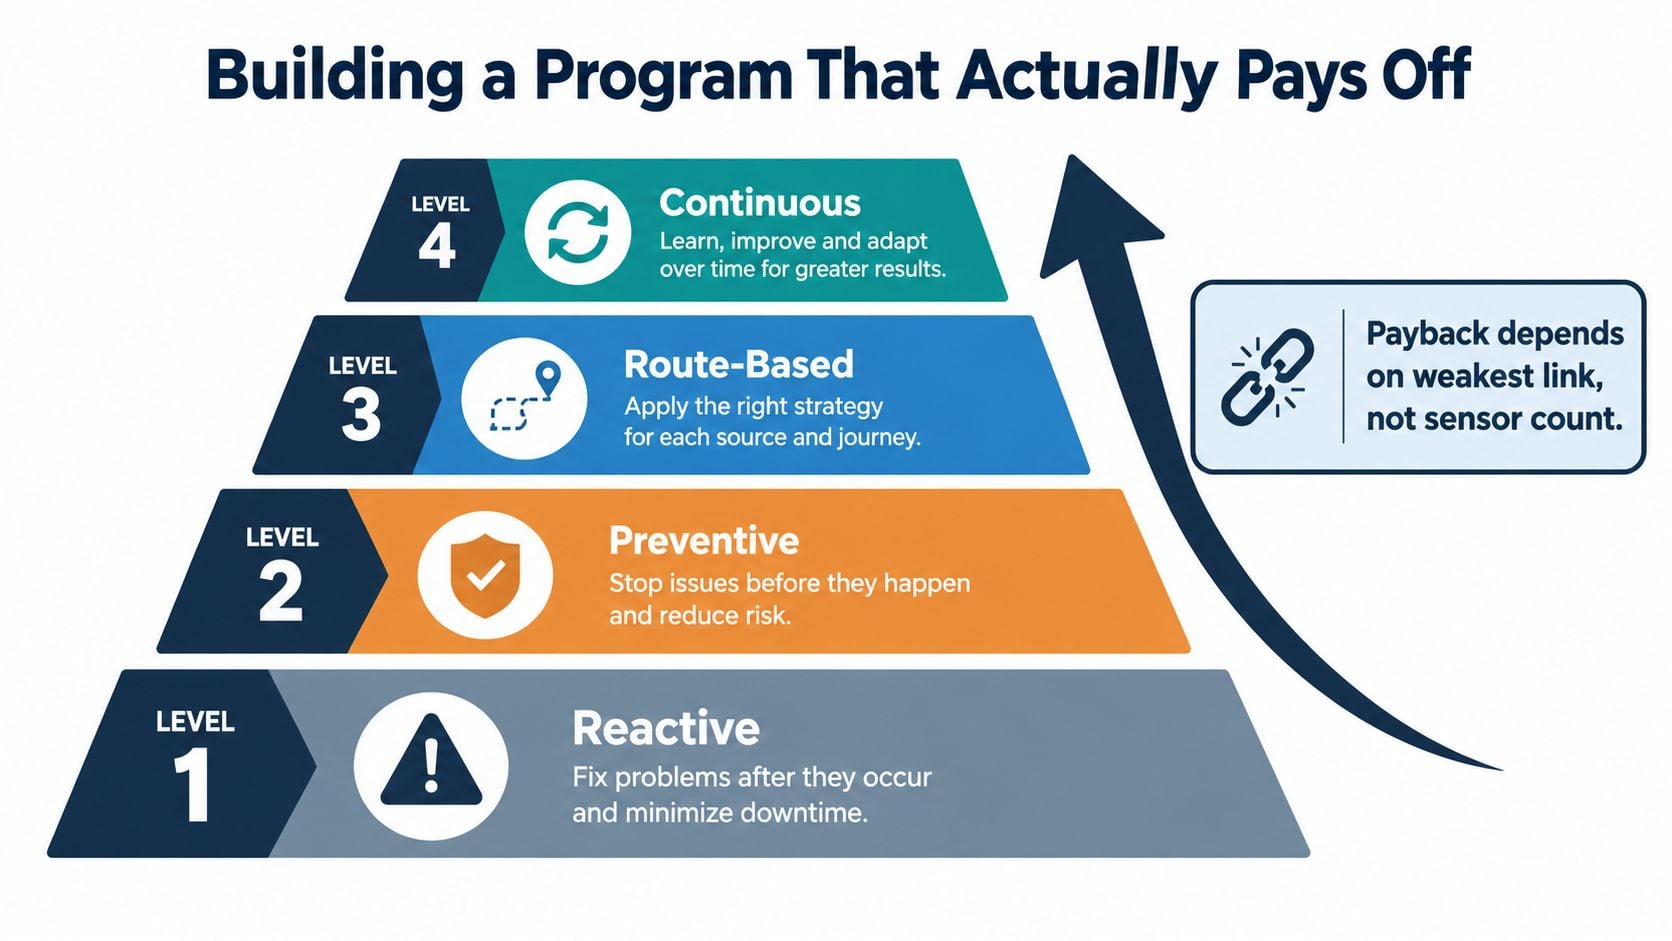
The gates between stages are practical. The plant must control alarm quality, close data silos, cover the relevant failure modes, and build analyst capability before expanding coverage. Guidance on maintenance cost reduction strategies can complement this work, but the program still needs plant-specific criticality ranking and failure-mode analysis.
FAQ
Should a plant use monthly routes or daily continuous monitoring? Use route monitoring where failure progression is slow and access is easy. Use continuous monitoring where consequence and decision latency justify permanent coverage.
How does a team know whether it's ready? The team should have defined critical assets, reliable measurement points, clear alarm ownership, capable analysis, and a CMMS process that turns validated findings into planned work.
Forge Reliability offers a free reliability assessment that reviews critical assets, failure modes, monitoring coverage, alarm quality, and the connection between condition data and CMMS execution. Visit Forge Reliability to identify whether a plant needs better route discipline, additional diagnostic coverage, or a more mature continuous monitoring workflow.