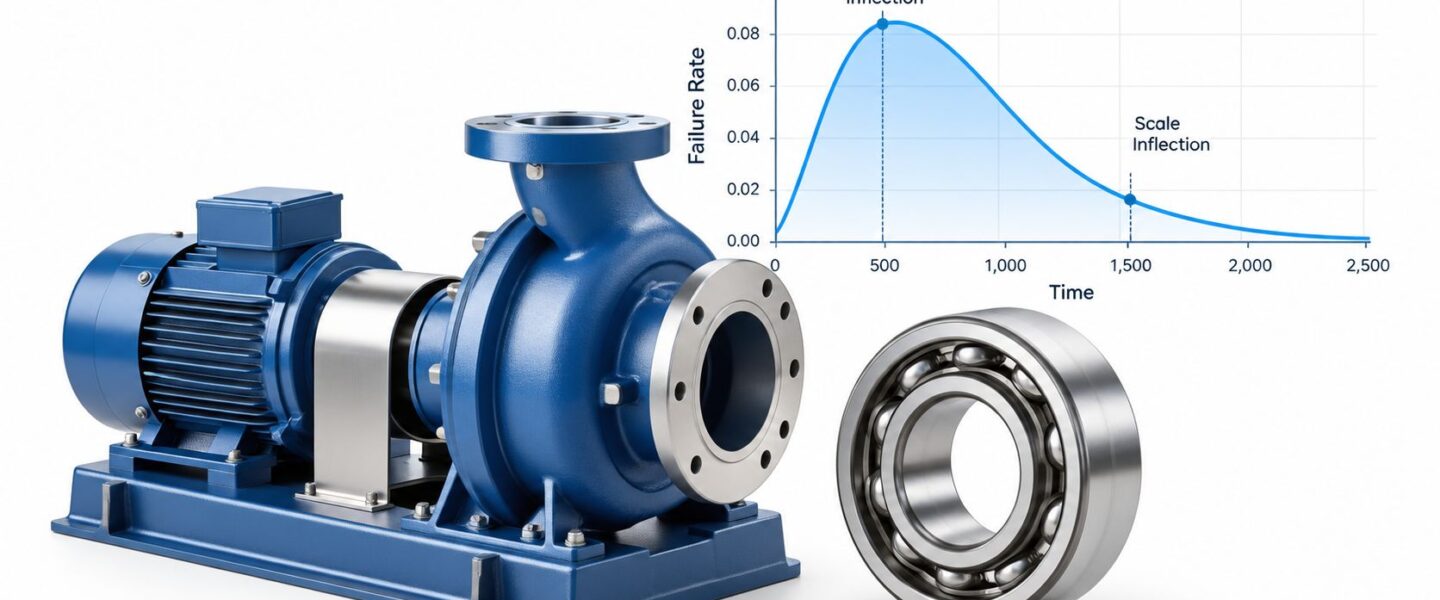
A pump fails during a production run, the CMMS records “seal replaced,” and the maintenance planner moves the next replacement date forward. The same pattern repeats, even though the pump's seals aren't necessarily reaching the end of their useful life. A different pump may be suffering from bearing fatigue, yet both assets receive the same calendar-based treatment because their failure records sit in one undifferentiated dataset.
The Weibull distribution curve helps separate those problems. It turns time-to-failure records into a practical view of how failure risk changes with age, but the calculation is only as credible as the data behind it. If installation defects, contamination, bearing fatigue, and planned removals are mixed together, the resulting curve can recommend an interval that addresses none of the actual causes.
Table of Contents
- Moving Beyond Arbitrary Preventive Maintenance
- Decoding Shape and Scale Parameters
- Data Preparation and Probability Plotting
- Applying Weibull to Rotating Equipment
- Optimizing Spare Parts and Maintenance Intervals
- Next Steps for Plant Reliability
Moving Beyond Arbitrary Preventive Maintenance
A centrifugal pump can fail during a production run while its maintenance history records only “seal replaced.” The planner then advances the next replacement date, even though the seal may not have reached the end of its useful life. A similar pump may be developing bearing fatigue, yet both assets receive the same calendar-based treatment because their records sit in one undifferentiated dataset.
Operating conditions make that schedule even less reliable. A pump handling clean process fluid at steady load faces different stresses from one exposed to cavitation, pipe strain, temperature cycling, or frequent starts. Applying one replacement interval to both creates the appearance of control while ignoring how each asset fails.
A Weibull analysis replaces that assumption with a practical question: does failure probability rise, fall, or remain broadly stable as the asset ages? The answer helps maintenance teams choose between correcting early-life problems, monitoring equipment condition, and planning age-based intervention.
NIST describes Weibull as a flexible two-parameter life model and identifies the scale parameter as characteristic life in its Weibull model reference. The analysis uses operating time and failure status to describe a defined population. It should not treat every work order as proof that an age limit has been reached.
The failure pattern matters more than the calendar
A decreasing failure rate often points to problems that occur early in an asset's life. Installation errors, commissioning mistakes, and inadequate lubrication can produce this pattern. More frequent replacement will not remove those causes. Quality checks, acceptance testing, precision alignment, and early-life screening address the mechanism more directly.
A roughly constant failure rate describes random failures. External events, unpredictable disturbances, or mechanisms with little dependence on age may produce this behavior. Scheduled replacement based only on elapsed time has weak support here because a new component can face the same exposure as an older one.
An increasing failure rate supports a different strategy. Bearing fatigue, insulation aging, erosion, corrosion, and seal degradation are examples of wearout mechanisms. Condition monitoring, refurbishment planning, and age or risk-based intervention become more defensible when evidence shows that age is contributing to risk.
Practical rule: A PM interval should follow the dominant failure mechanism, not the date printed on the previous work order.
Use the curve to improve the maintenance question
The curve does not set maintenance policy by itself. Reliability engineers must check whether fitted behavior agrees with vibration results, oil analysis, thermography, ultrasound, motor-current signatures, inspections, and failure reports. The model is most useful when it narrows the investigation and exposes a mismatch between the current PM schedule and actual failure behavior.
Start by reviewing the plant's mean time between failure calculation alongside failure-mode-specific records. MTBF can summarize performance, but it cannot show whether risk decreases, remains constant, or increases with age. The Weibull shape parameter adds that diagnostic view only when the underlying population is coherent. Mixing seal contamination, bearing fatigue, and planned removals can distort the fitted curve and produce a schedule that addresses none of them.
For plant leaders, the operational value is direct. A credible analysis can redirect labor from unnecessary tear-downs toward installation quality, condition monitoring, or targeted refurbishment. An unreliable analysis can institutionalize waste by shortening intervals while leaving the original failure mechanism untouched.
Decoding Shape and Scale Parameters
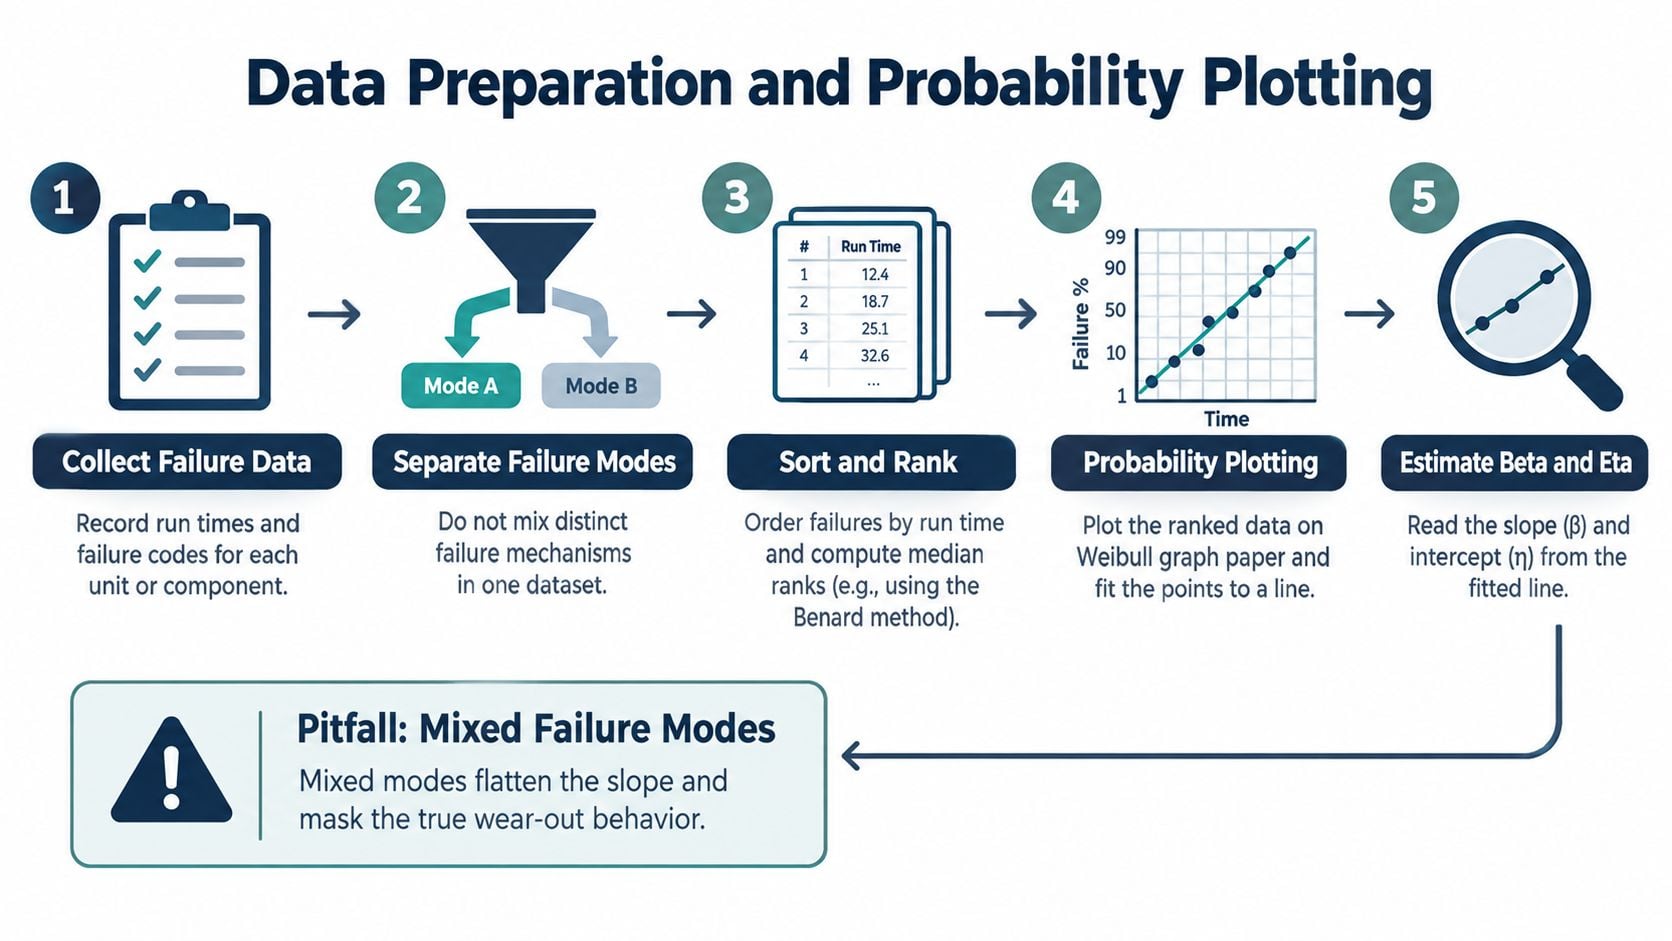
A Weibull curve becomes useful only when its parameters lead to a defensible maintenance action. The two parameters are beta, written as β, and eta, written as η. Beta describes how the hazard rate changes with age. The hazard rate is the instantaneous likelihood of failure at a given age, provided the asset has survived to that point. Eta sets the time scale for the fitted population.
For the two-parameter model, reliability is:
[
R(t)=exp[-(t/eta)^beta]
]
Cumulative failure probability is:
[
F(t)=1-R(t)
]
The instantaneous failure rate is:
[
h(t)=frac{beta}{eta}(t/eta)^{beta-1}
]
These equations connect statistical behavior with a maintenance decision. Reliability at a proposed intervention age can be estimated instead of assumed, while beta indicates whether replacement, process correction, or condition monitoring is likely to address the observed risk.
Beta is the diagnostic fingerprint
When β < 1, the hazard decreases with age. The population is showing infant mortality, with failures concentrated early because of installation defects, manufacturing variation, commissioning errors, inadequate break-in, or other early-life problems. Investigate torque practices, alignment, lubrication, contamination control, acceptance testing, and commissioning records. Shortening the replacement interval treats an installation or commissioning problem as wearout.
When β = 1, the Weibull model becomes exponential and the hazard is constant. Age alone provides little basis for replacement. Investigate external causes, improve failure detection, strengthen protective systems, or apply condition monitoring where a detectable precursor exists.
When β > 1, hazard increases with age. This pattern is consistent with wearout mechanisms such as bearing fatigue, insulation aging, erosion, corrosion, and seal degradation. Planned refurbishment or replacement may be appropriate when inspections, monitoring, and teardown evidence confirm physical deterioration.
Interpret beta alongside the asset and failure mode. The equipment failure pattern guide helps connect statistical behavior with practical failure-pattern thinking, but a beta value is not a universal label. A curve fitted to mixed mechanisms can produce a confident-looking parameter with little maintenance value.
Eta defines the population time scale
The scale parameter η, called characteristic life, is the time at which 63.2% of a population has failed, because (F(eta)=1-e^{-1}). It is a reference point for the fitted population, not a guaranteed replacement age. An asset should not be removed automatically when it reaches η.
Engineers can combine beta and eta to estimate reliability at a planned intervention age and derive life measures such as B10 life, the time by which 10% of the population is expected to have failed. Those results depend on how the population was defined. Pumps with different duty cycles, fluids, loads, or failure mechanisms should not be pooled just because they share an equipment tag.
A practical interpretation sequence is:
- Check beta first. Determine whether the hazard decreases, remains broadly constant, or increases.
- Confirm the failure mode. Establish whether the records represent one mechanism or several competing mechanisms.
- Use eta as a scale, not a command. Combine it with reliability targets, consequence of failure, inspection capability, and uncertainty.
- Validate the result physically. Compare the fitted behavior with condition-monitoring evidence and teardown findings.
A mathematically neat curve can still produce a poor maintenance decision when unlike populations are combined. Parameter values describe the records supplied to the model, not every asset in the plant. The most expensive error is often a mixed failure population that makes an ineffective preventive-maintenance interval appear statistically justified.
Data Preparation and Probability Plotting
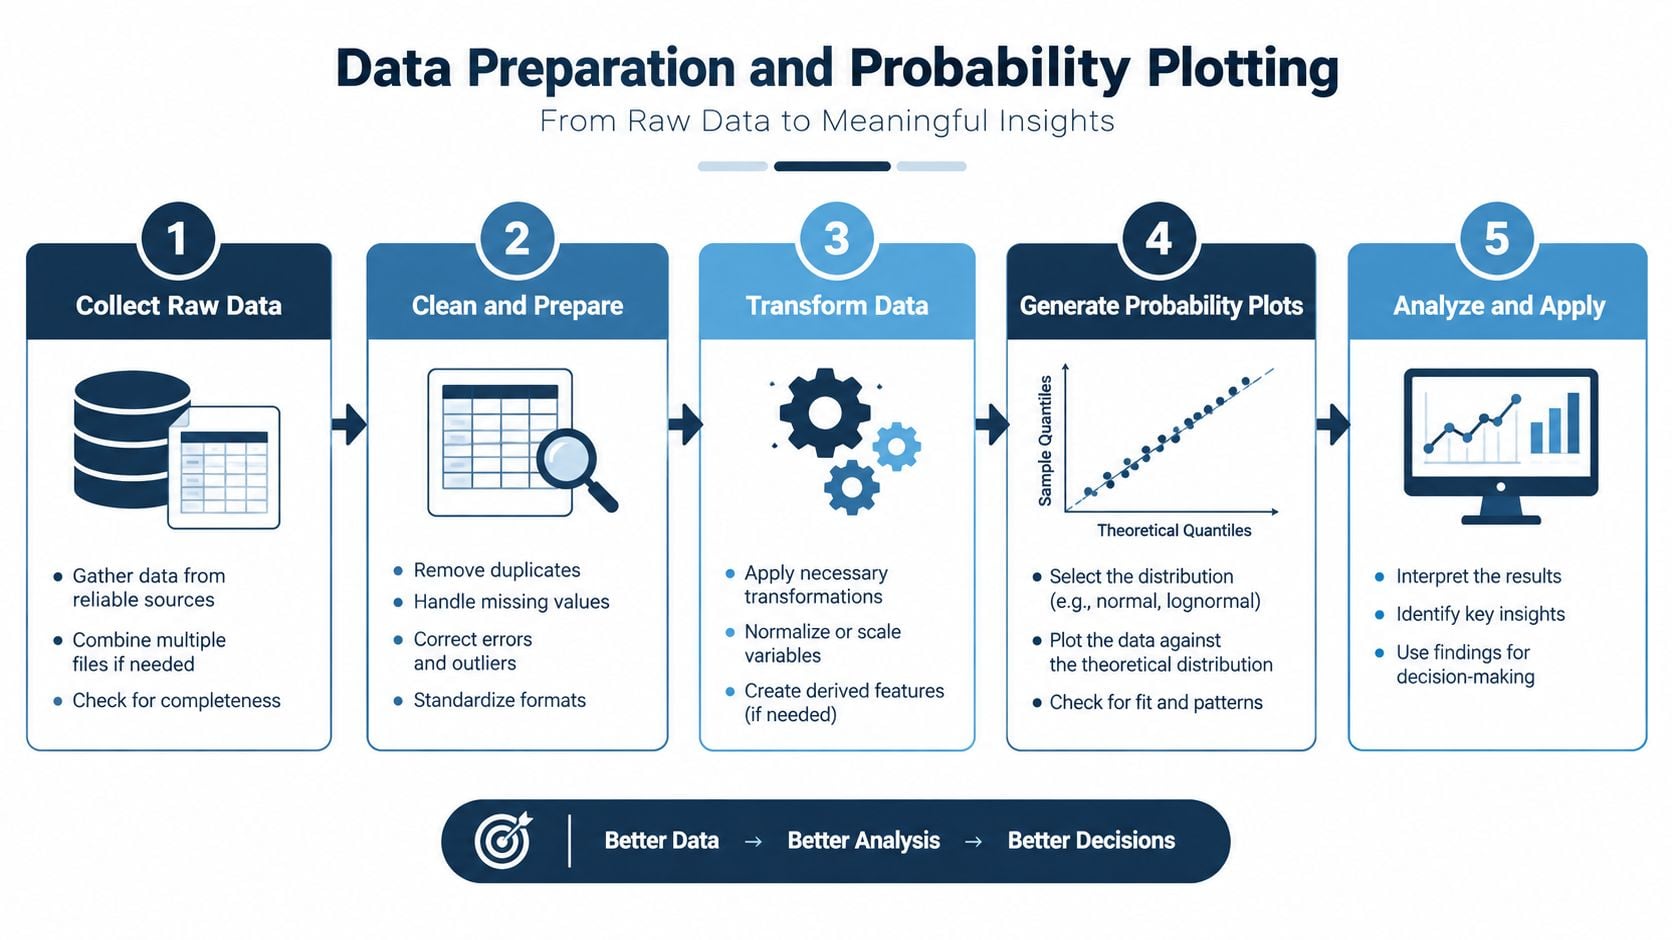
A pump population can produce a convincing Weibull line and still support the wrong maintenance decision. A planner may export every failure transaction, remove the descriptive fields, and fit one curve. The records could include seal leaks caused by installation errors, bearing fatigue related to operating hours, impeller erosion caused by process chemistry, and planned removals that were never failures. One slope cannot represent those mechanisms reliably.
Weibull analysis can describe situations in which competing failure mechanisms determine which event occurs first. The observed lifetime may therefore be the minimum of several approximately comparable failure times. Pooling the records can hide the mechanism that maintenance needs to correct, while producing parameters that appear precise enough to justify an ineffective schedule.
Build a failure-mode-specific population
The CMMS record needs more than a component name and work-order close date. Capture operating time, asset identity, failure mode, corrective or planned status, and the conditions that define exposure. For an electric-motor bearing population, useful distinctions include lubrication breakdown, contamination, misalignment, electrical fluting, and fatigue.
Plant evidence supports the classification:
- Vibration spectra can distinguish bearing defect activity, imbalance, looseness, and misalignment.
- Oil-particle analysis can identify contamination, abnormal wear debris, and lubricant degradation.
- Thermography can reveal abnormal electrical or mechanical heating.
- Shaft-alignment measurements can test whether repeated coupling or seal failures relate to installation.
- Motor-current signatures can provide further evidence of electrical and mechanical abnormalities.
Review the work history with the failure mechanism in mind. A pump removed during an overhaul has not necessarily failed at that operating time. Coding that removal as a failure shortens the estimated life and can push the maintenance interval toward unnecessary replacements.
Preserve censored observations
A right-censored observation is an asset still operating when the study ends or the data extract closes. Its eventual failure time is unknown, but survival through the last recorded operating time remains useful evidence. Removing the asset, or coding it as a failure, biases estimated life downward.
Maximum-likelihood methods can estimate Weibull parameters, reliability functions, and percentiles while incorporating right-, left-, and interval-censored observations. The reliability documentation for censored life data also describes confidence intervals for parameters and reliability values. That uncertainty matters when failures are rare or the sample is small. A point estimate may look precise even when the plausible range is wide.
Read curvature as a warning
A Weibull probability plot converts lifetime data into an approximately straight line. With complete failures, the fitted slope estimates β and the horizontal intercept estimates η. Systematic curvature deserves investigation. It may indicate mixed failure modes, changing operating conditions, competing risks, or an unsuitable distribution.
Use a controlled workflow:
- Define the population. Separate asset class, duty cycle, service conditions, and failure mechanism.
- Record exposure correctly. Use operating hours or another meaningful time basis, rather than calendar ownership alone.
- Mark censoring status. Retain units operating at the end of the study.
- Fit and inspect the plot. Look for curvature, multiple slopes, and implausible residual behavior.
- Attach uncertainty. Report confidence intervals with reliability estimates before changing maintenance intervals.
Separate the populations before fitting whenever the physical evidence supports different mechanisms. Then compare the fitted results with inspection findings, operating conditions, and work-order details. Software can speed the calculation, but it cannot repair poor classification. Weibull analysis software is useful for testing populations, comparing stratifications, and documenting assumptions, rather than producing an isolated beta value.
Applying Weibull to Rotating Equipment
A process plant centrifugal pump provides a clear example of why failure-mode separation matters. The pump may have recurring mechanical seal leaks and a separate population of main-bearing failures. Both events stop production, but they don't arise from the same physical process and shouldn't automatically share a Weibull curve.
Suppose the seal records, after review, produce β = 0.7. That value is an example of decreasing hazard, not evidence that the seals are wearing out faster than expected. The maintenance team should examine installation quality, shaft alignment, pipe strain, contamination, seal-face handling, flush conditions, and commissioning acceptance. Replacing the seal earlier without correcting those conditions would consume parts and labor while preserving the cause of failure.
NASA's reliability-centered-maintenance guidance documents the use of Weibull shape factors for failure behavior and fatigue-related probability. Its practical implication for this pump is consistent with the reliability-centered-maintenance guidance: if repeated centrifugal-pump seal failures produce β < 1, installation-quality checks, alignment verification, and root-cause elimination should take priority over merely shortening the replacement interval.
One pump, two maintenance policies
The main-bearing records may tell a different story. Suppose the bearing population produces β = 2.5, an example of increasing hazard consistent with wearout. The team can then justify a more structured intervention policy, provided vibration trends, oil analysis, temperature history, and teardown evidence support fatigue or related age-driven deterioration.
| Beta value | Dominant failure mode | Optimal maintenance strategy |
|---|---|---|
| β < 1 | Infant mortality from installation, manufacturing, or commissioning defects | Improve quality control, acceptance testing, alignment, lubrication, contamination control, and early-life screening |
| β = 1 | Roughly constant random failures | Avoid arbitrary age replacement; investigate external causes and use condition monitoring or failure-finding where appropriate |
| β > 1 | Wearout such as bearing fatigue, insulation aging, erosion, corrosion, or seal degradation | Use condition monitoring, risk-based intervention, refurbishment, or age-based replacement when supported by evidence |
The bearing strategy should still account for load, lubrication condition, contamination, and operating regime. A high beta doesn't prove that every bearing reaches a predictable end of life. It shows that the analyzed population has an increasing hazard trend that may support planned intervention.
The common causes of bearing failure provide a useful diagnostic frame before a plant labels a bearing problem as simple fatigue. If records show that contamination or misalignment dominates, the corrective action may be different even when the equipment is old.
A Weibull curve should separate decisions for the seal and the bearing, not average their failures into one convenient interval.
Optimizing Spare Parts and Maintenance Intervals
Weibull results earn their place in a maintenance program when they change a parts, labor, or risk decision. B10 life marks the time by which 10% of the population is expected to have failed. Use it to set planning thresholds, not as a guarantee that every remaining unit will operate safely until that point.
For example, a B10 estimate of 40,000 operating hours and a 12-week replenishment lead time could support an order point near 34,000 hours, provided the exposure basis and uncertainty are credible. That decision still depends on stock commonality, repair options, and the consequence of an unavailable component. A cooling-water pump may justify local repair coverage, while a pump feeding a continuous process may require a spare on site or expedited procurement.
Don't hide uncertainty behind one number
A single life estimate can create false confidence when the sample is small, failures are rare, or records combine different mechanisms. A 90% reliability estimate may have a wide uncertainty band. In that situation, replacing equipment aggressively can cost more than the risk it reduces.
Set the interval and parts policy around the decision exposure:
- Order-point exposure: Compare the lower credible life estimate with supplier lead time, transport delays, and the number of interchangeable units. Stock decisions should protect the plant against uncertainty during replenishment.
- Intervention economics: Compare planned replacement labor, outage time, and part cost with the expected consequence of functional failure. A statistical wearout signal does not automatically justify replacing every unit at the same age.
- Failure-mode separation: Calculate the policy for one physical mechanism at a time. Mixing seal leakage, bearing fatigue, lubrication loss, and installation defects can produce a misleading B10 value and an ineffective PM interval.
- Condition evidence: Use vibration, oil condition, temperature, ultrasound, or motor-current trends when those signals can reveal deterioration before failure. Monitoring can support deferred replacement, but only when response limits and labor ownership are defined.
- Confidence limits: Review uncertainty around the fitted parameters and selected life measure before committing cash to stock or scheduling a shutdown. Wider limits call for contingency stock, shorter review cycles, or better data collection.
Match monitoring to hazard behavior
Early failures often point to installation, commissioning, contamination, or workmanship problems. Correct those controls before adding age-based replacement. A roughly constant failure pattern calls for attention to external causes and failure-finding tasks. Increasing hazard can support condition-based intervention when the monitored signal corresponds to the analyzed failure mode.
A remaining-useful-life estimate is a decision aid, not a guarantee. The remaining useful life guidance is most useful when condition data are combined with failure history, operating context, and a defined failure mechanism.
Maintenance governance also needs clear ownership for inspection, planning, documentation, and response. Bridge Global maintenance support offers relevant context for organizing those activities. Keep the model connected to the CMMS, inspection routes, reorder rules, and shutdown schedule so a statistical result becomes an executable plant decision.
Next Steps for Plant Reliability
A Weibull program succeeds when reliability engineers, planners, operators, and technicians agree on what constitutes a failure. The analysis should begin with the assets that matter most to production or safety, then trace each record back to the physical mechanism rather than relying on a generic component label.
A quick-start review can use this sequence:
- Rank critical assets: Select the equipment whose failure has the greatest operational consequence.
- Audit time data: Confirm whether records use operating hours, starts, cycles, or another meaningful exposure measure.
- Classify failure modes: Separate seals, bearings, lubrication, electrical faults, process damage, and installation defects.
- Mark censored records: Preserve assets still operating at the end of the observation period.
- Validate with evidence: Compare fitted behavior with vibration, oil analysis, thermography, ultrasound, inspections, and teardown findings.
- Review the interval: Change PM tasks only after beta, eta, uncertainty, and physical evidence support the decision.
The most important governance rule is simple: never allow a convenient CMMS export to define the failure population by accident. A curve with mixed mechanisms can look authoritative while recommending a schedule that neither prevents infant mortality nor manages wearout.
Forge Reliability can support this work through reliability consulting, condition-monitoring programs, failure-mode analysis, and data-driven maintenance planning. A free reliability assessment can identify where CMMS records, diagnostic evidence, and current PM intervals are misaligned before the plant commits to a new replacement policy.
Schedule a free reliability assessment with Forge Reliability to review critical assets, prepare failure-mode-specific Weibull datasets, and connect the results to practical PM and condition-monitoring decisions. The assessment can help uncover hidden downtime risks and establish a reliability strategy grounded in plant-floor evidence.