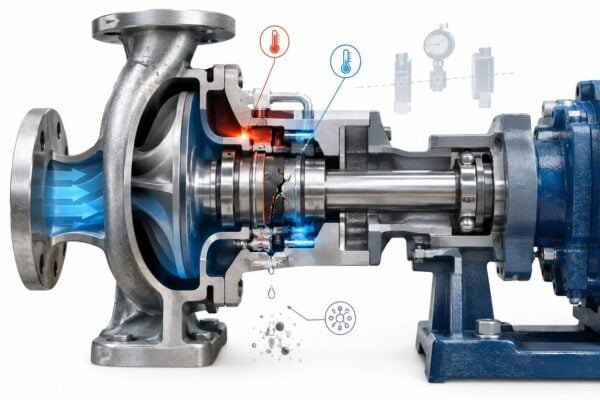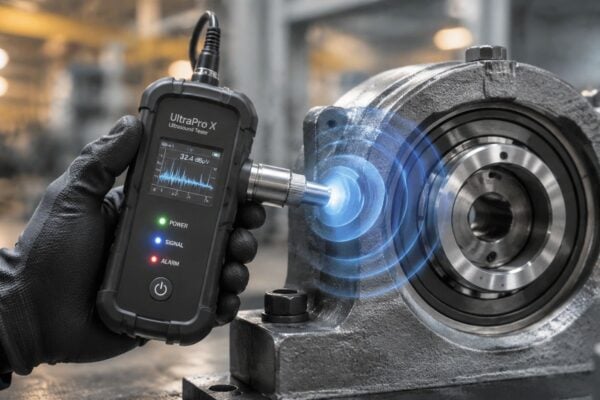
High-reactive-maintenance plants experienced 3.3 times more downtime and 16 times more defects than lower-reactive plants. Design for reliability is the primary lever for shifting that ratio, because it moves failure control upstream, from emergency repair into equipment selection, installation, monitoring, and lifecycle governance.
A reliable pump, motor, gearbox, or turbine isn't created by adding a maintenance task after commissioning. It emerges when engineers define the equipment function, understand how each failure develops, verify the controls under realistic stresses, and keep feeding operational evidence back into the design standard. That last step is where many programs weaken. A prediction made during procurement becomes disconnected from vibration data, repair findings, process conditions, and technician experience.
Table of Contents
- The Evolution of Reliability Engineering in Industry
- Implementing Functional FMEA for Critical Assets
- Accelerated Testing and Life Data Analysis
- Optimizing Maintenance Intervals with RCM
- Overcoming Operational Barriers to Reliability Programs
- Establishing KPIs and Governance for DfR
- Case Study – Achieving Measurable Uptime Gains
The Evolution of Reliability Engineering in Industry
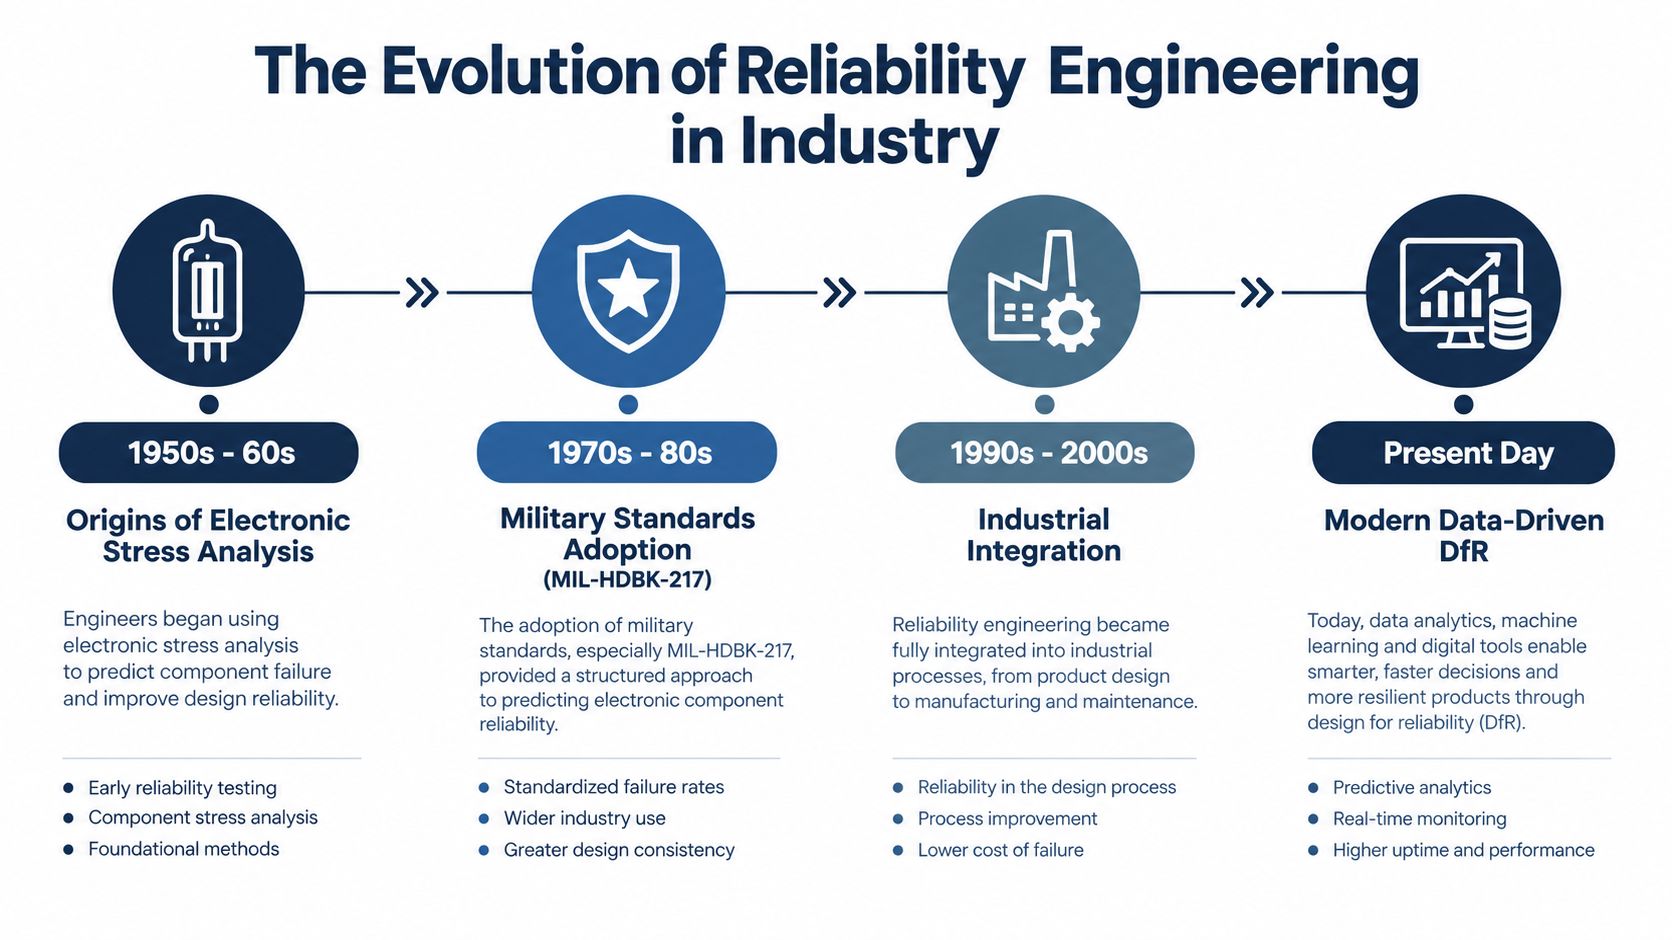
Design for reliability grew from a practical problem: engineers needed to estimate and control failure risk before equipment reached the field. In November 1956, Radio Corporation of America published TR-1100, Reliability Stress Analysis for Electronic Equipment. The work helped establish calculation-based reliability prediction using component failure rates and operating stresses. The U.S. military later issued MIL-HDBK-217 in 1962, reinforcing a shift from relying mainly on prototype testing toward estimating reliability during design. The history of traditional reliability prediction models shows both the value and the limits of that transition.
Why generic failure rates fail
Early prediction models made reliability visible during design, but a generic rate can create false confidence. MIL-HDBK-217A reportedly assigned a single failure rate of 0.4 failures per million operating hours to all monolithic integrated circuits, without differentiating environment, application, materials, architecture, power, manufacturing process, or supplier. As electronic complexity increased, later revisions struggled to represent devices such as 64K and 256K RAM.
Rotating equipment presents the same problem in a different form. A pump bearing doesn't fail according to a universal number independent of load, lubrication, alignment, contamination, process chemistry, speed, or installation quality. A gearbox operating in a clean, stable environment has a different risk profile from one exposed to shock loading and contaminated oil.
Practical rule: Treat a generic failure-rate value as an input to a design conversation, not as proof that the asset will perform reliably in service.
From prediction to learning
Modern industrial design reviews should combine FMEA, environmental and load analysis, supplier evidence, test results, and actual failure history. A critical pump specification should therefore address suction conditions, seal compatibility, standby philosophy, vibration monitoring, repair access, and the consequences of leakage, not just a calculated mean time between failures.
A useful guide to RCM and RBI for plants can help teams connect risk-based inspection with broader reliability decisions. The central lesson is simple: a design prediction remains credible only when the plant verifies its assumptions against operating data.
Implementing Functional FMEA for Critical Assets
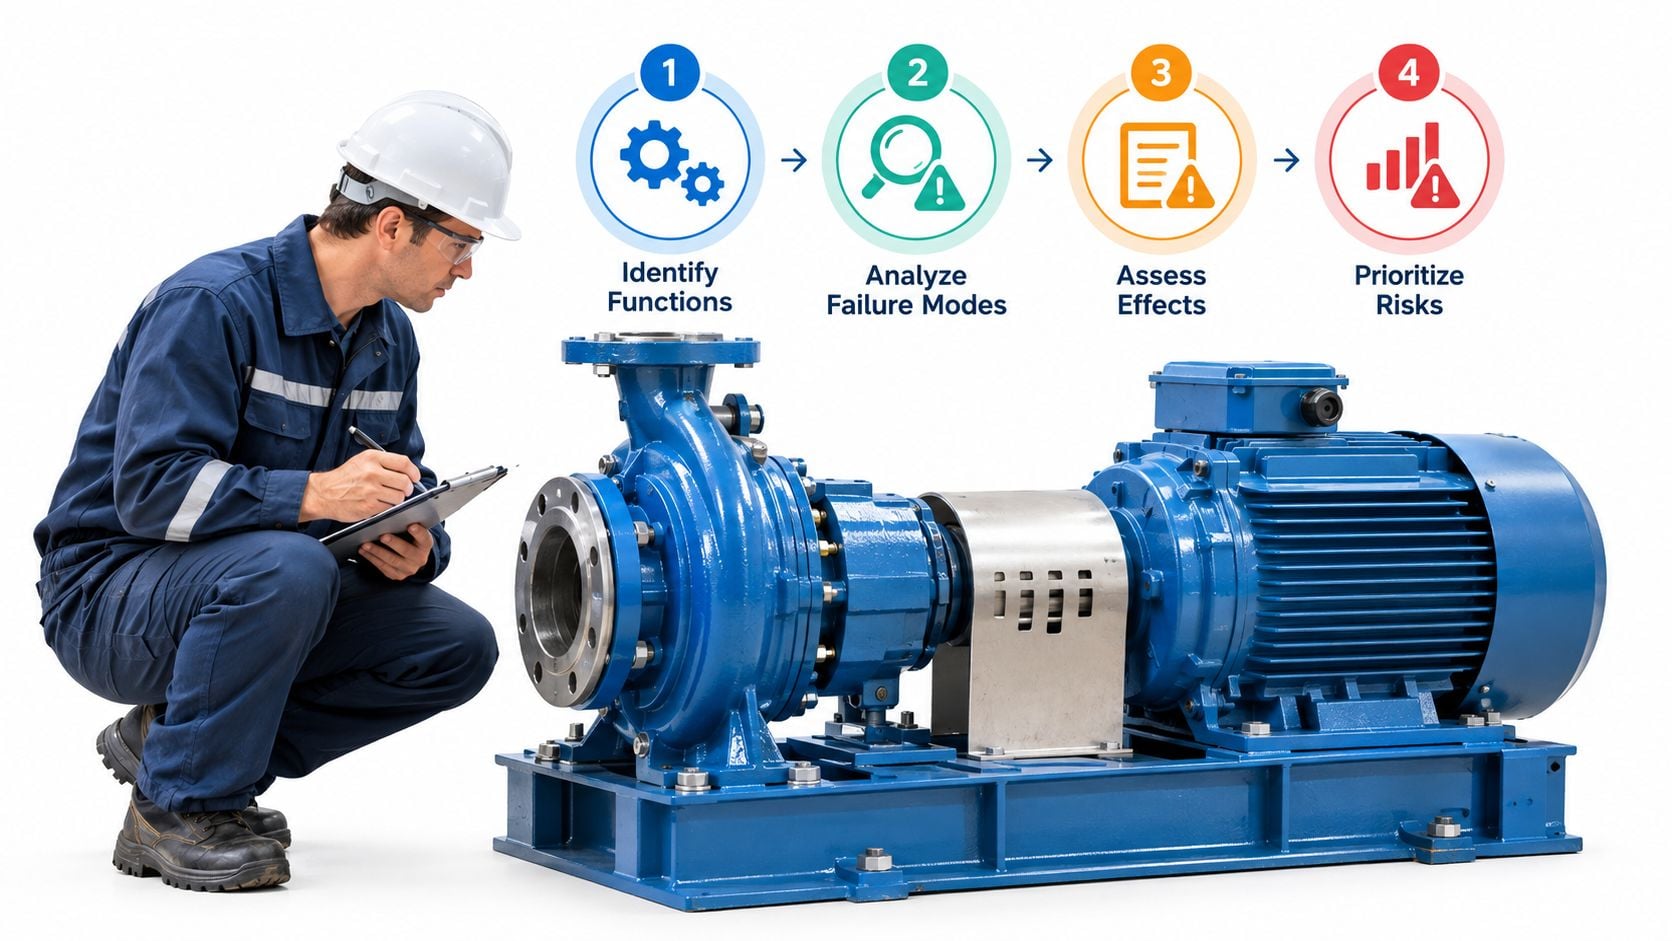
A functional Failure Modes and Effects Analysis, or FMEA, starts with what the equipment must do. It doesn't begin with a blank list of component failures. NASA defines FMEA as a systematic, bottom-up method that identifies each failure mode, its cause, and its effect at component, machine, system, and operational levels. NASA's Reliability-Centered Maintenance guidance provides the basis for applying that logic to industrial assets.
Start with function and failure
For a centrifugal pump, the primary function might be delivering a specified flow and pressure without releasing hazardous fluid. Performance limits should include acceptable vibration, temperature, leakage, efficiency, suction pressure, and operating range. Those limits give the analysis something observable to test.
The team can then identify failures such as impeller erosion, bearing seizure, mechanical-seal leakage, or loss of suction caused by cavitation. A failure mode describes how the item fails. The cause explains why it fails, while the effect describes what the operator, machine, process, or business experiences.
A practical sequence looks like this:
- Define the function. State the required duty, operating envelope, protective functions, and consequences of degraded performance.
- Identify the mode and cause. Separate seal leakage from bearing damage, and separate misalignment from lubrication breakdown.
- Rank the risk. Consider probability, consequence, and detectability. These rankings are assumptions until field data confirms them.
- Assign a control. Use derating, redundancy, improved sealing, filtration, containment, alignment controls, or condition monitoring where justified.
- Verify the control. Establish an acceptance criterion and test it under representative load, temperature, speed, and process conditions.
- Close the loop. Record the physical cause of every failure in the CMMS, then update the FMEA and equipment specification.
Link every high-risk mode to evidence
A bearing defect should have a vibration trend or spectrum. Lubrication deterioration may require temperature and oil-debris evidence. Cavitation may require suction-pressure, acoustic, or process-flow information. Motor-current signatures can help identify electrical abnormalities or driven-load changes.
The control isn't complete until someone owns the signal, defines the alarm response, and creates a work-order path. Forge Reliability's FMEA resource for manufacturing reflects this practical connection between failure analysis and actionable maintenance planning.
For a turbine, the same method might connect blade erosion to efficiency loss and inspection findings, or lubrication failure to bearing temperature and oil analysis. That specificity turns FMEA from a documentation exercise into a design and operating control loop.
Accelerated Testing and Life Data Analysis
A defensible reliability target needs more than a single mean-time-to-failure estimate. Engineers define the mission profile first, covering temperature, humidity, vibration, load spectrum, duty cycle, process conditions, and maintenance practices. Without those conditions, an accelerated test can produce a precise answer to the wrong question.
Build the test around the actual failure mechanism
Accelerated life testing increases relevant stresses to shorten service-life evaluation. Higher temperature, humidity, or vibration can expose weaknesses sooner, provided the failure mechanism remains consistent with normal operation. For example, testing a pump seal at pressure or temperature that causes chemical attack absent from service cannot support a credible field prediction.
High-Accelerated Life Testing, or HALT, helps identify design margins and weak points. It does not replace a validated life model. The test team must separate a weakness likely to appear in service from a destructive condition used deliberately to find the limit.
Test discipline: Accelerate the stress, not the assumptions. If the failure mechanism changes, the extrapolation loses its foundation.
Analyze complete and incomplete lives
Life-data analysis should include failed units and right-censored units, meaning items that completed the test or were removed before failure. Engineers commonly fit Weibull, lognormal, or exponential distributions and report confidence bounds instead of relying on one point estimate. A dedicated Weibull life-data analysis resource for design decisions explains how shape and scale parameters can support inspection-interval decisions. A practical resource on Weibull analysis describes how life-data methods can support reliability decisions.
The Weibull shape parameter provides a useful diagnostic:
- A value below 1 indicates early-life failures.
- A value approximately equal to 1 indicates a roughly constant random-failure rate.
- A value above 1 indicates wear-out behavior.
For a mechanical seal, wear-out evidence may support condition inspections or planned replacement. For a bearing, a rising shape parameter under a known load profile may support an overhaul strategy, after engineers confirm that contamination, alignment, and lubrication are not creating an avoidable failure mode.
The result should become an actionable design target, often expressed in failures per million unit-hours, with the mission profile, sample size, censoring treatment, confidence bounds, and acceleration model documented. After commissioning, compare those assumptions with operational failure records and update the model when mechanisms differ. Inspection, lubrication, spare-parts, and overhaul intervals should follow that evidence rather than a convenient calendar.
Optimizing Maintenance Intervals with RCM
Reliability-Centered Maintenance, or RCM, selects corrective, preventive, and proactive tasks according to failure consequences, detectability, operating age, and cost. NASA describes RCM as an ongoing process that uses operating-performance data to reduce failure probability cost-effectively, with particular attention to conditional probability within a specific operating-age interval. The RCM framework for reliability task selection makes clear why one maintenance interval can't suit every failure mode.
Compare the task to the failure pattern
A time-directed task works when an item has a credible age-related wear pattern and replacement can be completed before functional failure. A condition-directed task works when degradation can be detected and the warning period is long enough to plan a response. Run-to-failure can be reasonable for a low-consequence component when repair is safe, accessible, and economically acceptable.
A boiler-feed pump example illustrates the difference. In a study of the pumps examined, the damage rate was 60%, while recommended condition-directed intervals varied from 73 hours for an automatic recirculation valve to 960 hours for a mechanical seal and 1,080 hours for a scoop tube. The industrial maintenance report summarizing these findings demonstrates why component-specific analysis matters.
Those intervals aren't universal settings. They show that failure mode, consequence, detectability, and degradation behavior must determine the task.
Avoid maintenance that creates new risk
More preventive work doesn't automatically mean higher reliability. Excessive disassembly can introduce assembly errors, disturb alignment, damage seals, or consume labor that should be assigned to higher-consequence assets. Fixed monthly inspection may also miss cavitation that occurs only during a particular suction condition or misalignment that develops after a thermal transition.
A process-pump train might use continuous vibration and temperature monitoring for bearing deterioration, operator rounds for leakage and abnormal noise, oil analysis for gearbox wear, and a proof test for a protective device. The maintenance plan should specify the response to each signal, not merely collect readings.
Teams evaluating deployment patterns can consult this database of predictive maintenance rollouts for broader implementation context. A practical RCM approach for industrial assets should result in a task that is technically effective and executable by the available workforce.
Overcoming Operational Barriers to Reliability Programs
A reliability architecture can fail even when the sensors, models, and design calculations are technically sound. Recent research on AI-enabled manufacturing maintenance identifies infrastructure limits, scalability problems, workforce skill gaps, and weak strategies for maintaining deployed systems as connected barriers rather than separate issues. The plant must design the operating system around the technology.
A 2025 UK maintenance report found that 58% of asset-intensive organizations had abandoned at least one AI-related maintenance project, while 61% of earlier investments failed to meet ROI expectations. The same report states that organizations took an average of 22 months to move from pilot to production, compared with a 12-month global average. The research summary highlights why pilot success doesn't prove lifecycle readiness.
Specify ownership before procurement
A condition-monitoring design should answer operational questions before approval:
- Sensor coverage: Which high-consequence modes have measurable indicators, and where will sensors be installed?
- Data ownership: Who validates tags, manages historian quality, and resolves missing or implausible readings?
- Alarm governance: What threshold creates an operator response, an inspection, or a planned work order?
- Technician workflow: Who interprets the signal, confirms the physical cause, and records the finding?
- Solution maintenance: Who reviews drift, recalibrates sensors, updates rules, and retires ineffective alarms?
A pump with excellent vibration coverage can still fail if the alarm goes to an inbox nobody monitors or if technicians can't access the coupling during the available outage window. Conversely, a well-designed operator round may detect leakage and abnormal noise more reliably than a complex model when the failure is obvious and the asset is easy to inspect.
More sensing isn't the same as more reliability. The plant must be able to sustain the sensing, interpretation, and response chain.
Establishing KPIs and Governance for DfR
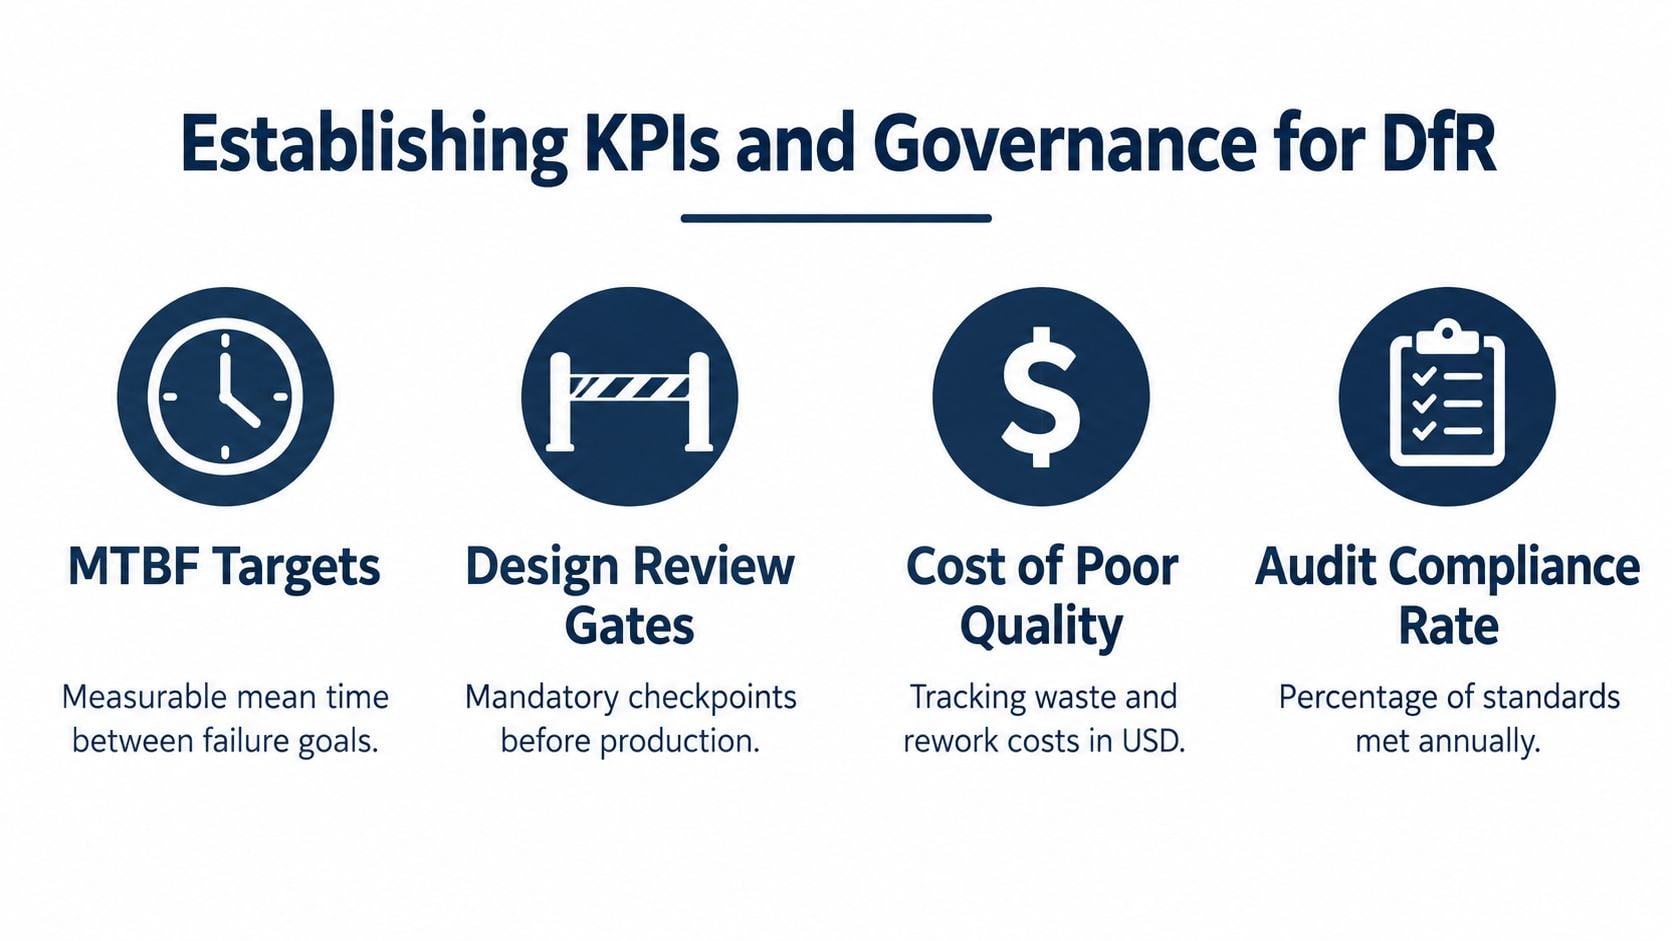
Design for reliability needs governance that connects engineering assumptions with plant results. A useful KPI isn't a decorative number on a dashboard. It should identify whether a design control works, whether a maintenance response occurs in time, or whether recurring failures are being removed from the system.
Choose measures that drive decisions
Unplanned downtime, defect frequency, mean time between failure, mean time to repair, OEE, repeat failure rate, overdue condition-based work, and FMEA action closure can all be useful when their definitions are stable. A plant should avoid treating MTBF as proof of reliability without recording operating context, failure criteria, and exposure time.
NIST manufacturing research found average maintenance mix at 45.7% reactive, 31.8% preventive, and 17.3% predictive. The same analysis found that plants in the highest-reactive-maintenance group experienced 3.3 times more downtime and 16 times more defects than lower-reactive plants. Greater predictive-maintenance use was associated with 15% less downtime, an 87% lower defect rate, and 66% fewer maintenance-related inventory increases. NIST's manufacturing maintenance analysis links those outcomes to condition data such as temperature, noise, and vibration.
A second NIST analysis reported 52.7% less unplanned downtime and 78.5% fewer defects for organizations using more predictive and preventive maintenance than the comparison group. Among organizations already using those approaches, greater predictive-maintenance use was associated with 18.5% less unplanned downtime and 87.3% fewer defects than heavier reliance on preventive maintenance. The detailed NIST report supports using evidence-driven tasks where the failure mode allows it.
Use formal review gates
A design review should require sign-off from engineering, maintenance planning, operations, process safety where relevant, and the people responsible for data and CMMS execution. The review should confirm:
- Function and limits are documented.
- High-consequence failure modes have owners.
- Controls and acceptance criteria are verified.
- Sensors and inspection methods connect to physical degradation.
- Work-order triggers have defined responses.
- Field feedback requirements are built into commissioning and post-startup reviews.
A reporting layer can consolidate these measures for multi-site teams. For teams that need a custom dashboard for agencies, the underlying principle still applies to industrial governance: every visual should support a decision, not merely display activity.
A reliability metrics guide covering MTBF, MTTR, and OEE can help standardize definitions before leaders compare assets or sites.
Case Study – Achieving Measurable Uptime Gains
A manufacturing facility had recurring failures on a motor-driven process-pump train. The maintenance team replaced mechanical seals on a familiar schedule, but the same assets continued to experience leakage, bearing deterioration, and unplanned stoppages. Reactive work dominated the weekly plan, while repair records described symptoms more often than physical causes.
The plant formed a cross-functional review group with a reliability engineer, maintenance planner, operator, electrician, and process engineer. The group defined the pump's required function and operating limits, then built a functional FMEA around four modes: seal leakage, bearing damage, cavitation, and shaft misalignment.
Turning failure modes into controls
Each mode received a specific evidence path. Seal condition was checked through leakage inspection and process compatibility review. Bearing condition was tracked through vibration and temperature trends. Cavitation risk was tied to suction pressure and operating conditions. Alignment risk was addressed through installation verification and post-maintenance checks.
The team then separated tasks by failure behavior. It retained operator rounds for visible leakage and abnormal noise, used condition-directed work for developing bearing defects, and reserved planned intrusive work for findings supported by evidence. The CMMS record required technicians to identify the physical cause, not just select “pump failed.”
Design reviews also changed. Procurement specifications included monitoring access, seal materials, alignment requirements, acceptance testing, and data ownership. Operations agreed on alarm responses, while maintenance planning established how confirmed findings would become scheduled work.
Measuring the lifecycle loop
The plant tracked unplanned downtime, repeat failures, condition-monitoring findings, overdue responses, and FMEA action closure. Instead of treating commissioning as the end of reliability engineering, the team reviewed field findings against the original assumptions and updated the pump standard.
This approach is consistent with OEE improvement practices that connect equipment losses to specific operating and maintenance actions. The important gain wasn't a new dashboard or a larger preventive schedule. It was the closed loop from design assumption to physical evidence, work execution, repair finding, and revised design control.
Forge Reliability provides free reliability assessments that apply FMEA, RCM, criticality ranking, Weibull analysis, and condition-monitoring methods to critical pumps, motors, gearboxes, compressors, and turbines. Visit Forge Reliability to identify gaps between design predictions and operational data, prioritize failure-mode controls, and build a maintenance strategy the plant can sustain after commissioning.