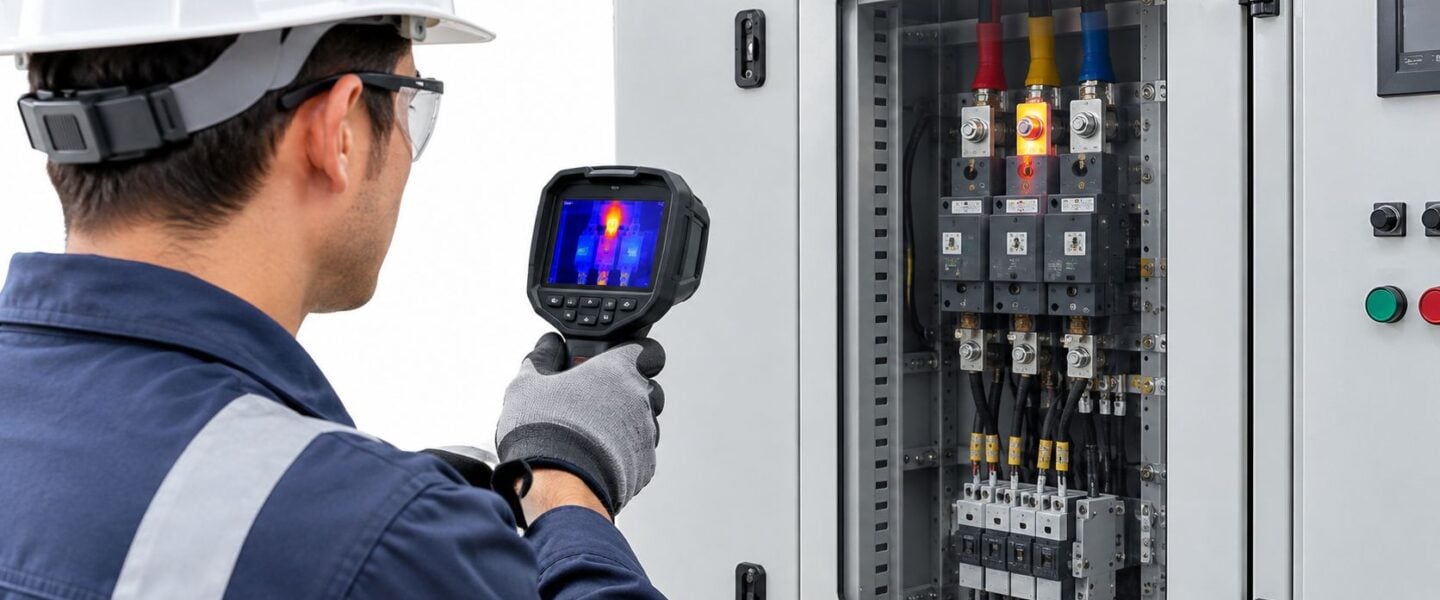
A maintenance manager stands in front of an energized motor control center with a thermal image from last quarter in hand. One breaker termination glows hotter than its neighbors, but nobody recorded the load, the ambient temperature, or which phase carried what current. The image looks urgent, yet it can't support a shutdown decision on its own.
That gap is where most thermal programs stall. A color scale isn't a diagnosis, and a hot spot isn't automatically a work order. Infrared thermography predictive maintenance works when a team ties temperature difference, operating conditions, and confirmation testing into one repeatable decision.
Table of Contents
- Why Thermography Belongs in Every PdM Program
- The Physics Behind a Reliable Thermal Reading
- Failure Modes Thermography Catches Early
- Choosing and Setting Up the Right Camera
- Running an Inspection the Right Way
- Pairing Thermography With Vibration, Ultrasound, and Oil Analysis
- Plant Examples Across Electrical, Mechanical, and Process Assets
- Building a Repeatable Inspection and Reporting Cadence
Why Thermography Belongs in Every PdM Program
Energized switchgear, a bearing housing flagged on a previous route, and a steam trap survey that keeps slipping share the same problem. Each asset gives off heat before it fails, but the heat only means something when the inspector knows the load, the surroundings, and the failure mode behind the pattern. Thermography earns its place because it screens large numbers of assets quickly, without contact and without stopping production.
The value isn't the photograph. It's the prioritization that follows. A planner can rank a loose bus joint, an overloaded conductor, and a warm gearbox by risk, then spend limited craft hours where failure consequence is highest. That logic fits naturally inside condition-based maintenance programs built around asset health data, where inspections trigger work based on evidence rather than calendar dates alone.
From Walk-Around to Work Order
A defensible route starts before the camera powers on. The inspector needs a current asset list, prior thermograms for comparison, and a production window when circuits carry representative load. Teams that maintain a practical electrical upkeep schedule already have much of this structure in place, since planned electrical care and thermal routes depend on the same asset inventory and access planning.
A thermal finding should answer three questions before it becomes a job plan. What's hotter than expected, under what load, and what test confirms the cause?
Automation is strengthening that screening role. A 2022 peer-reviewed study combining thermal imaging with machine learning and augmented reality reported a predictive model with 94.5% accuracy in cross-validation and inference in 0.006 seconds. Speed like that supports near-real-time screening during handheld routes, while engineers still review flagged anomalies before authorizing repairs.
The Physics Behind a Reliable Thermal Reading
An infrared camera doesn't measure internal temperature. It senses infrared radiation emitted from a surface, then converts that signal into a temperature estimate using settings the inspector enters. Change those settings and the number changes, even when the equipment hasn't changed at all.
Emissivity and Reflected Radiation
Emissivity describes how efficiently a surface emits radiation compared with a perfect emitter. Painted steel emits well and behaves much like a matte wall in a photograph, while polished copper acts more like a mirror, reflecting radiation from nearby hot equipment, lighting, or the inspector. A shiny bus bar can therefore look hot because it's reflecting a heat source, or look deceptively cool because it emits poorly.
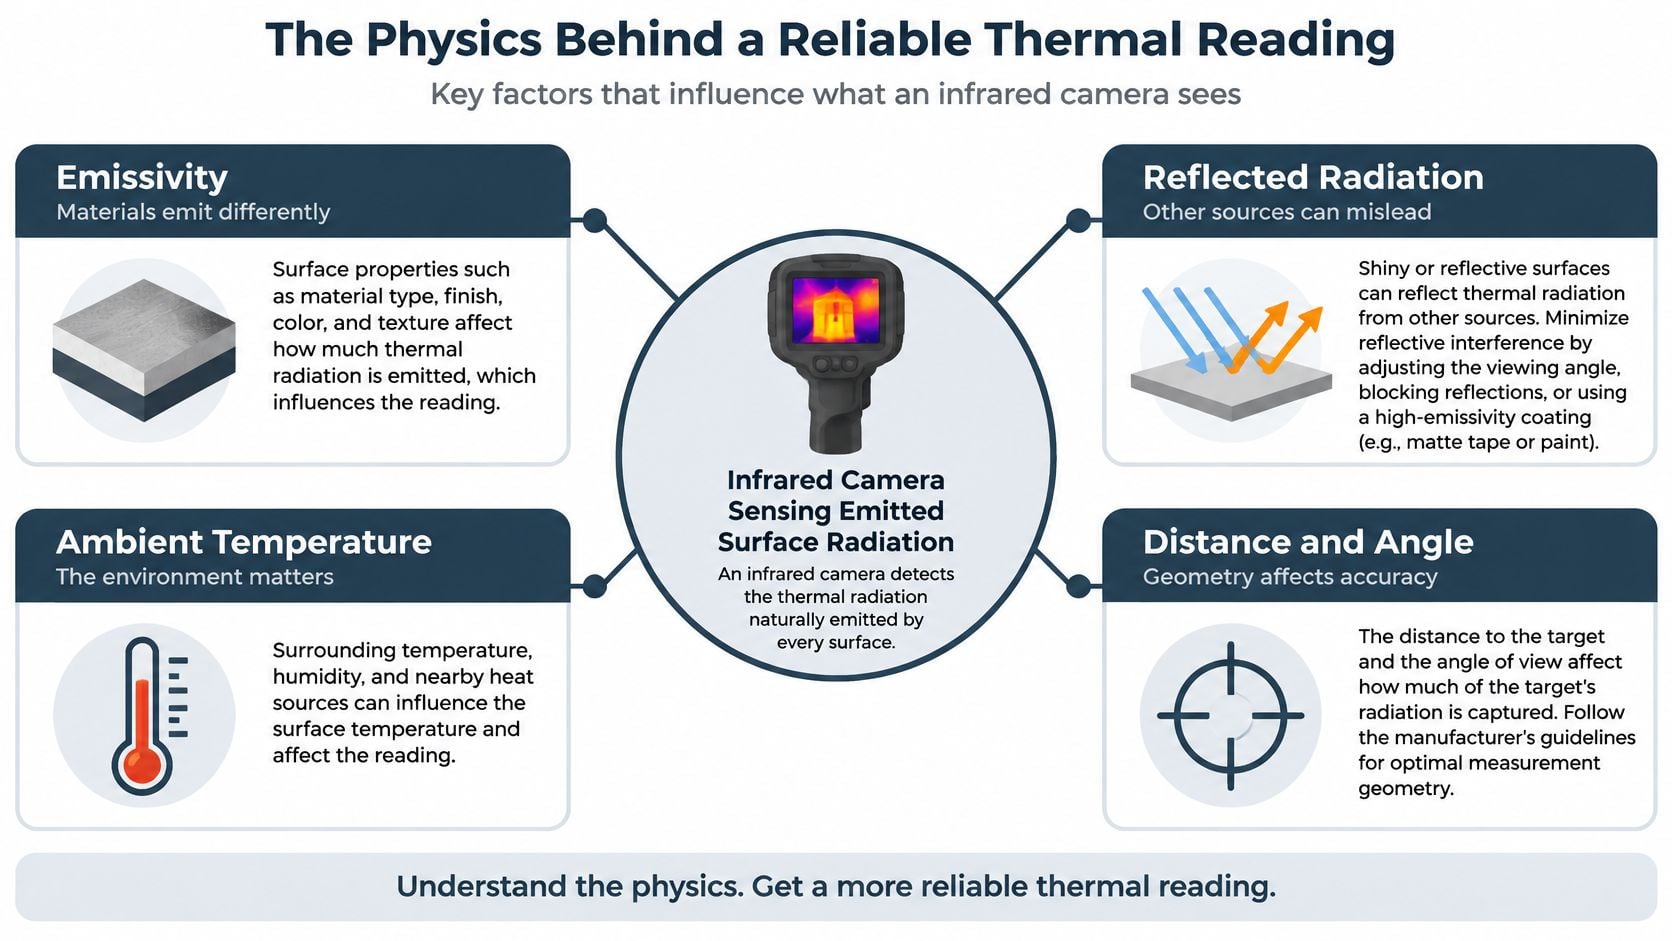
Reflected apparent temperature is the background radiation the camera must subtract. Inspectors estimate it from surrounding surfaces and record the value with the image. Viewing angle matters too, because steep angles reduce emitted signal and increase reflection, so a perpendicular view gives the most trustworthy reading when access allows it.
Why Temperature Difference Beats Absolute Temperature
Ambient air, airflow, solar loading, and process heat all shift surface temperatures during a shift. A neutral review summarized in research on practical limitations of infrared imaging identifies surface-only measurement, technique sensitivity, training needs, and ambient fluctuation as core constraints. Those constraints explain why experienced thermographers lean on ΔT, the temperature difference between similar components under similar load, or between a component and ambient air.
Comparing Phase A with Phases B and C cancels many emissivity and ambient errors, since all three terminations share the same surface finish and environment. The odd phase out deserves investigation, even when its absolute temperature looks modest. That comparative method is the foundation of industrial surveys, and it's far more repeatable than chasing a single number from a single image.
Failure Modes Thermography Catches Early
Heat is a symptom with several possible causes. Pattern shape usually tells the inspector where to look first, because a point source of heat and a broad warm area rarely share the same root cause. The five modes below cover most findings on electrical and mechanical routes.
- Loose or corroded electrical joints: Increased contact resistance converts current into localized heat at a lug, bolted bus joint, or fuse clip. The signature is a tight hot spot at the connection that fades along the conductor. Confirmation comes from current measurement during the survey, followed by torque verification or resistance testing once de-energized.
- Overload and phase imbalance: An overloaded conductor warms along its full length, while imbalance shows one phase running hotter across every connection in that circuit. A clamp meter reading separates the two quickly. Teams investigating these patterns often pair thermal data with structured electrical fault detection methods to check load distribution and protective device condition.
Breaker and transformer problems produce different shapes. A breaker with worn internal contacts heats at the device body compared with identical breakers carrying similar load. A transformer with blocked cooling fins or low oil circulation shows uneven tank temperatures or a radiator bank that's cooler than its neighbors, which points to restricted flow rather than electrical overload.
Mechanical and Process Signatures
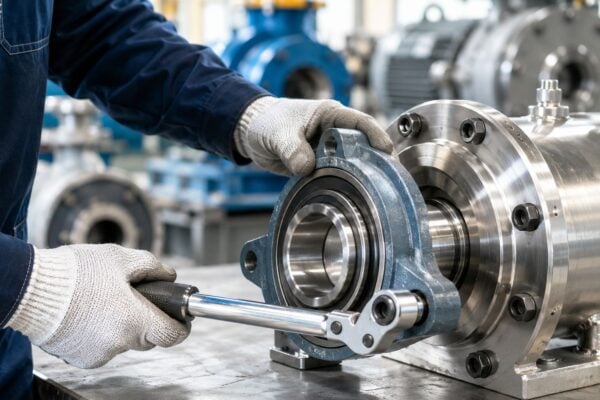
Bearing wear raises housing temperature in a broad, steady pattern as friction increases. Misalignment concentrates heat at the coupling and the bearing nearest to it, often on one side of the machine train. Vibration analysis confirms whether the heat comes from a rolling-element defect, lubrication failure, or shaft alignment, since the camera alone can't separate those causes.
Process assets follow the same screening logic. A steam trap failed open shows continuous downstream heat, refractory loss inside a vessel appears as a warm patch on the shell, and missing insulation creates a defined warm boundary. Each finding still needs a confirming test, such as ultrasonic listening on the trap or internal inspection of the vessel.
Screening rule: Thermography finds where the abnormal heat is. A second method determines why it's there.
Choosing and Setting Up the Right Camera
Camera selection starts with the asset list, not the catalog. Electrical distribution and rotating equipment need a radiometric camera, meaning every pixel stores a temperature value that software can reanalyze later. A non-radiometric image is only a picture, and it can't support trending or a revised emissivity correction after the route.
Handheld, Fixed, and Lens Decisions
Handheld cameras suit route-based work across switchgear, motors, and process equipment because one instrument covers many assets. Fixed cameras make sense on a small number of critical assets where conditions change between routes, such as a large fan bearing or a furnace shell. Detector resolution and lens field of view determine the smallest target that can be measured accurately at a given distance, so a wide-angle lens used from too far away produces averaged temperatures that hide small hot connections.
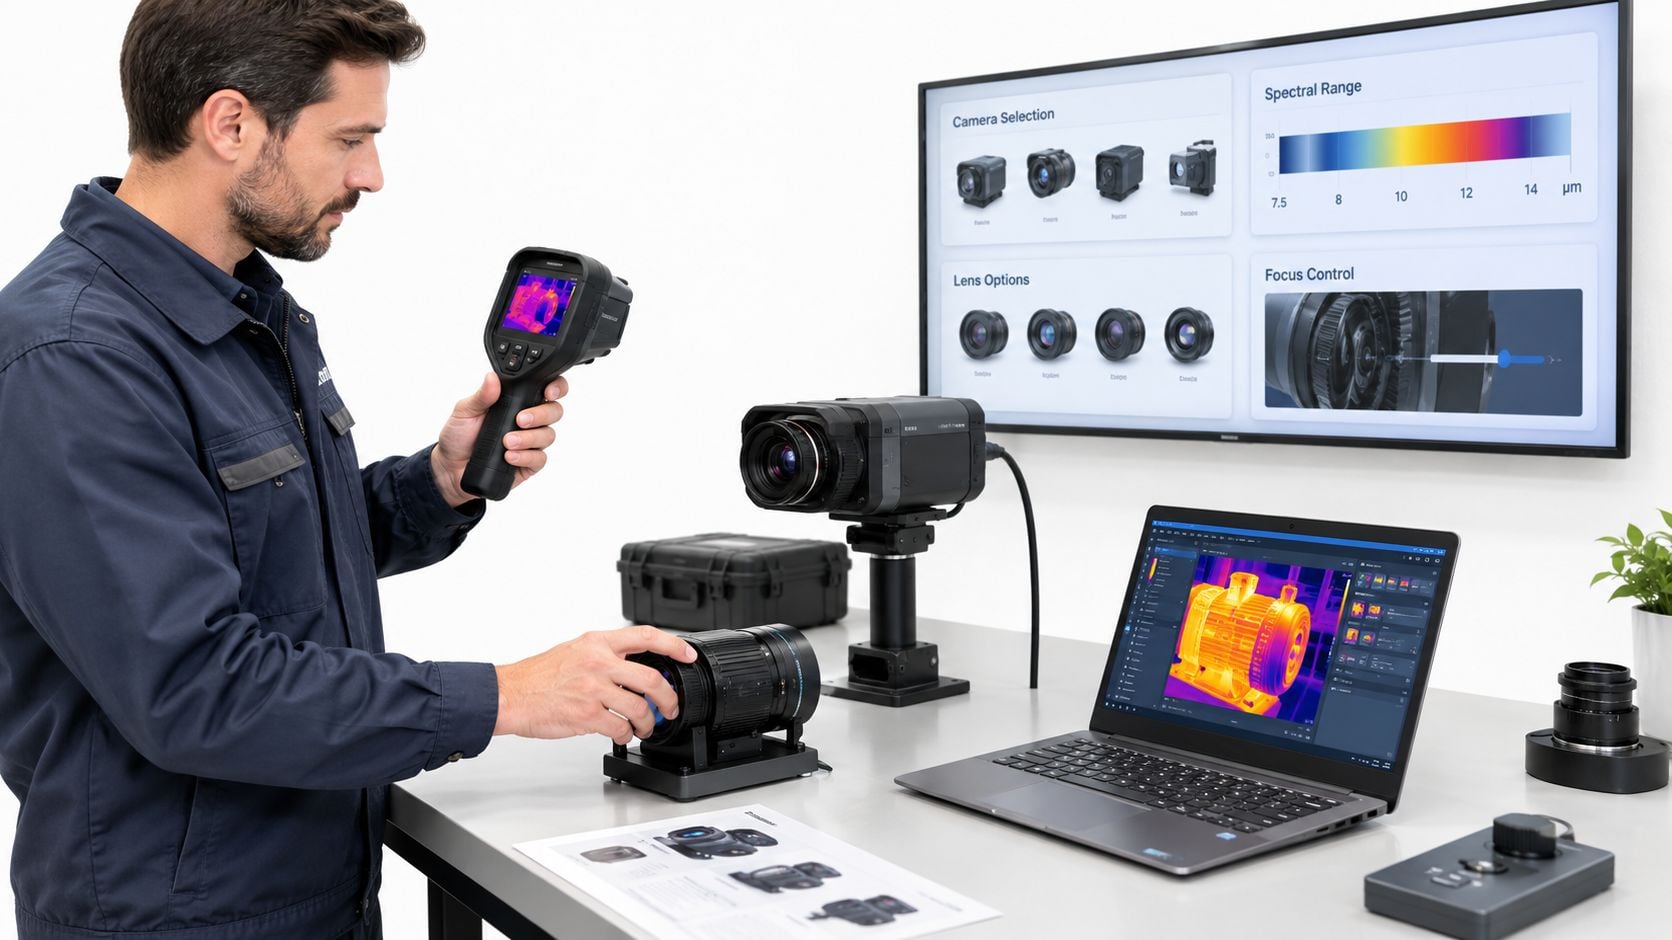
Temperature range deserves the same scrutiny. Refractory and furnace work requires a high-temperature range, while steam traps and building insulation need sensitivity at low temperatures. Focus quality matters as much as resolution, because a blurred image spreads a small hot spot across surrounding pixels and understates its peak temperature.
Settings and Metadata That Make Trends Defensible
Before the first image, the inspector sets emissivity for the dominant surface, enters reflected temperature, and confirms distance and ambient conditions. Each saved image should carry equipment identification, load at time of capture, and any surface treatment used, such as electrical tape applied to shiny metal to create a known emissivity patch.
Software that exports images with parameters intact protects the program when a different inspector repeats the route. Without that metadata, two images of the same bearing taken months apart can't be compared fairly, and the trend a planner relies on becomes guesswork.
Running an Inspection the Right Way
A safe, repeatable survey follows the same sequence every time, regardless of who holds the camera. Consistency is what turns individual findings into a trend that engineering can defend during a shutdown planning meeting.
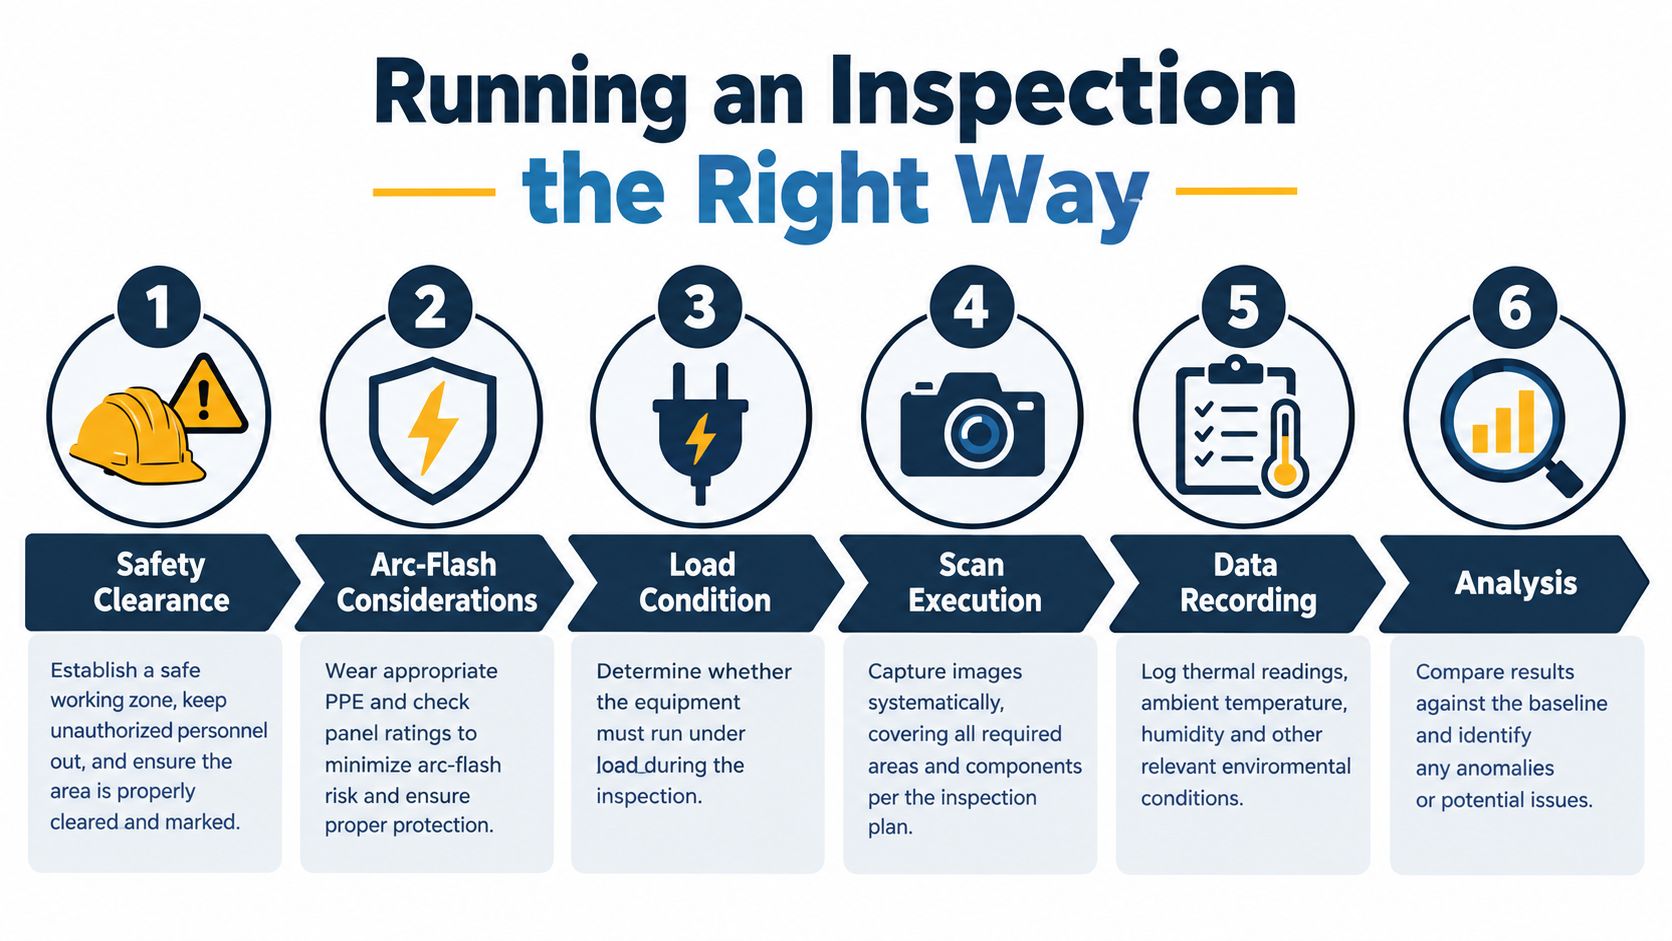
- Establish safety clearance: Confirm arc-flash boundaries, required protective equipment, and panel access rules before opening any enclosure. Infrared windows, where fitted, let the inspector scan closed panels and reduce exposure.
- Verify load conditions: Record phase current and production state for each circuit. NFPA 70B Section 7.4 guidance on thermographic inspection requires comparison of ΔT between similar components under similar loads and permits at least 40% of nominal capacity when normal loading isn't feasible, with conditions documented.
- Capture with discipline: Shoot perpendicular to the target, focus sharply, and include a reference component in frame or in a paired image. Save the radiometric file, not just a screen snapshot.
- Record the context: Log ambient temperature, emissivity, reflected temperature, distance, and anything unusual, such as a nearby steam leak or direct sunlight on outdoor gear.
Converting a Hot Spot Into a Decision
Interpretation starts with ΔT against the reference component, then checks whether load explains the difference. A termination that's hot while carrying less current than its neighbors points toward contact resistance. One that's hot in proportion to higher current points toward load imbalance, which is an operations or design question rather than a connection repair.
Escalation follows consequence, not temperature alone. A moderate ΔT on a critical feeder with no backup supply may outrank a larger ΔT on a redundant circuit. Confirmation options include current measurement, ultrasonic testing for arcing sounds, and de-energized torque or resistance checks during the next planned outage.
Documentation closes the loop. The report should state the finding, the measured ΔT, load conditions, severity, recommended action, and the exact camera position so the next inspector reproduces the measurement. A finding that can't be reproduced can't be trended, and it will consume planning time every route.
Pairing Thermography With Vibration, Ultrasound, and Oil Analysis
No single technology explains a failing asset completely. Thermography covers ground fast, so it works best as the screening layer that directs slower, more specific tests toward the assets that need them.
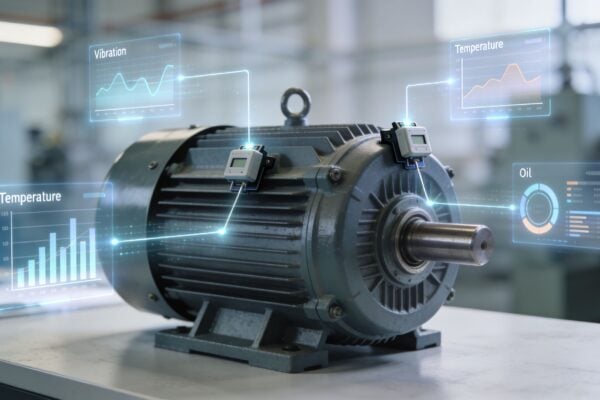
Consider a warm bearing housing on a large blower. Research on continuous thermal monitoring of a 500 kW motor-driven blower used images every 15 minutes and corrected for process and ambient variation, which reduced temperature scatter to a few tenths of a degree and enabled detection of drift below 1 °C. A corrected rise that small doesn't name the defect, but it tells the vibration analyst exactly where to collect data next.
Matching the Confirmation Test to the Signature
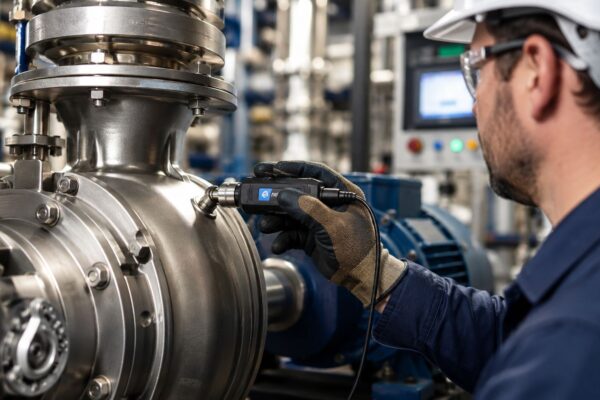
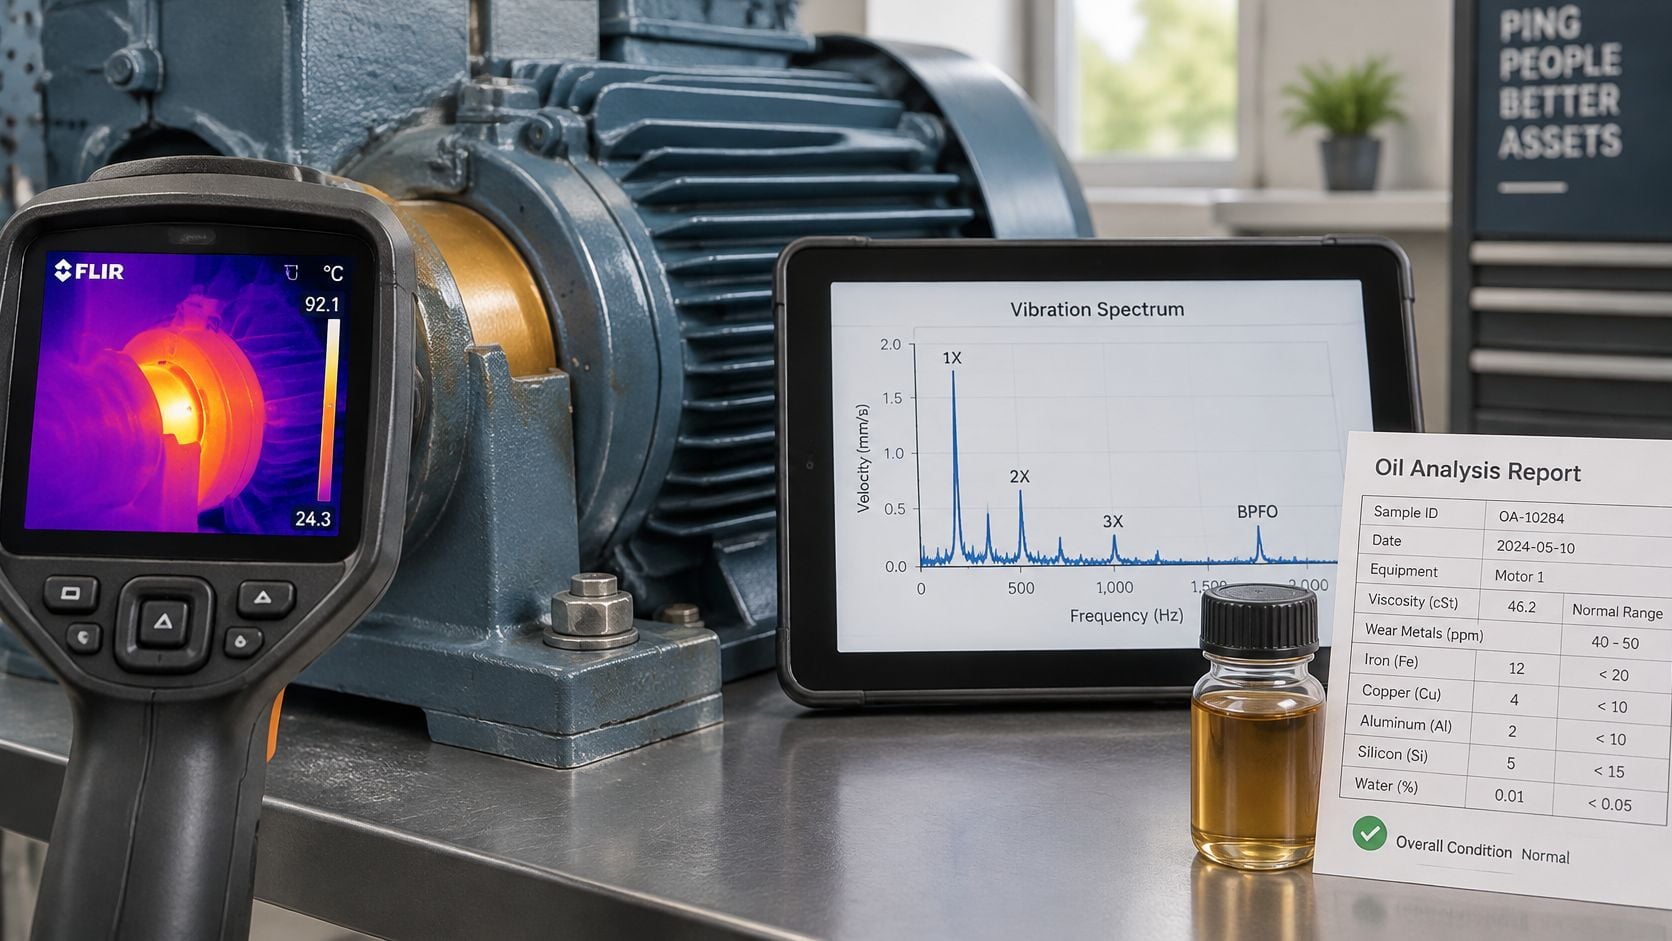
Vibration spectra separate imbalance, misalignment, looseness, and bearing defects that can all produce similar heat. Teams building that capability benefit from practical guidance on how vibration measurement works before they try to correlate thermal and spectral trends. Ultrasound adds value earlier in lubrication distress, since friction noise rises before a housing warms noticeably, and it also detects arcing and partial discharge inside electrical enclosures that produce little surface heat at first.
Oil analysis answers a different question. Particle counts and wear metal trends identify what's wearing inside a gearbox or hydraulic system, while the thermal image shows where the resulting friction or restriction appears. Motor current signature analysis can confirm electrical or mechanical problems inside a motor that a warm frame only hints at.
Cross-checking cuts false calls in both directions. It prevents unnecessary teardowns on load-related heat and prevents dismissal of real defects that look mild on a color scale.
Plant Examples Across Electrical, Mechanical, and Process Assets
A chemical processor scanning a motor control center finds one bus-bar termination hotter than the identical joints beside it, at similar phase currents. The pattern is tight and localized, which fits contact resistance rather than overload. The planner schedules a de-energized torque check and joint inspection at the next outage, and the crew documents load and ambient conditions so the follow-up scan proves whether the repair worked.
A paper-mill drive tells a slower story. Quantitative monitoring described in research on an industrial drive monitored with infrared thermography recorded bearing temperature rising from about 45 °C to 90 °C during the first 3.5 hours of operation, then oscillating near that level. Bands like those below are equipment-specific, but they show how a trend becomes an escalation plan, with vibration checks and routine oil sampling and analysis supporting the thermal trend.
Thermal Severity Bands for a Paper-Mill Industrial Drive
| Condition Level | Bearing Temperature | Coupling Temperature | Likely Action |
|---|---|---|---|
| Nominal | Below 80 °C | Below 70 °C | Continue routine trending |
| Intermediate | 80 to 105 °C | 70 to 80 °C | Confirm with vibration and lubrication review |
| High risk | 105 to 110 °C | 80 to 85 °C | Plan corrective work and increase monitoring |
| Critical | Above 110 °C | Above 85 °C | Assess for controlled shutdown |
Substation surveys show both the promise and the limits of automated screening. A 2017 machine-learning thermography study across 10 substations assembled 150 thermal images and 300 distinct hot spots, reaching 79.78% initial accuracy with a multilayer perceptron classifier. That performance supports screening and staging findings for human review, not automatic repair decisions, and it underlines why baseline libraries by asset type and load level matter.
Building a Repeatable Inspection and Reporting Cadence
More frequent scanning doesn't guarantee better results. A route run often under light load produces reassuring images that miss resistive heating, while a well-timed route under representative load catches defects that matter. Cadence should follow asset criticality, failure consequence, and how fast a failure mode develops, not a uniform interval applied to everything in the plant.
Route Design and Required Data Fields
Critical feeders, main switchgear, and bottleneck rotating equipment belong on the most frequent routes. Redundant or low-consequence assets can wait longer, provided their failure modes develop slowly. Every captured image, regardless of route, should carry the same fields so findings stay comparable across inspectors and seasons.
- Asset identity and location: Equipment tag, component, and camera position.
- Operating context: Phase current or load percentage, production state, and ambient temperature.
- Measurement settings: Emissivity, reflected temperature, distance, and reference component used.
- Decision fields: Measured ΔT, severity grade, confirmation test required, and recommended repair timing.
Severity, Escalation, and Program Management
Severity grades should combine ΔT with criticality and safety consequence, then map each grade to a response window and a confirmation method. Planners can then convert a finding into a job plan with parts, access requirements, and outage needs already defined. Storing images, fields, and work history together through disciplined CMMS asset management keeps the trend visible when personnel change.
A one-page route checklist handed to any contractor should state load requirements, metadata fields, severity rules, and report format. Programs built on infrared thermography predictive maintenance succeed on that discipline. Plants ready to apply it can start with a free reliability assessment that ranks critical assets and identifies which ones need route-based thermography, continuous sensing, or a different condition-monitoring method entirely.
Forge Reliability helps industrial teams turn thermal findings into prioritized, confirmed maintenance decisions through thermographic inspection integrated with vibration, ultrasound, and oil analysis. A free reliability assessment maps critical electrical, mechanical, and process assets to the right inspection cadence and confirmation workflow for each failure mode. Visit Forge Reliability to request an assessment suited to the assets that carry the highest downtime risk.