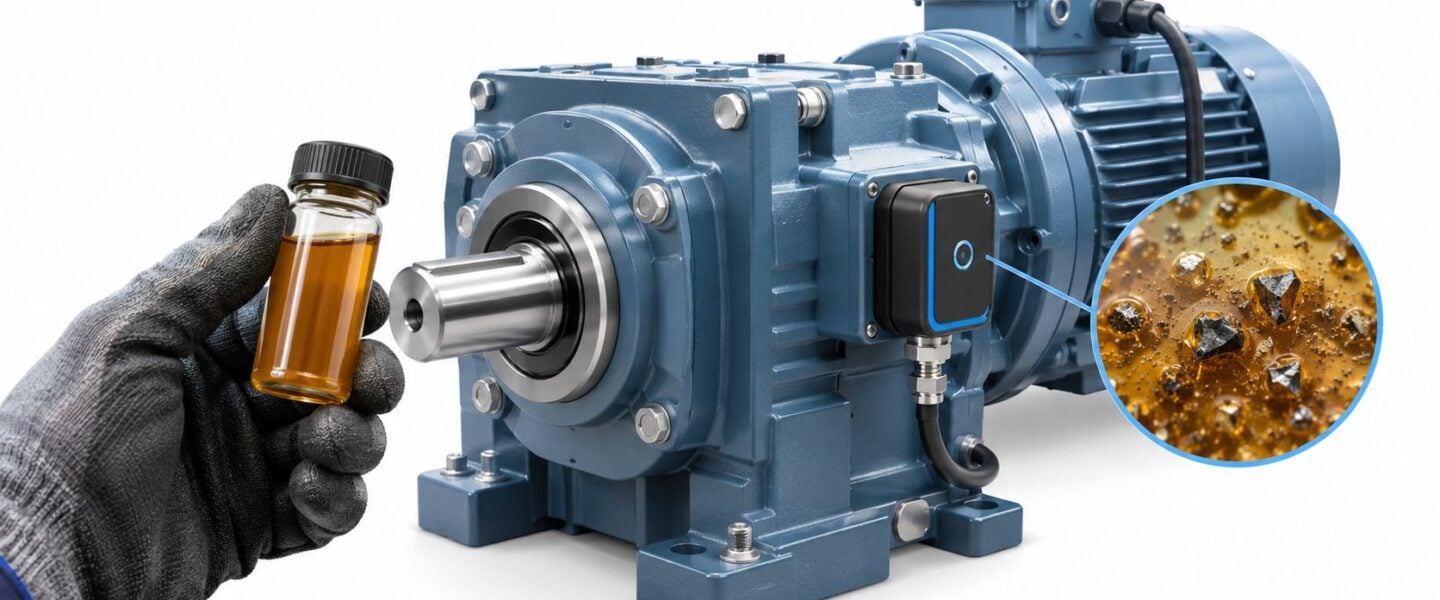
The laboratory report flags high iron in a production gearbox. Maintenance has an opening during the next changeover, operations wants assurance that the machine can keep running, and someone recommends changing the oil. The unresolved question is whether the problem is dirty lubricant, deteriorating lubricant, or a bearing that's actively shedding metal.
Predictive maintenance oil analysis becomes useful when the reliability team can turn that distinction into a defensible action: continue operating, correct contamination, replace the lubricant, inspect a component, or shut down. The laboratory result starts that decision. It doesn't finish it.
Table of Contents
- Why Oil Analysis Is a Predictive Maintenance Cornerstone
- Core Oil Analysis Tests and What They Diagnose
- Sampling Best Practices That Protect Data Quality
- Interpreting Wear Signatures Across Equipment Types
- Route-Based Versus Continuous Oil Monitoring Programs
- Laboratory Analysis Versus Onsite Instrumentation
- Setting Alarm Thresholds and Measuring Program ROI
- Integrating Oil Analysis With PdM and CMMS Workflows
Why Oil Analysis Is a Predictive Maintenance Cornerstone
Consider a conveyor gearbox with an elevated iron result. The team drains and refills it, then receives a lower iron concentration on the next report. That looks reassuring, but fresh oil has diluted the debris. Without accounting for the oil change, the team could mistake dilution for an improvement in mechanical condition.
This is an illustrative maintenance scenario, not a documented case. It captures the central weakness of treating oil analysis as a pass/fail inspection: a concentration is not a wear rate, and a cleaner sample doesn't necessarily mean a healthier machine.
The historical lesson is still practical
The discipline developed around changes in wear-metal concentrations. A historical account reports that the Denver and Rio Grande Railroad research laboratory used wear-metal analysis in 1946, replacing several wet-chemical methods with a spectrograph capable of measuring individual elements such as iron and copper. The United States Naval Bureau of Weapons began a major research program in 1955, contributing to the Joint Oil Analysis Program across the U.S. Armed Forces; commercial adoption included Pacific Intermountain Express's laboratory in 1958 and the founding of Analysts, Inc. in 1960, according to this history of oil-analysis development.
The important inheritance isn't the instrument. It's the operating principle: increasing wear-metal concentrations can provide evidence of increasing component wear. Modern interpretation still depends on understanding how that concentration developed.
Practical rule: An oil report describes a sample. A comparable series of reports supports a maintenance decision.
Build a history that supports intervention
For the conveyor gearbox, the asset record should preserve more than laboratory flags:
- Sampling identity: The machine, lubricant, and sampling location must remain unambiguous.
- Operating exposure: Record equipment hours, lubricant hours, and meaningful changes in duty.
- Maintenance events: Identify oil changes, additions, filtration work, and component replacement.
- Decision history: Document why the team continued operation or initiated corrective work.
These records distinguish a developing fault from a maintenance-induced change in the results. Within a condition-based maintenance strategy, oil analysis supports intervention based on equipment condition rather than an isolated alarm or calendar date.
The objective is a planned correction while the team still has choices, not a laboratory explanation after the gearbox stops.
Core Oil Analysis Tests and What They Diagnose
A useful test package answers separate questions about machine condition, contamination, and lubricant condition. Ordering every available test isn't automatically better. The reliability engineer should select measurements that can change the maintenance decision for that asset.
Match the test to the diagnostic question
Elemental spectroscopy measures elements in the oil, principally in dissolved material and very small particles. Iron, copper, chromium, and lead can help identify possible wear sources. Silicon can support an investigation into dirt ingress, but the interpretation must fit the lubricant and equipment history.
Particle counting measures how many particles occur within defined size ranges. It describes cleanliness and particle-size distribution, not particle composition. A high count alone doesn't establish whether the material is external dirt or internally generated metal.
Viscosity describes a fluid's resistance to flow. An increase can accompany oxidation, contamination, or thermal degradation; a decrease may indicate dilution or shear-related lubricant deterioration. Chemistry trends help distinguish changes in the lubricant itself from changes in the machine.
Analytical ferrography examines deposited debris microscopically. A ferrogram is the prepared deposit used for that examination; morphology means particle form, including size, shape, and surface features.
The ASTM D7690 description of analytical ferrography identifies increasing particle concentration, together with increasing particle size and severity of particle types, as evidence of fault initiation. The technique extends interpretation beyond bulk chemistry to direct examination of wear and contaminant particles.
Apply the tests together
For a mill gearbox, the diagnostic sequence should distinguish contamination from component deterioration before prescribing work.
- High particle count with little ferrous material: Investigate dirt entry and filtration before concluding that a gear is failing.
- Rising ferrous material with severe particle morphology: Prioritize examination of gears and rolling-element bearings.
- Acceptable viscosity with abnormal debris: Don't dismiss the mechanical evidence because the lubricant still meets its viscosity requirement.
- Changed viscosity without corresponding wear evidence: Investigate lubricant condition and compatibility rather than assuming a mechanical teardown is necessary.
Ferrous material contains iron. A rolling-element bearing carries load through balls or rollers, so its debris can require different interpretation from the material produced by a sliding surface.
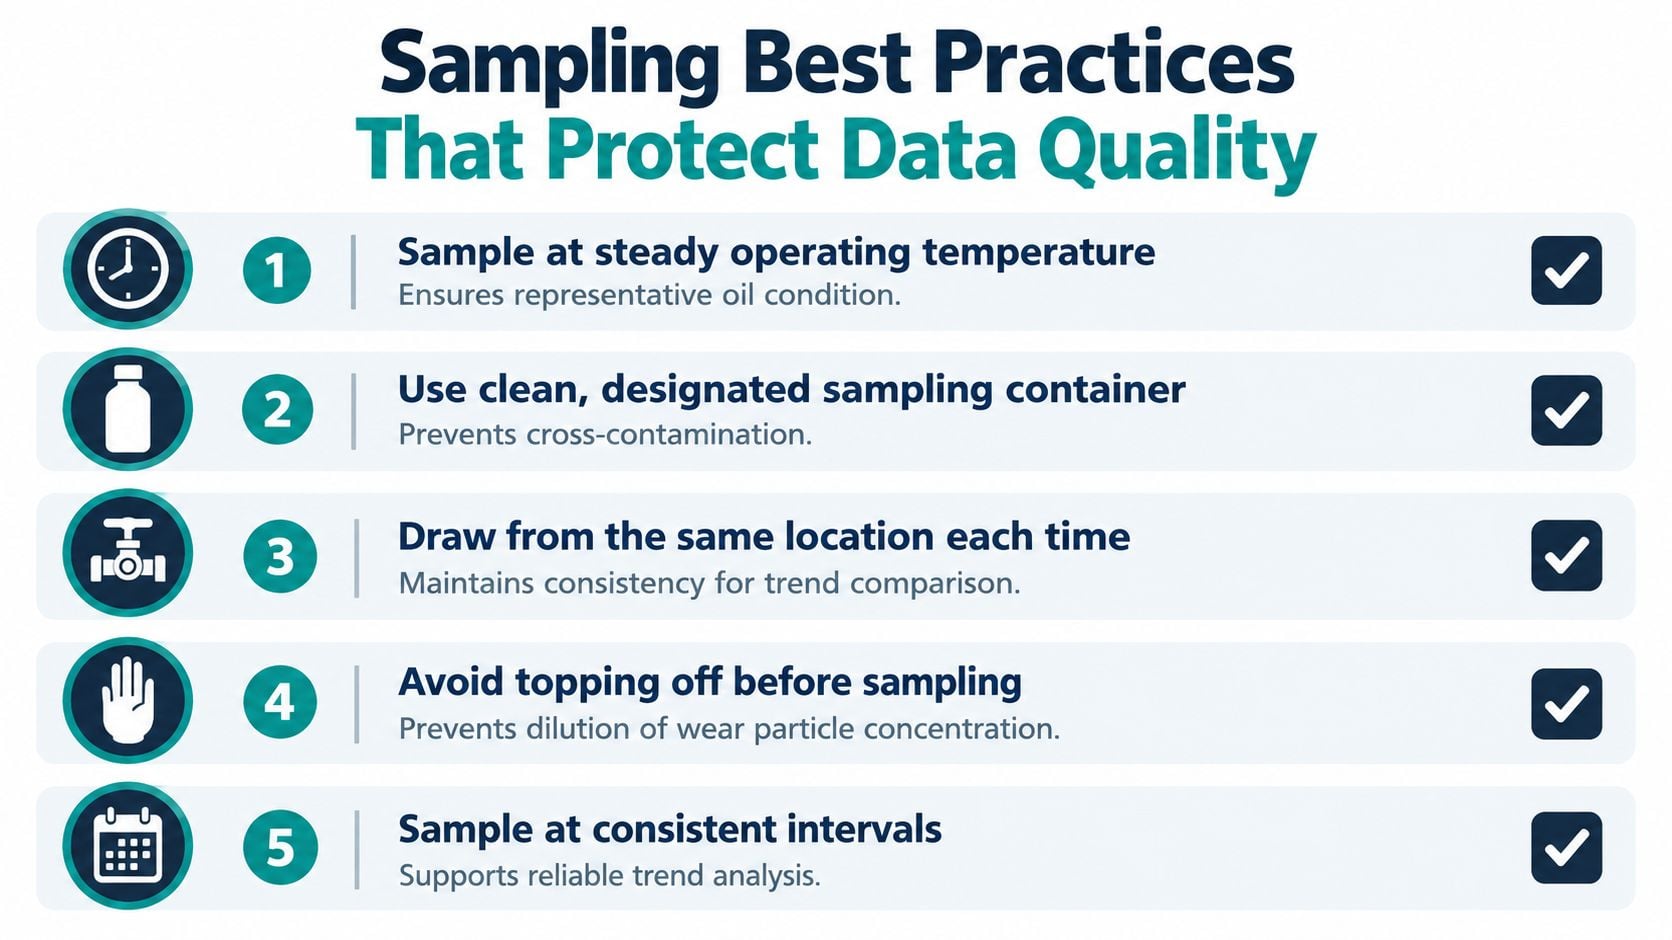
The following checklist supports the collection discipline needed before any of these results can be trusted.
The test package should leave the engineer with a narrower diagnosis, not merely a longer report. Where results remain ambiguous, targeted follow-up testing is more useful than automatically repeating an unchanged routine package.
Sampling Best Practices That Protect Data Quality
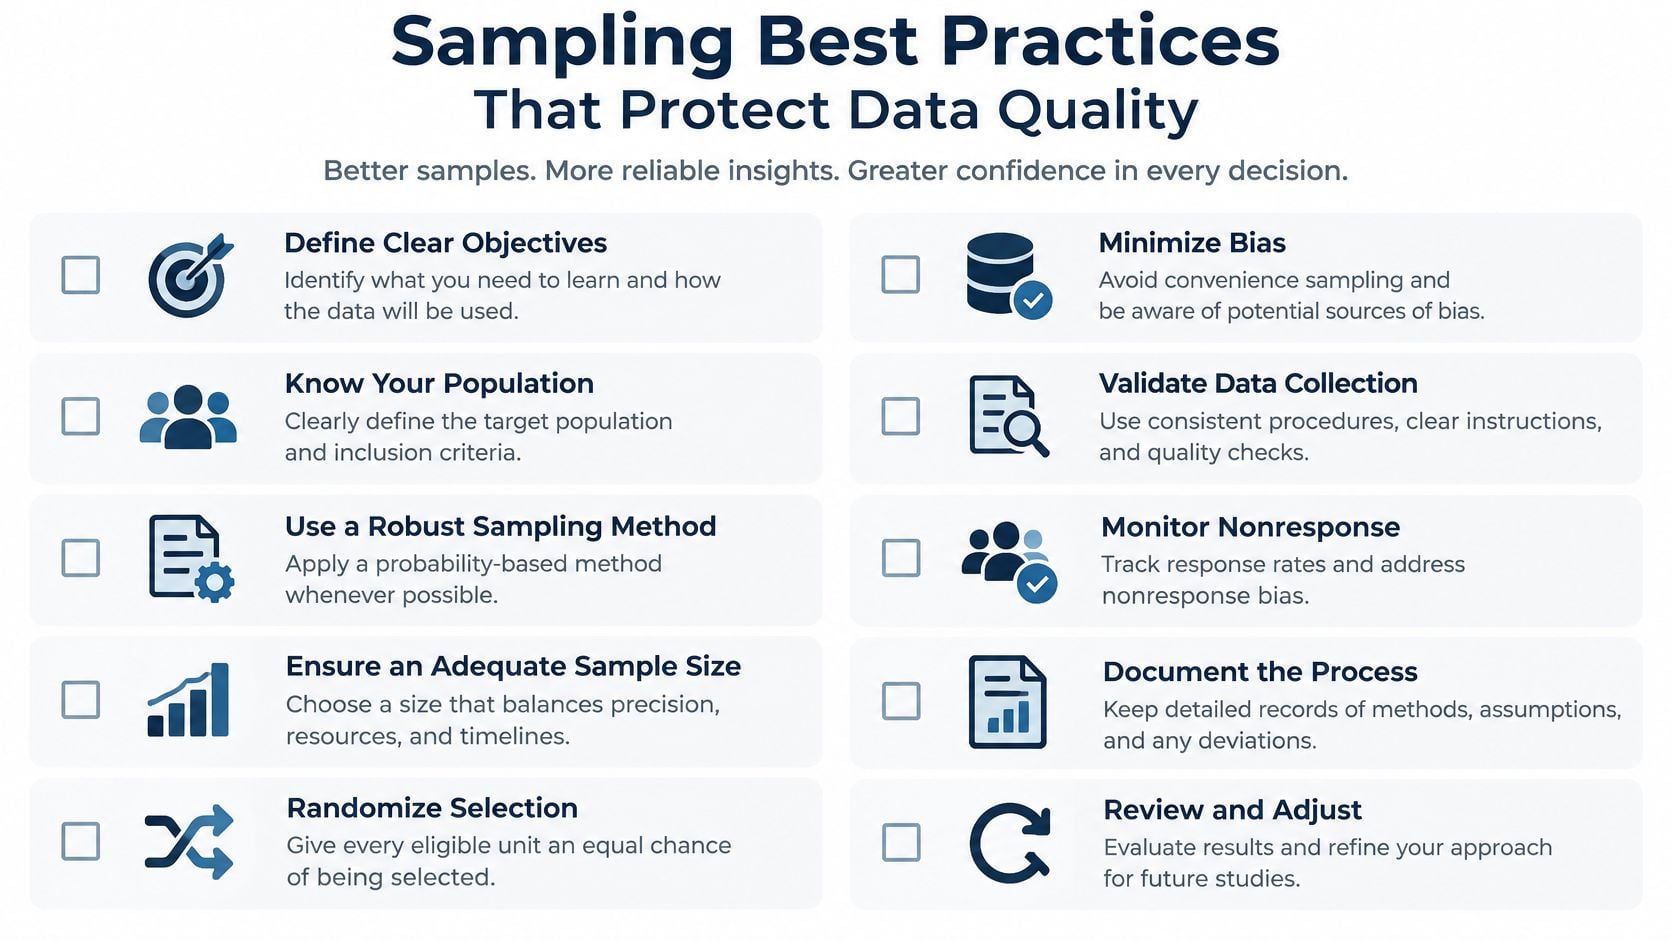
A laboratory can accurately measure an unrepresentative sample. Precision doesn't correct oil collected from a drain pan, a different circuit location, or a machine operating under an unfamiliar condition.
For a hydraulic press, the sampling procedure should identify the exact port and operating state. Otherwise, technicians may compare oil from different parts of the circuit and interpret the difference as deterioration.
Establish a repeatable collection procedure
- Select a representative location. Use a live, turbulent zone upstream of the return filter or a suitable dedicated sampling port. Don't substitute a drain-pan sample for a circulating-oil sample.
- Control operating conditions. Collect at a consistent, steady operating temperature and record unusual loads or recent shutdowns.
- Protect the container. Use clean, designated bottles and handling practices that prevent contamination during collection.
- Preserve the concentration context. Avoid topping off immediately before sampling when practicable. If oil has been added, document it rather than concealing the dilution.
- Use consistent intervals. Tie the schedule to operating exposure and equipment risk, then shorten it deliberately when investigation requires closer observation.
The collection checklist should be available with the sampling work instruction, not stored separately from the route.
Interpret hydraulic cleanliness at the correct location
ISO 4406 expresses hydraulic-fluid cleanliness through particle-concentration codes. Under the referenced ISO 4406:1999 convention, the code represents cumulative concentrations at approximately ≥4, ≥6, and ≥14 micrometres, and each code increase represents approximately a doubling of particle concentration, as explained in this ISO 4406 particle-counting reference.
That makes location consistency consequential. A sample taken after filtration answers a different question from a sample intended to represent contamination circulating back from the machine. Neither location should be substituted for the other.
The procedure should also define what happens when collection deviates from the standard. A damaged bottle, unidentified port, or missing operating history warrants a qualification on the result and, where necessary, a replacement sample.
Sampling quality belongs in the maintenance procedure, not in assumptions made after an alarming report arrives.
On the hydraulic press, a suspect cleanliness result should first prompt confirmation that the collection method was valid. Corrective work based on an unexplained sampling difference can consume labor without improving the circuit.
Interpreting Wear Signatures Across Equipment Types
The same laboratory flag can mean different things on different machines. Interpretation should start with the component materials, lubricant circuit, operating duty, and credible failure modes, not with a generic list of metal limits.
A failure mode is the specific way a component loses its intended function. Abrasive wear, bearing fatigue, and lubricant oxidation require different corrective actions, even when they appear together.
Separate contamination from active wear
For a conveyor or mill gearbox, particle counting and ferrous-wear measurement answer different questions. Particle counters commonly report ranges greater than 4, 6, 14, 25, 50, and 100 micrometres; they don't identify whether the debris contains iron, as described in this gearbox oil-analysis and contamination-control reference.
High counts with low ferrous density can support an ingress investigation. Increasing ferrous density with large, striated, or fatigue-shaped debris supports concern about gear or rolling-element distress. Ferrous density describes the concentration of iron-containing debris; fatigue is progressive damage under repeated loading.
The distinction matters because filtration alone won't repair a damaged contact surface. Conversely, opening a gearbox without investigating its contamination source can leave the cause of repeated damage intact.
Oil Analysis Parameter Combinations and Likely Failure Modes
| Parameter Trend | Likely Interpretation | Recommended Action |
|---|---|---|
| Silicon and particle counts rising together | Possible dirt ingress or ineffective filtration | Inspect breathers, seals, handling practices, and filtration |
| Iron increasing with large ferrous debris | Active wear of steel components | Examine debris severity and inspect the implicated components |
| Copper or lead increasing | Possible bearing or bushing distress | Check installed materials and investigate loading and lubrication |
| Viscosity increasing with deteriorating chemistry | Possible oxidation, contamination, or thermal degradation | Review lubricant condition and operating temperature |
| Wear-metal result changing without corroborating evidence | Sampling variation or an unresolved event remains possible | Verify collection history and obtain targeted confirmation |
Apply equipment-specific boundaries
Pumps and hydraulic systems require particular attention to contamination entry and lubricant supply. Before assigning a wear-metal increase to a pump, the engineer should establish which components share the sampled reservoir.
Compressors require separation of lubricant deterioration from mechanical wear. A chemistry problem should prompt review of temperature, contamination, and lubricant suitability, while severe debris requires a component-focused investigation.
Motors belong in an oil-analysis program only where a relevant oil-lubricated bearing system exists. Results from an associated gearbox shouldn't be treated as direct evidence of motor condition.
For turbines, lubricant-condition evidence must remain distinct from evidence of mechanical distress. The response may concern moisture control or oxidation rather than immediate bearing replacement.
Finally, review rate of change, not just the alarm color. A rapid departure from an established baseline deserves investigation even before a general limit is exceeded; the oil-analysis guidance on rate-of-change monitoring identifies applications including wear metals, particle counts, ferrous density, and acid number.
Where bearing distress is suspected, connecting debris findings to credible bearing failure mechanisms helps define an inspection that can confirm or reject the diagnosis.
Route-Based Versus Continuous Oil Monitoring Programs
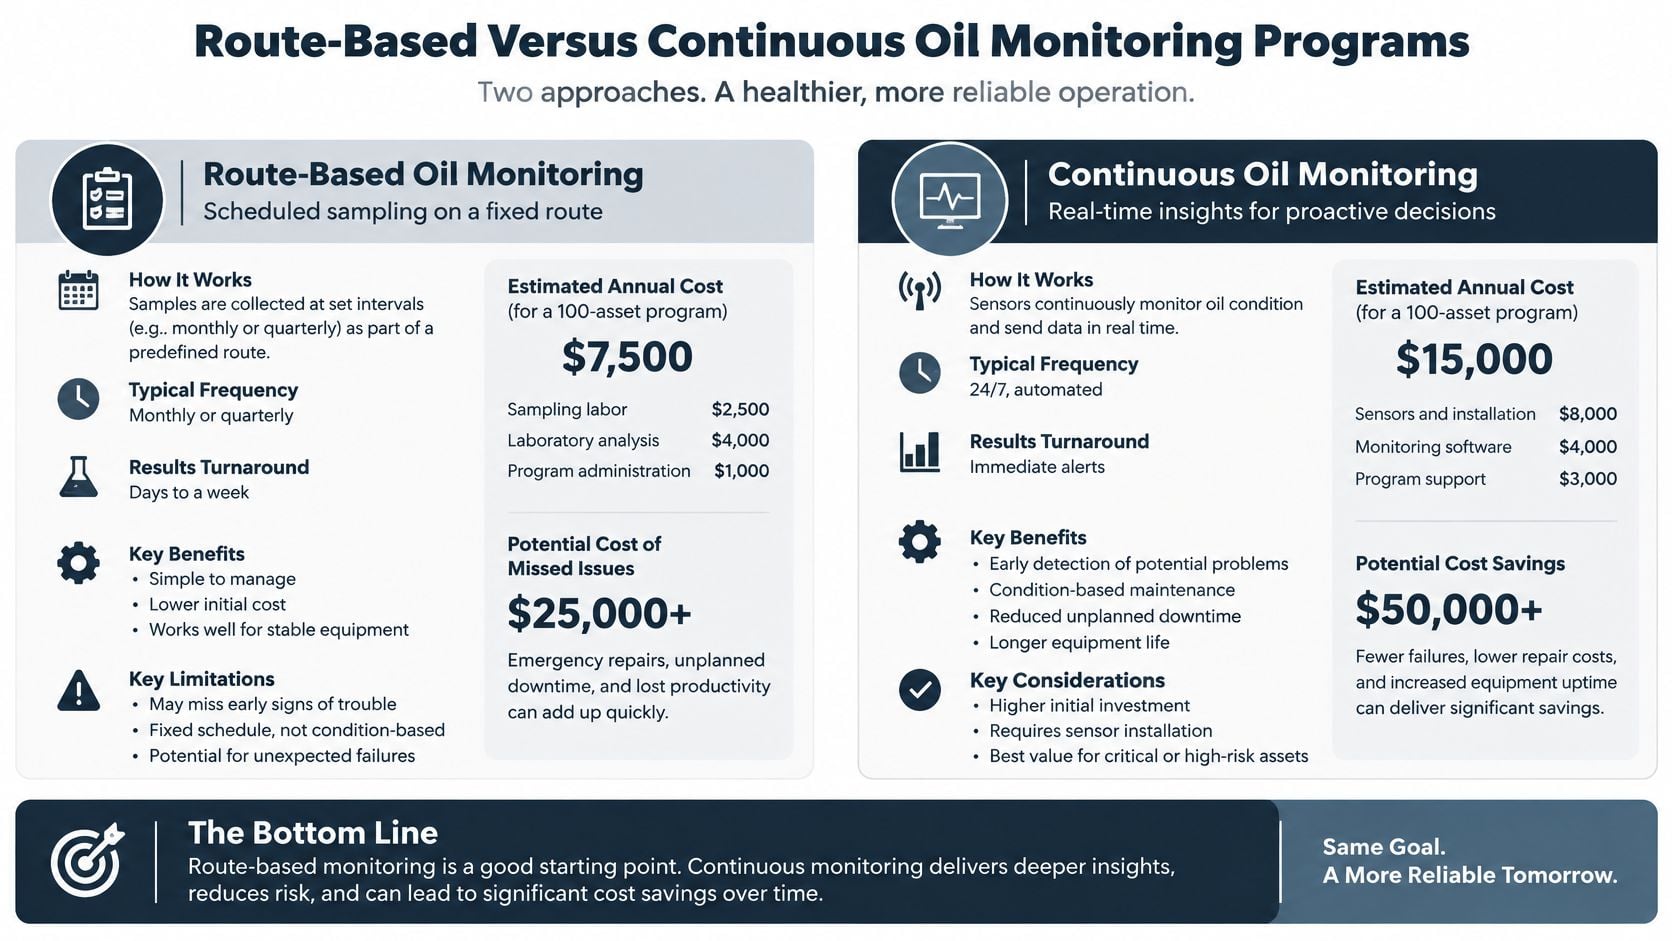
The architecture decision is about how often evidence is needed, not which technology sounds more advanced. A scheduled route can be appropriate for a stable, accessible asset. A critical machine with little operational redundancy may justify measurements between laboratory samples.
Route-based sampling means a technician collects samples on a planned schedule. Continuous monitoring uses installed instrumentation to track selected properties during operation. Neither approach removes the need for interpretation or a defined response.
The comparison below provides a starting point for selecting the collection architecture.
Choose coverage around the operational risk
| Decision Factor | Route-Based Approach | Continuous Approach |
|---|---|---|
| Evidence needed | Periodic samples with a selected laboratory package | Frequent measurements of installed sensor parameters |
| Implementation burden | Sampling access, technician time, and laboratory coordination | Installation, instrument upkeep, and data management |
| Main limitation | Changes between collection events may go unobserved | Sensor coverage may not resolve the underlying failure mode |
| Useful application | Stable equipment with manageable failure consequences | Critical equipment requiring closer observation |
A hybrid program is often the practical recommendation: route sampling for diagnostic depth and installed monitoring where the operating risk warrants closer attention. The plant must still assign someone to review changes and initiate work.
A turbine needs parameter-specific decisions
For steam- and gas-turbine oils, the ASTM D4378-based turbine-oil monitoring guidance identifies warning conditions including a viscosity change of approximately ±5%, water at 1,000 ppm or 0.1%, and a total-acid-number increase of 0.3–0.4 mg KOH/g above new oil; it also identifies 25% of the new-oil RPVOT value as a lower limit for replacement planning.
Total acid number, or TAN, measures acidic constituents using milligrams of potassium hydroxide equivalent per gram of oil. RPVOT, the Rotating Pressure Vessel Oxidation Test, assesses remaining oxidation-resistance reserve.
Those are separate measurements with different diagnostic roles. A general oil-quality sensor shouldn't be assumed to measure TAN or RPVOT directly. On a power-generation turbine, installed moisture monitoring could prompt a cooler-leak investigation, while laboratory chemistry establishes whether oxidation reserve is deteriorating.
A less critical pump may need no comparable installed system if its sampling interval and response arrangements provide adequate coverage. The specification for condition monitoring systems should therefore identify required parameters, actionable changes, and response ownership before hardware is selected.
Laboratory Analysis Versus Onsite Instrumentation
Collection frequency and analytical capability are different decisions. A plant can collect frequent samples but perform only narrow screening, or collect less frequently and obtain a broader diagnostic package.
Laboratory analysis and onsite instrumentation should be compared by the questions they can resolve, the resources they require, and the time available for action. Neither deserves an automatic preference.
Compare diagnostic depth with decision speed
A laboratory can combine elemental analysis, detailed chemistry, and specialist debris examination. The trade-off includes sample handling, transport, reporting, and the delay before an engineer reviews the result.
Onsite instruments can provide a quicker local indication of selected conditions. A particle counter supports cleanliness checks; a ferrous-density instrument supports assessment of iron-containing debris. Neither measurement automatically identifies a particular damaged component.
| Consideration | Laboratory Analysis | Onsite Instrumentation |
|---|---|---|
| Diagnostic scope | Broader package, depending on ordered tests | Limited to available instruments and procedures |
| Cost structure | Recurring collection, transport, and testing costs | Equipment ownership, upkeep, training, and operator time |
| Interpretation | Access to specialist examination where arranged | Depends heavily on local capability |
| Suitable role | Root-cause investigation and lubricant-condition assessment | Screening, maintenance verification, and local follow-up |
The financial comparison should include more than instrument purchase price or laboratory invoice totals. An onsite instrument that produces uncertain readings can create repeat work; an external report reviewed too late can miss the planning opportunity.
Use a paper-mill bearing system to define the split
For a paper mill's circulating-oil bearing system, a practical arrangement is onsite ferrous-debris screening with scheduled laboratory examination of the broader lubricant condition. This is a proposed operating model, not a claimed plant result.
The onsite reading should determine the next diagnostic step, not substitute for the entire diagnosis. If local screening indicates a change, the engineer can request microscopy, inspect lubricant delivery, and coordinate a mechanical assessment before choosing the repair scope.
Faster information is useful only when the plant can make a better decision before the next reporting interval.
- Retain competency. Assign instrument checks, operator training, and result review explicitly.
- Maintain comparability. Document method changes and avoid combining unlike measurements into a single unexplained trend.
- Verify the correction. Use the appropriate test to confirm that filtration, contamination control, or lubricant work achieved its intended result.
The right mix depends on whether local staff can act on the information. Where that capability is limited, a disciplined laboratory program with clear engineering support may be more effective than additional onsite equipment.
Setting Alarm Thresholds and Measuring Program ROI
An alarm is a trigger for a defined response, not an automatic instruction to change oil or dismantle equipment. Thresholds should combine equipment-manufacturer requirements, lubricant limits, asset history, and the consequence of being wrong.
Absolute limits establish boundaries. Rate-of-change rules identify departures from the asset's established behavior. Neither should override a credible indication of immediate mechanical danger.
Assign actions to the evidence
The response playbook should distinguish operating permission from lubricant replacement and mechanical intervention.
- Continue with surveillance. Appropriate when the evidence is consistent with stable condition, no immediate danger is indicated, and the responsible engineer defines the follow-up.
- Correct contamination or lubricant condition. Appropriate when the lubricant requires treatment or replacement and the team has identified how to address the source.
- Plan component inspection. Appropriate when confirmed debris or correlated mechanical evidence supports developing wear.
- Escalate for shutdown review. Appropriate when the severity, corroborating evidence, and failure consequence make continued operation unacceptable. Teardown should answer a defined mechanical question.
Before applying those actions, the reviewer should verify sample identity, account for operating hours and load, check recent maintenance, and specify the next observation point. The work record should state who can authorize continued operation and what evidence would reverse that decision.
Avoid overreacting to an isolated metal result
A 2026 operational case using OSA-CBM, an Open System Architecture for Condition-Based Maintenance, reported stable iron and chromium alongside an isolated aluminum spike with a risk index of 3.20; the authors interpreted the uncorroborated spike as episodic contamination or a transient event rather than progressive wear in the condition-monitoring operational case.
That case supports contextual interpretation, not a rule that aluminum spikes are harmless. The risk index is specific to the case's method and shouldn't become a universal plant alarm threshold.
Measure decisions rather than report volume
Program performance should track unplanned downtime, repeat failures, mean time between failures, corrective-work completion, and unnecessary lubricant replacement. Mean time between failures describes operating time between failures for a defined asset population and failure definition.
For financial evaluation, return on investment compares attributable avoided costs with total program costs. Include sampling labor, analysis, instruments, engineering review, and corrective work, while distinguishing documented savings from uncertain counterfactual estimates.
An avoided failure shouldn't be booked as a certainty merely because an alarm occurred. Stronger evidence includes confirmed defects, a documented intervention, and a credible estimate of the consequence avoided. Connecting these records to overall equipment effectiveness improvement keeps the program focused on availability and production outcomes rather than the number of samples processed.
Integrating Oil Analysis With PdM and CMMS Workflows
Predictive maintenance, or PdM, uses condition evidence to anticipate maintenance needs. A computerized maintenance management system, or CMMS, organizes asset records, work orders, and maintenance history. Oil analysis contributes only when the team connects those systems to an accountable decision process.
For a compressor, start by defining the monitored failure modes and the evidence needed for each. Then align oil collection, vibration measurements, operating load, and temperature records so the engineer compares observations from relevant operating conditions.
Reconcile oil and vibration rather than choosing a winner
Sensor fusion means interpreting different measurement streams together. Research into integrated gearbox oil-quality and vibration monitoring supports combining oil-condition measurements with mechanical monitoring rather than treating them as competing programs.
On the compressor, increasing iron with unchanged vibration may warrant investigation of early abrasive wear. Increased vibration without changed debris may direct attention toward imbalance, misalignment, resonance, or another non-lubrication fault. Resonance occurs when excitation interacts with a system's natural frequency and produces an amplified response.
Discordant results shouldn't be averaged into a reassuring health score. The analyst should ask whether the instruments observe the same component, whether collection times and loads align, and whether either method is insensitive to the suspected failure mode.
Turn findings into closed-loop work
A useful CMMS asset-management workflow preserves the connection between evidence and action:
- Register the finding. Attach results to the correct asset and sampling point, retaining units, methods, and operating context.
- Record the interpretation. State the suspected failure mode, supporting evidence, uncertainty, and consequence.
- Assign the response. Identify the owner, priority, operating restrictions, and required completion window.
- Verify closure. Capture inspection findings and follow-up measurements, not a completed-work status.
For facilities teams coordinating the broader implementation, Facility Management Insights' practical guide for facilities professionals provides an additional implementation resource. The plant-specific requirement remains a clear handoff from condition assessment to maintenance planning and operations.
Closure should also improve the diagnostic process. If inspection contradicts the original interpretation, the engineer should update the asset's decision rules rather than repeat the same assumption on the next report. That feedback makes predictive maintenance oil analysis an engineering practice, not a recurring exchange of samples and PDFs.
Forge Reliability offers oil-analysis programs, vibration monitoring, and reliability engineering support to connect lubricant results with equipment-specific maintenance decisions. Request a free reliability assessment to review critical assets, sampling practices, and escalation rules for continued operation, lubricant replacement, or mechanical inspection.