The route sheet lists 34 assets this week. Three of them haven't produced a meaningful vibration change in two years, one oil sample comes back identical to the last four, and the cooling-water pump on the reactor jacket has been drifting upward since its last mechanical seal change. Nobody has pulled that trend because the number hasn't crossed the alarm line yet. So the pump stays on the route, the three quiet assets stay on the route, and the planner keeps scheduling the same work orders.
Most plants don't have a monitoring problem. They have a decision problem. Readings arrive, land in software or a spreadsheet, and stop there because nobody defined which measurement changes which work order and by when. That gap is where condition based monitoring either earns its budget or becomes another subscription.
The sections below work through the practical version: what each signal can separate, why a fixed interval misses the majority of failures, how to read the numbers against real screening bands, how to set frequency from the failure itself, and how to count avoided loss instead of alert volume.
Table of Contents
- Signals That Should Change the Work Order
- Why a Calendar Misses Most Failures
- Reading Vibration Oil Heat and Ultrasound
- How Often to Monitor and What Happens Next
- Cooling Water Pump Calls That Go Wrong
- Proving Value Before You Add Sensors
- Request a Free Reliability Assessment
Signals That Should Change the Work Order
A cooling-water pump serving a reactor jacket shows rising vibration at the drive-end bearing. The route technician also collects an oil sample and scans the motor terminal box with an infrared camera. Each check earns its place when the result identifies a failure mode and changes the maintenance action.
Condition based monitoring triggers maintenance from measured equipment condition, using signals such as vibration, oil chemistry, temperature, ultrasound, or electrical signature. The output is a work order with a part name, a craft, and a date.
Vibration Names the Part
Vibration can help identify which component needs attention. A dominant running-speed component points to imbalance, so the work order calls for balancing. Harmonics can indicate misalignment or mechanical looseness, directing the job toward alignment or tightening. Bearing and gear defects produce characteristic frequency families. Name the affected bearing or gear in the work order rather than scheduling a generic overhaul.
Cavitation and flow turbulence produce different vibration patterns. Those findings call for a hydraulic investigation, not an automatic mechanical repair. Matching the job to the failure mode avoids sending a pump for overhaul when alignment is the needed correction.
Oil, Heat, and Ultrasound Close the Gaps Vibration Leaves
Oil analysis measures wear metals, contamination, water, and viscosity. A sample with normal viscosity and no concerning wear or contamination can support deferring a calendar-based oil change. High iron or a viscosity shift warrants an inspection of the wear source and, where the sample supports it, an oil change or flush.
Infrared thermography can flag hot electrical connections, unbalanced load, or abnormal mechanical heat. Interpret the temperature in context, then assign a repair or investigation before the next period of high load or ambient temperature. Ultrasound detects compressed-air and steam leaks, early bearing friction, and electrical discharge. Attach an energy cost estimate to leak repairs so planners can prioritize them. Bearing noise should prompt a lubrication check before parts are ordered.
Use this table as a starting point for linking signals to actions, then adjust the response to the asset.
| Technique | Failure modes it separates | Do not treat the reading as | Maintenance response |
|---|---|---|---|
| Vibration | Imbalance, misalignment, looseness, bearing and gear defects, cavitation, turbulence, resonance | A single overall velocity alarm | Balance, align, tighten, investigate hydraulics, or repair the named bearing or gear |
| Oil analysis | Wear debris, contamination, viscosity loss, lubricant breakdown | An automatic calendar drain | Change or flush when the sample supports it, and inspect the wear source |
| Infrared thermography | Hot electrical connections, unbalanced load, abnormal mechanical heat | A hot spot without load or ambient context | Repair the connection or trace the mechanical heat source before peak load |
| Ultrasound | Compressed-air and steam leaks, early bearing friction, electrical discharge | A leak list with no energy value | Prioritize leaks by energy cost, check lubrication, then use vibration analysis if needed |
Overall velocity is a screening signal, not a diagnosis. The spectrum, phase reading, oil result, and machine history help determine whether an alert warrants a specific repair. Work orders should carry those findings into planning, so the crew knows what to inspect, what work to perform, and when. Clear work order management connects condition findings to scheduled action; another sensor adds little when no one has defined what to do with its signal.
Why a Calendar Misses Most Failures
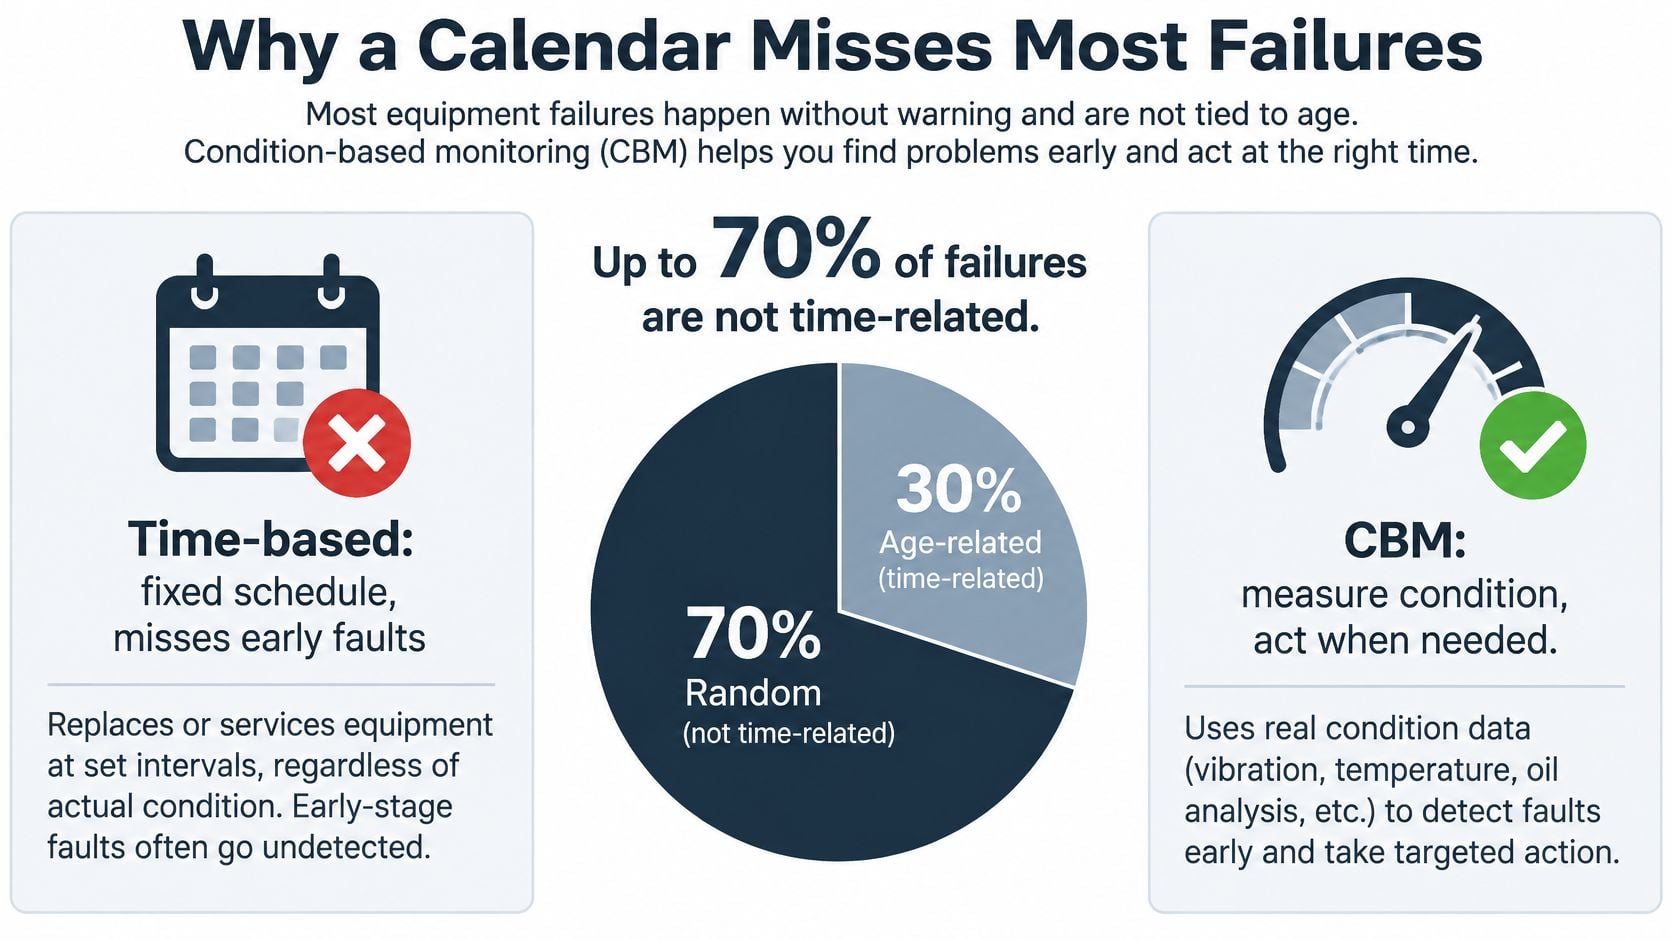
The failure data itself makes the case against fixed intervals. A U.S. Department of Energy study summarized in Deloitte's predictive maintenance briefing reports that only 11% of failures are age-related. The briefing says the remaining 89% of failures can occur at random, outside the reach of a schedule based only on elapsed time. It also reports that approximately 50% of time-based maintenance activity is ineffectual, using labor, parts, and production availability without addressing an active failure mechanism.
The same briefing reports program averages of around a 10-times return on investment, a 20 to 25% increase in production, 30 to 40% savings opportunities, a 35 to 45% reduction in downtime, 70 to 75% elimination of breakdowns, and a 25 to 30% reduction in maintenance costs. These are reported averages, not forecasts for an individual plant. Results depend on asset criticality, sensor quality, alarm governance, technician competence, work-order execution, and whether a detected defect becomes planned work.
The tire test: changing oil because the calendar says so is like scrapping a tire because the odometer rolled over. Tread depth is condition data; the odometer is only a guess about wear rate.
What Stays on the Calendar
Keep preventive tasks for items with well-characterized wear curves, such as motor brushes and packing seals, and for failure modes that condition monitoring cannot practically detect in time. The choice depends on whether degradation produces a useful signal and leaves enough lead time to plan a repair.
Forge Reliability reports that 40 to 60% of PM tasks have a condition-based alternative. The remaining tasks still need a defined preventive basis, not automatic removal from the schedule. The comparison of predictive and preventive maintenance helps frame which approach fits each task.
Prioritize assets by consequence: safety exposure, environmental release, quality loss, production bottlenecks, or expensive secondary damage. Condition-based monitoring earns its cost when the degradation path is detectable, the warning arrives early enough to act, and avoiding the failure matters more than generating another alert.
Reading Vibration Oil Heat and Ultrasound
A pump can show an acceptable overall vibration level while a bearing fault is developing. The time waveform records the machine's motion; a fast Fourier transform separates it into frequency components. Read the spectrum to identify where energy is concentrated and whether new peaks or sidebands are emerging, rather than treating a single overall value as a diagnosis.
The Bands Are a Screen, Not a Diagnosis
NASA's rotating-equipment vibration guidance sets screening bands in inches per second. Interpret them alongside machine type, speed, mounting, and the pump's baseline.
| Band | Overall velocity | Condition meaning | Maintenance response |
|---|---|---|---|
| Good | Below 0.10 in/s | Good operating condition | Continue the routine route |
| Satisfactory | 0.10–0.20 in/s | Satisfactory | Trend against the machine baseline |
| Life extension | 0.20–0.35 in/s | Corrective action needed to extend life | Plan the named correction |
| Unsatisfactory | 0.35–0.50 in/s | Mechanical wear | Schedule repair soon |
| Severe | Above 0.50 in/s | Severe wear | Correct promptly |
NASA's rotating-equipment vibration guidance gives high-frequency screening ranges of 5 to 2,500 Hz for machines at or below 1,800 rpm and 5 to 5,000 Hz above 1,800 rpm. These spectra can reveal bearing, gear, rotor, and stator problems while overall velocity remains within the satisfactory band.
The Clue That Changes the Repair
Read a spectrum by checking which peaks stand above the background, whether they repeat at regular intervals, and whether sidebands cluster around a main frequency. For rolling-element bearings, envelope analysis can expose repetitive impacts that are difficult to distinguish in the overall velocity reading. Confirm a suspected change against the machine's baseline and, where useful, with phase measurements before specifying the repair.
Oil analysis helps distinguish wear from contamination or lubricant breakdown. Wear metals can support a diagnosis of component wear; water or dirt points to contamination; a viscosity change can indicate that the oil film is no longer providing the expected protection. Use oil sampling and analysis with fixed sample points and recorded operating conditions so results remain comparable.
Infrared imaging can identify a hot motor terminal that calls for electrical inspection. Vibration data alone cannot diagnose that fault. Ultrasound can help identify changes associated with lubrication, but treat a rising reading as a prompt to inspect and confirm, not as a repair order by itself.
Repeat readings at consistent speed, load, and valve position. A trend gives the maintenance team evidence to schedule an inspection or repair; a single snapshot may only prompt more questions.
How Often to Monitor and What Happens Next
Frequency is a derived number, not a preference. It comes out of how fast the failure develops and how much warning the plant needs to plan parts, labor, and access.
Map the Failure Mode Before Choosing Hardware
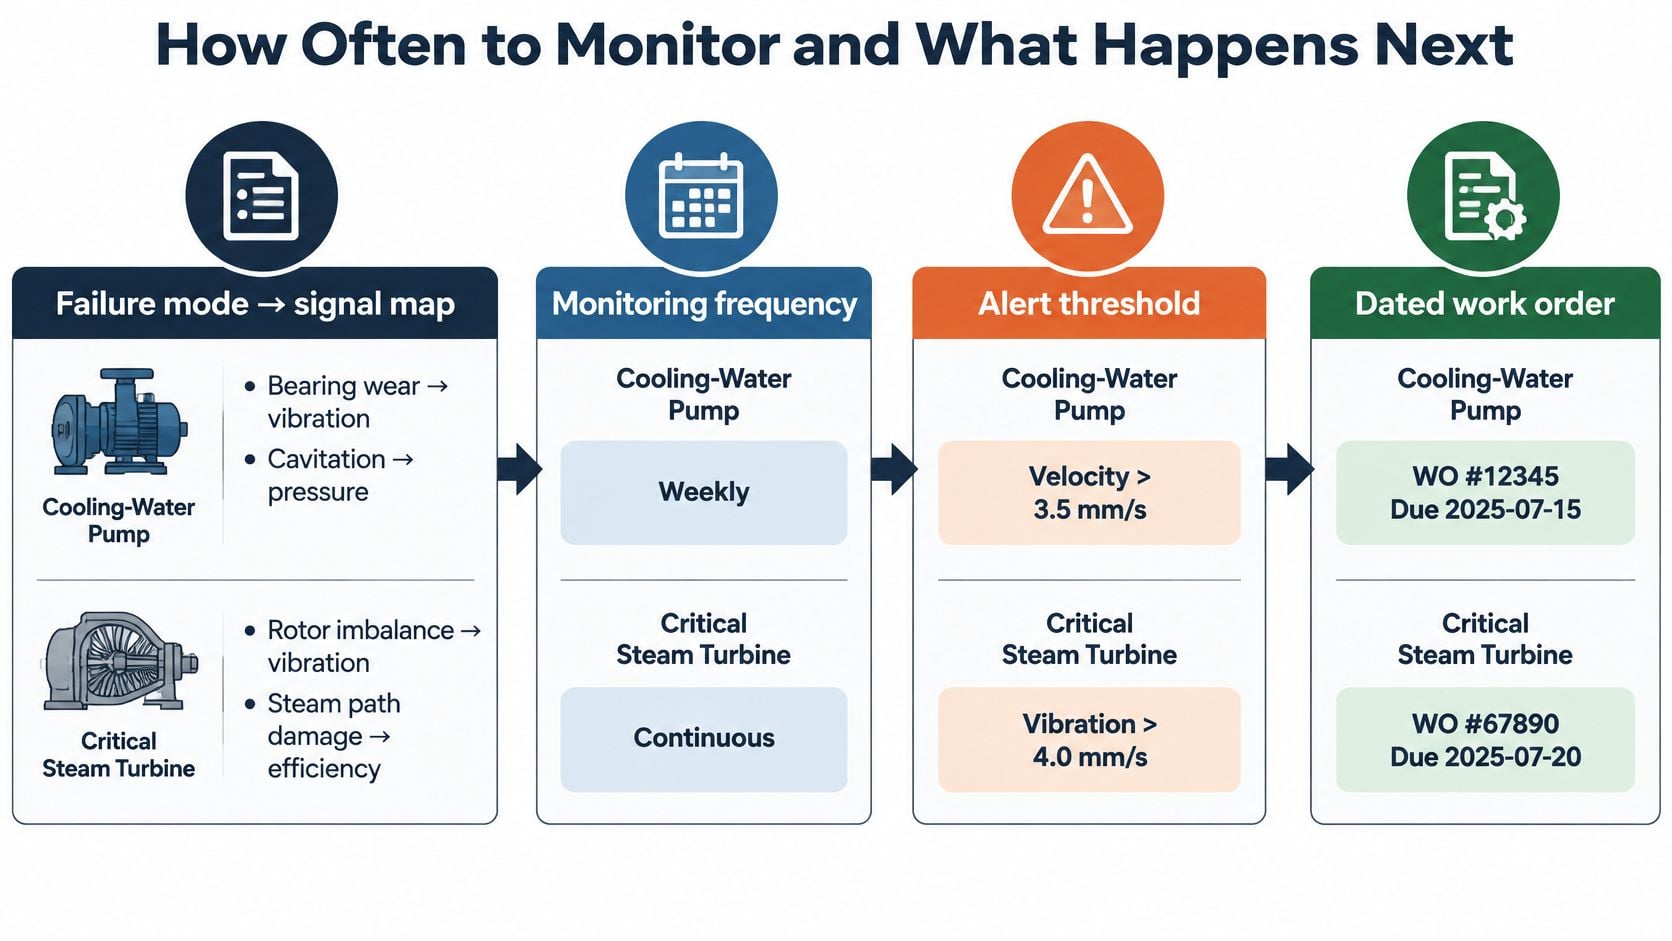
For a critical cooling-water pump and motor train, the map is short. Bearing fatigue is tracked through high-frequency acceleration and envelope spectra. Lubricant contamination or viscosity loss is tracked through oil analysis and temperature. A hot connection is tracked through infrared. A leaking steam trap or air line is tracked through ultrasound. For a critical steam turbine, the same logic applies to rotor dynamics and steam path efficiency, with continuous vibration monitoring at all bearing locations the practical choice where a trip would take the plant down.
Alarm limits come from the asset baseline, the operating load, sensor placement, data quality, and the consequence of failure. A catalog default will produce alarms that nobody trusts, and an alarm nobody trusts gets muted within a month.
Four Steps From Reading to a Dated Work Order
- Detect the change against the machine's own baseline, not against the fleet average.
- Confirm it with a phase reading or a second technology, because a single technique can be fooled.
- Judge whether functional failure is likely inside the planning window, which is the question that converts data into urgency.
- Release a predefined work order that already names the parts, the craft, and the access requirement, so approval doesn't restart the clock.
Derive the Interval From the P-F Interval
The P-F interval is the time between the first detectable sign of degradation, the potential failure, and functional failure. Route frequency has to put at least one reading inside that window, with margin. Shorten the interval when the trend slope starts consuming the available lead time, and lengthen it only after several clean cycles.
For steam turbines, critical units typically need monthly condition monitoring, while non-critical units can follow a quarterly interval. Work is then aligned with mill turnaround cycles so turbine work completes inside the scheduled outage window instead of forcing a trip. Every new task should carry defined measurement points, alarm thresholds, a frequency tied to the P-F interval, and a written action for each threshold, entered in the CMMS as a route or work-order template. An alert that lives only in an inbox is an alert that dies there.
Cooling Water Pump Calls That Go Wrong
Two weeks on one asset explains more than a chapter of theory. The asset is a motor-driven centrifugal cooling-water pump whose failure would stop circulation for the whole chemical plant.
Week One and the Bearing Replacement That Wasn't Needed
Overall velocity climbs from the satisfactory band into the range that calls for corrective work, landing around 0.28 in/s. The hurried call is to change both bearings over the weekend, which means an emergency pump-motor job, a crane, and a cooling outage.
The spectrum refuses that conclusion. The dominant component sits at running speed. Phase fits imbalance. There's no bearing defect family in the envelope data, oil comes back clean, the motor terminals look normal on infrared, ultrasound shows no electrical discharge, and the coupling guard is only mildly warm. The right job is balance and alignment at the next planned window.
NASA's reliability centered maintenance requirements make exactly this point: increased vibration on a centrifugal pump does not automatically justify bearing replacement, because a dominant running-speed component points toward imbalance while hydraulic instability symptoms point toward cavitation or flow turbulence. The practice is to compare each reading with the machine baseline, identify the component producing the signal, and weigh both magnitude and rate of deterioration.
Week Two and the Strainer That Looked Like a Bearing
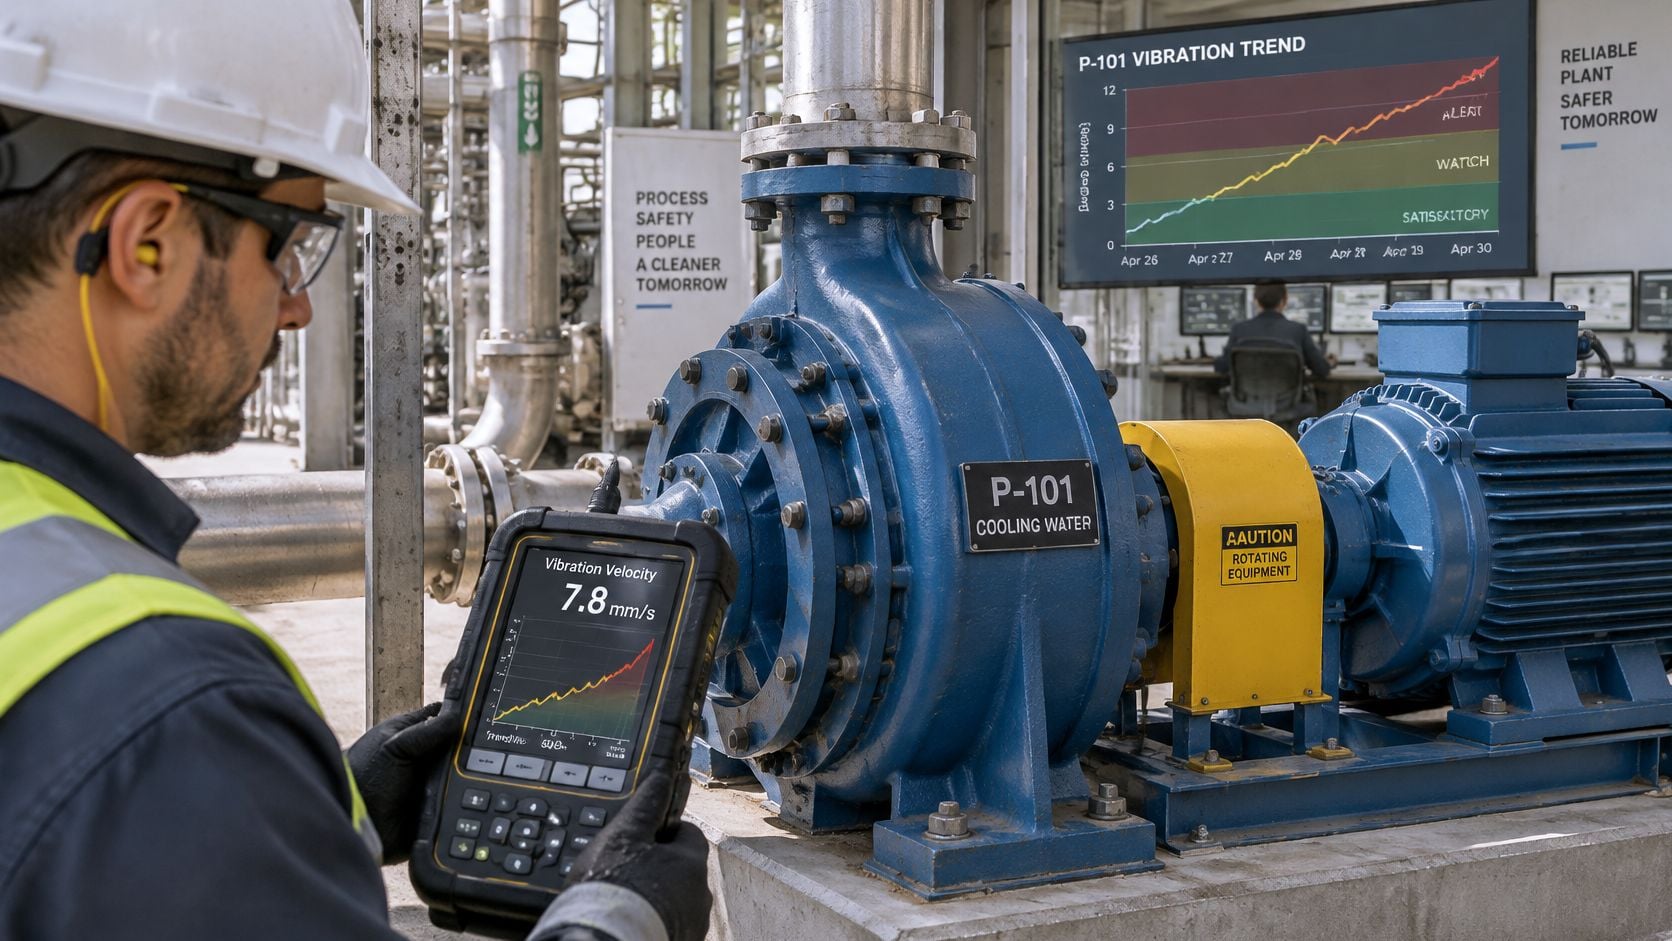
A week later the suction strainer plugs, flow becomes unstable, and the vibration signature turns broadband. That pattern fits cavitation or flow turbulence, so the work is hydraulic: clear the strainer and confirm net positive suction head. Sending the rotating element out for overhaul would have fixed nothing.
Correlation is what blocks the wrong part from being ordered. Vibration, oil, heat, and ultrasound together either support a mechanical diagnosis or they don't, and the disagreement is itself information.
If speed, load, and valve position weren't stored with the readings, neither week's call is trustworthy. Two data sets taken at different operating states can't be compared.
The practical result of doing this properly is planned labor, a balance weight, and a clean strainer, instead of an emergency pump and motor job with a cooling outage attached. Programs built around condition monitoring for centrifugal pumps live or die on exactly this kind of discipline.
Proving Value Before You Add Sensors
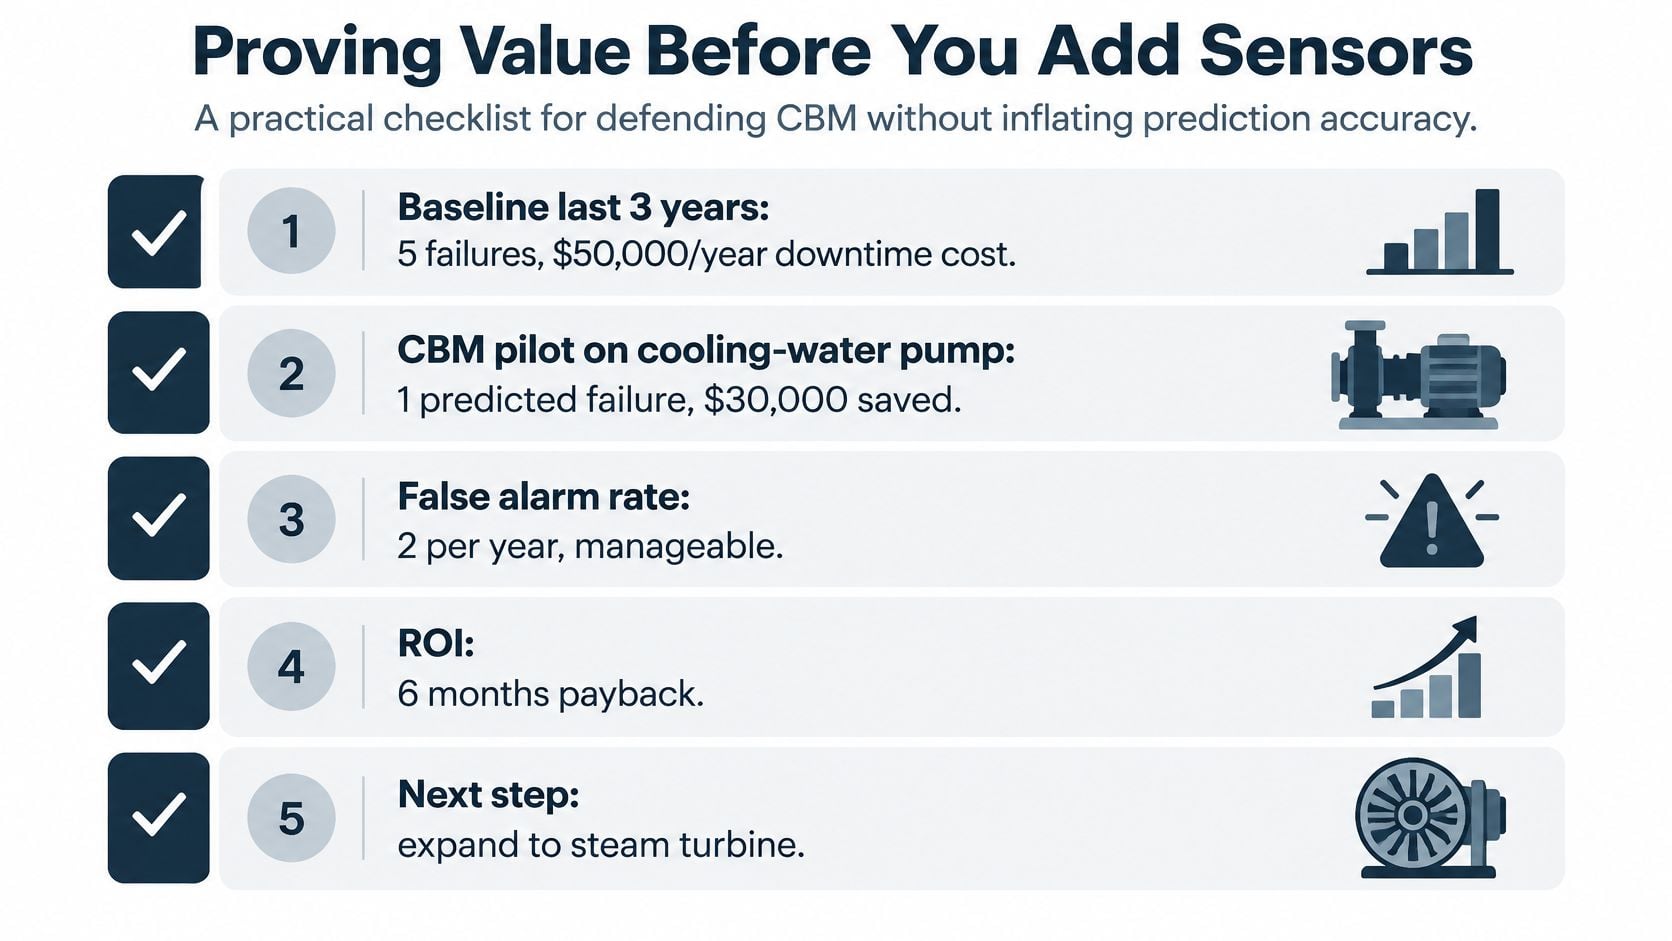
A borrowed savings percentage is a weak business case, and everyone in the room knows it. A 2025 systematic review from NIST found that relatively few evaluations address whole manufacturing systems, that studies use widely differing economic measures, performance metrics, and uncertainty analyses, and that industrial users reasonably hesitate to adopt condition-monitoring systems because standardized procedures for measuring avoided losses are lacking. Which means the number that matters is the one built from your own plant.
Three Buckets, Not One Percentage
Start with the cooling-water pump's own record for the last three years: failure count, downtime hours, repair cost, lost production, and energy impact. Then sort every subsequent event into one of three buckets. Either a defect was detected, a failure was avoided because lead time existed and the work order was completed, or a false alarm generated unnecessary work.
Only the middle bucket counts as avoided loss. Detection alone is an activity, and the third bucket is a real cost that belongs in the ledger rather than in a footnote.
Value should be calculated by criticality class, because a monitored asset with a low consequence of failure has little loss to avoid no matter how clean the trend looks. The strongest program doesn't maximize prediction coverage. It monitors assets where the consequence, a visible degradation path, and enough lead time to intervene all exceed the cost of collection and analysis. Reliability teams weighing where to start will find the asset-selection logic in predictive maintenance for mid-market manufacturers useful for framing the same trade-off.
Readiness Before Hardware
Before a single continuous sensor is installed, five items need to exist: a criticality ranking, failure history detailed enough to be usable, standardized tag names and operating-context fields, a named owner for every alarm, and a connection from alerts into planning and spare-parts decisions.
For plants where faults are infrequent, operating states shift often, or there's no analyst available to interpret alerts, a route of vibration, oil, thermography, ultrasound, or motor-current testing will outperform continuous monitoring. Lower data volume is a feature when nobody has time to triage it. Multi-site groups should hold one minimum data standard across sites and let each site set its own diagnostic limits.
Review the ledger quarterly as alarm quality and completed work accumulate, and let the results feed OEE improvement targets rather than sitting in a reliability folder.
Request a Free Reliability Assessment
A cooling-water pump may justify condition monitoring if bearing degradation produces a detectable signal early enough to schedule a repair before the pump affects production. Start by identifying assets where failure consequences, a detectable degradation path, and time to act make monitoring worthwhile.
For each candidate asset, check four things:
- A failure-mode-to-signal map linking credible failure modes to techniques that can detect them.
- Defined measurement points and conditions, including speed, load, and valve position, so trends can be compared.
- Alarm thresholds and a named owner responsible for evaluating each alert.
- A work order that fits the available lead time, with parts and craft identified.
If the work order cannot be planned and completed before failure, added sensors may produce alerts without preventing downtime.
Readiness test: Choose one asset and check these four items. If the work order cannot be defined, address the planning gap before adding instrumentation.
A no-cost reliability assessment from Forge Reliability reviews the equipment and facility, then recommends a suitable reliability program. The assessment can help determine whether route-based or continuous monitoring fits the asset and how to measure avoided downtime against the plant's baseline.
Forge Reliability combines vibration analysis, oil analysis, thermography, ultrasound, and motor current signature analysis in route-based and continuous programs. Its engineers can map failure modes to diagnostic methods, set alarm thresholds, and connect findings to actionable maintenance work. Request a free reliability assessment at Forge Reliability.