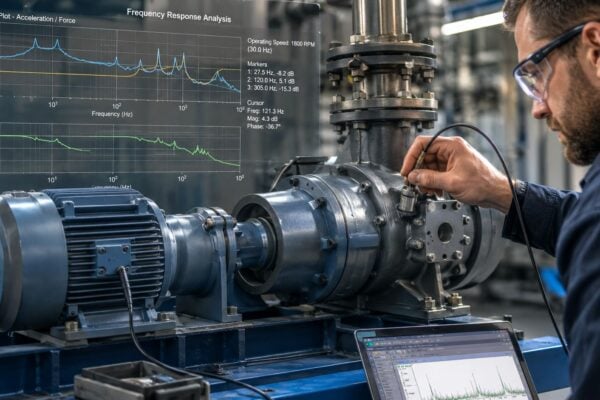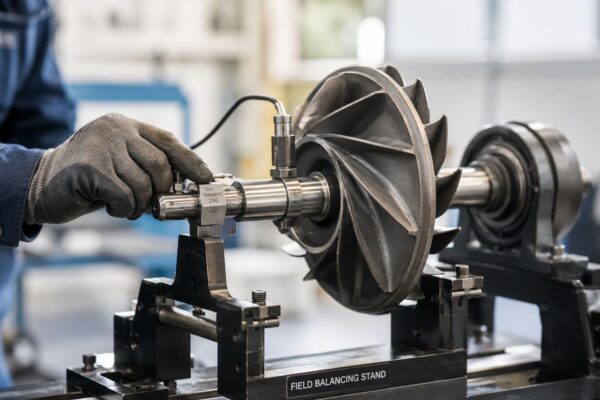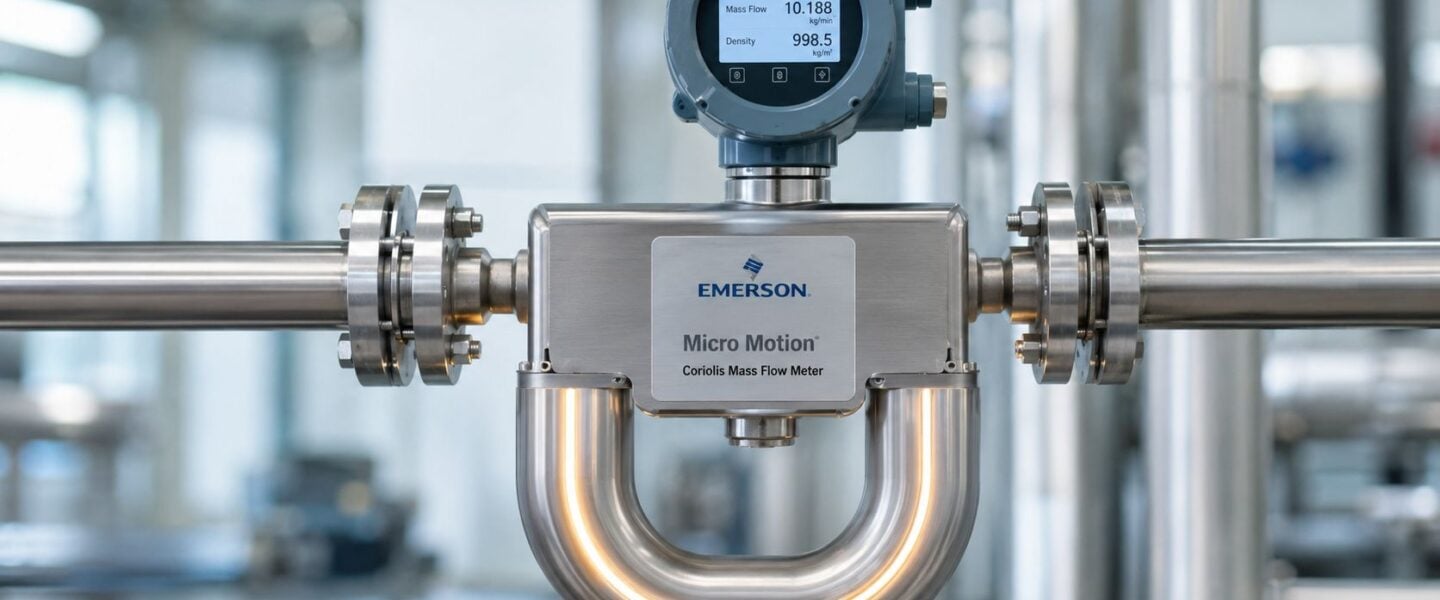
The batch looked fine on paper until the operators saw the numbers drift. A chemical dosing skid was feeding product, the pump was running, and the line still missed target. The first place a reliable team looks is not always the meter, but the Micro Motion Coriolis signal itself, because that signal often tells the story of a seal leak, flashing, entrained gas, or a process upset before anyone hears a bearing scream or a pump lose prime.
That's why the coriolis mass flow meter Emerson users rely on should be treated as more than an accounting device. In the field, it becomes a diagnostic asset. If the measurement starts to wander, the problem is often upstream, and the fastest fix is usually in the process, not the transmitter.
Table of Contents
- When a Coriolis Meter Becomes a Reliability Story
- How a Coriolis Mass Flow Meter Actually Works
- Inside the Emerson Micro Motion Model Families
- Sizing and Selection Decisions That Prevent Reliability Loss
- Installation and Commissioning That Stops Two-Phase Trouble Early
- Reading Drive Gain and Density as Process Health Signals
- Calibration, Verification, and Tying Coriolis into Predictive Maintenance
- Common Failure Modes and Your Next Reliability Move
When a Coriolis Meter Becomes a Reliability Story
A dosing skid on a chemical line is often the kind of asset that gets ignored until it misses a batch. The operator sees an off-spec blend, the planner sees a schedule slip, and maintenance gets pulled in after the fact. A Micro Motion Coriolis meter changes that sequence because the meter trend can point to the fault while the skid is still running.
On one skid, the earliest warning was a slow rise in drive gain. That reading told the team the tube driver was working harder to keep the meter vibrating, which is a clue, not a verdict. The seal on the upstream pump was starting to leak, vapor was getting into the line, and the meter saw the consequence before the pump fully failed.
Practical rule: If the meter trend changes before the batch quality does, treat the meter as the messenger, not the suspect.
That mindset matters in plants that need fast decisions, especially when a reliability team is trying to connect instrumentation data with rotating equipment behavior. A good starting point is to tie the flow trend to upstream asset health, not just to the instrument loop. For teams building that discipline into a broader program, operational AI for oil and gas is one example of how measurement data can be turned into decisions, but the same logic applies on chemical and food lines.
The value here is simple. Coriolis data is reliability data, because the meter sees the process state, not just the final count. That's why seasoned maintenance teams keep asking what changed in the pump, the seal, the suction conditions, or the fluid itself before they ask whether the transmitter is bad.
How a Coriolis Mass Flow Meter Actually Works
A Coriolis meter measures mass flow by vibrating a tube and watching how the moving fluid twists that vibration. The easy analogy is a vibrating hose or a skater spinning faster with arms pulled in. When fluid moves through the oscillating tube, the twist is proportional to mass flow, not just velocity.
The signals the transmitter is actually reading
The tube's motion gives the transmitter several useful clues. Pickoff sensors detect tube movement, tube frequency shifts with the amount of fluid in the tube, and the electronics calculate density from that frequency behavior. Drive gain reflects how much energy the meter needs to keep the tube vibrating, while zero stability describes how steady the reading stays when no flow is present.
Mass flow is measured directly, which is why these meters behave differently from volumetric devices that have to infer mass from assumptions about fluid properties. That distinction matters on chemical, food, and pharmaceutical lines where viscosity, composition, and temperature don't stay fixed. A Coriolis meter still needs a healthy installation and the right operating envelope, but it doesn't depend on a guessed density value to do its core job.

A stable HMI is useful, but the tube physics underneath it matter more. If the process starts to entrain gas, lose full-pipe conditions, or drift thermally, the electronics can only report the change.
The practical payoff is that an operator can read the meter as a living process indicator. Mass flow tells what is moving, density tells what the fluid mixture looks like, and temperature helps explain compensation behavior. Once those terms are clear, the rest of the diagnostics stop looking like magic and start looking like a useful signal chain.
Inside the Emerson Micro Motion Model Families
The Micro Motion lineup makes more sense when it is treated as a set of operating envelopes, not a product shelf. A maintenance engineer on a tiny additive line does not need the same geometry as a refinery transfer rack, and a custody-transfer duty needs a different precision profile than a low-flow dosing skid. The right family is the one that fits the process, the pressure, the fluid behavior, and the available piping space.
Matching the family to the service
The R-Series sits in the workhorse category, with published basic mass and volume flow accuracy of ±0.4% of rate in Emerson's product literature. That puts it in the zone where everyday process measurement needs solid repeatability without overspecifying the job. In contrast, the ELITE family is positioned as Emerson's peak-performance Coriolis line for demanding service, including high-pressure, cryogenic, and high-temperature applications that Emerson says can reach 800°F (426°C) and 6,000 psig on selected models, with ±0.10% mass and volume flow accuracy for liquid hydrocarbons and ±0.35% mass accuracy for natural gas.
The F-Series is where geometry and operating envelope start to matter in a different way. Emerson's data shows 2-tube designs across sizes from F025 to F400, with tube inside diameters ranging from 0.21 in to 2.3 in. Larger IDs generally reduce pressure drop and support higher flow, while smaller sensors fit low-flow or faster-response duties better, so selection should follow the actual service, not the nominal line tag.
The LF-Series belongs on specialty low-flow work. Emerson publishes a range from 0.002 to 59.5 lb/hr and optional mass flow accuracy of ±0.5%, which is exactly the kind of envelope that makes sense on pharmaceutical dosing or specialty ingredient addition. At the other end of the installation spectrum, the G-Series, introduced in November 2023, is a compact dual-tube option with a face-to-face dimension of less than 12 inches for the 1-inch model, which helps in congested brownfield racks where piping rework is a primary cost driver.
What the operating envelope really means
The practical takeaway is that no single Coriolis family wins every job. A compact retrofit, a low-flow chemical skid, a hot hydrocarbon line, and a high-capacity transfer header all ask different things of the meter. Selecting the family correctly keeps the installation simple, the pressure drop manageable, and the signal clean enough to trust.
Sizing and Selection Decisions That Prevent Reliability Loss
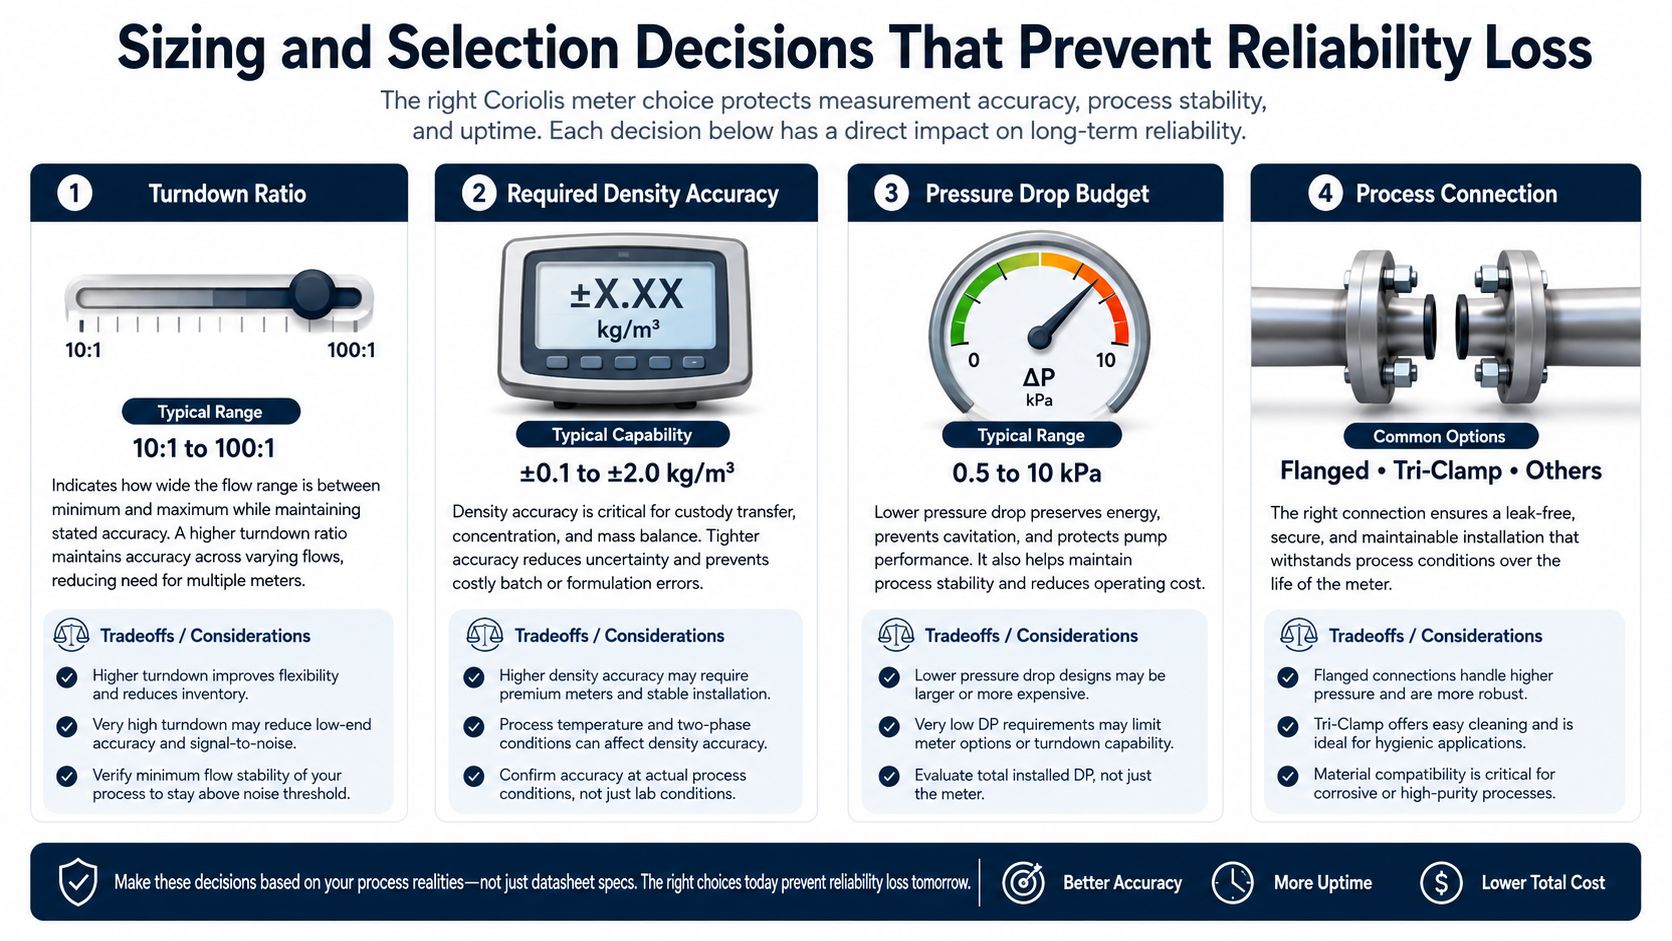
Selection fails in plants when people start with pipe size instead of process behavior. A meter that looks “right” on a P&ID can still be wrong for the duty if the flow is too low, the fluid is too viscous, or the density reading matters more than the flow total. The selection conversation should begin with reliability risk, not purchase price.
Four decisions that matter more than nominal line size
Turndown ratio is the first check. If the process swings from very low to moderate flow, the meter has to stay accurate across that range without losing signal quality at the bottom end.
Required density accuracy comes next. On blending, quality control, or material balance lines, density can matter as much as flow because a small drift can snowball into off-spec product or accounting error.
Pressure drop budget is the third filter. A sensor that creates too much resistance can starve a pump, distort flow behavior, or make the line harder to keep full.
Process connection is the final fit check. The meter has to physically integrate into the piping without turning the install into a fabrication project that invites future leakage, vibration, or poor support.
A useful internal discipline is to run a quick failure-mode review before the purchase moves forward, especially on critical skids. The thinking behind an FMEA fits well here, and a practical reference point is this internal guide on FMEA for manufacturing.
A low-flow example that exposes the tradeoff
On a pharmaceutical dosing skid, Emerson's LF-Series range of 0.002 to 59.5 lb/hr is the kind of published envelope that makes Coriolis the right conversation to have. That range is not just a spec sheet detail, it tells the reliability team the meter can stay useful at very small addition rates where an oversized sensor may not hold a stable signal.
Sizing mistake to avoid: Over-sizing on a low-flow line can make the meter work harder to resolve a tiny signal, while under-sizing on a viscous or dirty service raises resistance and can increase plugging risk.
The field lesson is direct. Match the meter to the actual process envelope, not the best-case design basis. A properly chosen Coriolis meter is easier to commission, easier to troubleshoot, and less likely to become a chronic nuisance during the next turn-up or product changeover.
Installation and Commissioning That Stops Two-Phase Trouble Early
A Coriolis meter can be perfectly selected and still give bad data if it is installed like a generic spool piece. The failure modes are rarely glamorous. They come from poor orientation, incomplete filling, trapped gas, or a support problem that should have been solved before startup. The cheapest reliability gain is usually won on the day of commissioning.
The checklist that keeps the meter honest
- Orientation rules: Install the meter in the orientation recommended for the service so the tubes stay in the intended operating state.
- Keep the meter full: Full tubes avoid two-phase behavior that distorts measurement and drives nuisance diagnostics.
- Avoid trapped gas pockets: High points and poor piping layout invite gas accumulation that will show up later as unstable readings.
- Proper grounding: Good grounding reduces electrical noise that can confuse diagnostics and transmitter stability.
- Vibration isolation: Structural vibration from adjacent equipment can make a clean signal harder to maintain.
For a plant team, the big lesson is that commissioning is not just a startup event. It is the moment to prove the process is full, the piping is supported, and the loop behaves the way the meter expects. A zero-flow verification should happen before production is handed over, because a bad zero at commissioning can become a long argument later when batch quality slips.
The connection to two-phase trouble is especially important on pump discharge lines and services that can flash or entrain gas. If the piping traps vapor or the pump suction is unstable, the meter will tell the truth about the fluid state, even if the production team would rather not hear it. A useful internal resource on pump cavitation causes and solutions fits well beside that checklist because the same upstream instability often shows up first in the Coriolis trend.
Commissioning should answer one question clearly, is the meter seeing a full, stable, single-phase stream. If the answer is no, the reliability problem is already upstream.
Reading Drive Gain and Density as Process Health Signals
Drive gain is one of the most misunderstood Coriolis diagnostics in the field. It is a proxy for the power needed to keep the tubes vibrating, not a simple pass-fail number. Emerson notes that values below 100% can still support valid mass-flow measurement, and that a rise above the normal baseline by more than about 40% can point to vapor ingress from issues such as pump seal leaks or product boil-off, with two-phase behavior often being the underlying problem.
What the trend is telling maintenance
A steady upward drift in drive gain usually means the meter is fighting the process, not failing electronically. On a chemical line, that can mean a leaking seal, poor pump suction, flashing fluid, or entrained gas from an upstream upset. The signal becomes more useful when it is read against the process history instead of in isolation.
Density deserves the same treatment. If density starts to drift while flow is still “acceptable,” the line may be aerating, temperature compensation may be wrong for the duty, or the mixture may be changing in a way the batch record hasn't caught yet. In a blending or food dosing application, that can create quiet material balance errors long before anyone sees an alarm.
A good troubleshooting split is simple:
- If drive gain rises and the process has gas sources, inspect the pump, suction, seals, and upstream pressure conditions.
- If density drifts but flow remains stable, check composition changes, thermal effects, and possible aeration.
- If both signals become unstable at once, suspect a broader process upset before replacing the meter.
Practical rule: A Coriolis meter that reports a strange signal is often doing its job. The question is whether the plant wants to listen.
Reliability teams save time by following the process path first. An internal reference on acoustic monitoring is useful here because unusual noise, gas ingress, and mechanical instability often travel together. The meter's value is not just the number on the screen, it's the clue that helps maintenance move to the right pump, seal, valve, or control issue faster.
Calibration, Verification, and Tying Coriolis into Predictive Maintenance
A Coriolis meter should not live outside the rest of the plant's condition program. If the asset strategy already uses vibration, ultrasound, or thermography, the meter trend belongs in that same conversation. The point is not to replace other tools, it's to reduce uncertainty about whether the process or the instrument is changing.
Verification beats blind swapping
Calibration interval thinking should be tied to risk, not habit. If the meter is on a critical batch or custody-transfer line, the maintenance team should document how verification happens, what trend changes trigger attention, and what evidence is needed before a swap. A useful frame for that discipline is tracking equipment calibration for safety, because measurement confidence only matters when the team can prove it held up over time.
Micro Motion transmitters also support in-situ verification approaches, which helps teams avoid pulling a healthy meter just because the signal looked odd for a shift. That matters on production lines where downtime costs more than the inspection itself. A verification result, combined with trend history, often does a better job than a blanket recalibration interval.
For a broader maintenance strategy, the Coriolis meter should sit inside the same asset hierarchy as route-based and continuous monitoring programs. An internal guide on condition monitoring systems fits that view well, because the meter becomes one more data stream in the reliability stack rather than a standalone loop.
How the cadence comes together
A practical cadence looks like this in the plant:
- Trend the meter daily on critical services.
- Compare drive gain and density changes against pump health, suction stability, and temperature swings.
- Verify the meter before deciding on a sensor replacement.
- Escalate to mechanical inspection when the signal points upstream, not when the alarm looks inconvenient.
The advantage is not philosophical, it's operational. Teams stop treating every odd Coriolis trend as an instrument problem and start using the meter as a screening tool for the actual source of change. That shift supports better planning, fewer false calls, and a tighter maintenance backlog.
Common Failure Modes and Your Next Reliability Move
The failures that matter most are the ones that repeat. Tube erosion shows up in abrasive service. Plugging shows up in high-viscosity or polymerizing fluids. Drive gain drift often tracks two-phase operation. Density calibration drift can follow thermal cycling. Electronics issues usually point to grounding problems or moisture ingress rather than a mysterious sensor curse.
What to do first
The next move is not the same for each failure mode.
- Abrasive service: Inspect upstream solids handling, strainers, and fluid cleanliness before condemning the meter.
- Plugging risk: Review heat tracing, flush practices, and whether the process ever sits long enough to gel or polymerize.
- Two-phase symptoms: Check pump suction, seal integrity, and vapor sources before adjusting the transmitter.
- Thermal drift: Review temperature swings across operating cycles and whether the meter is seeing a stable filled condition.
- Electrical problems: Check bonding, grounding, enclosure integrity, and moisture entry points.
The point is to connect the symptom to the cause that a plant can fix. A Coriolis meter rarely fails in isolation. It usually reports the combined effect of process behavior, installation quality, and maintenance discipline.
For teams that need a structured way to close the loop, root cause failure analysis is the right next step after repeated meter trouble. That approach keeps the team from replacing good hardware while the upstream issue stays in place.
A reliable plant doesn't just read the meter, it acts on what the meter reveals. When drive gain rises, density drifts, or two-phase symptoms show up, the question is which upstream asset caused the change and how fast the team can intervene.
Forge Reliability helps plants turn measurement anomalies into maintenance action, especially when a Coriolis meter is warning about pumps, seals, suction issues, or process instability. Visit Forge Reliability to request a free reliability assessment for your critical flow assets and get a practical plan for improving uptime, tightening diagnostics, and reducing repeat failures.