A maintenance manager usually sees the same pattern before a thermography program stalls. The plant bought a capable camera. A technician walked routes for a few weeks. Reports showed bright colors and a handful of hot spots. Then the findings stopped driving work orders, asset history never got updated, and the scan became another annual checkbox.
That's where most thermography inspections lose value. The camera isn't the problem. The program design is. Thermal data only helps when the team knows which assets matter most, what operating conditions make a scan valid, how surface emissivity changes the reading, and how each finding flows into a maintenance decision.
For reliability engineers, maintenance managers, and plant operations leaders, the difference between a useful survey and wasted effort comes down to discipline. A paper mill gearbox, a food plant motor control center, or an extruder barrel heater circuit can all produce thermal signatures that matter. But only if the scan is taken under the right load, from the right angle, with the right settings, and documented well enough to trend over time.
Table of Contents
- Building Your Thermography Program Foundation
- Selecting and Configuring Your Inspection Equipment
- Executing Safe and Effective On-Site Inspections
- Analyzing Images to Pinpoint Failure Modes
- Reporting Findings and Driving Maintenance Actions
- Conclusion Take Your Reliability Program to the Next Level
Building Your Thermography Program Foundation
A structured program matters because random scanning rarely lines up with plant risk. The market has moved in that direction for a reason. The global thermography inspection services market is projected to reach $9.6 billion by 2034, driven by risk-based inspection planning and documented 3–5x ROI for industrial facilities that integrate thermography into reliability programs, according to thermography inspection services market data.

Start with asset criticality, not camera routes
The first pass shouldn't begin with “what can be scanned fastest.” It should begin with “what hurts the plant most if it fails.” That means ranking assets by production impact, safety exposure, redundancy, repair lead time, and known failure history.
A non-redundant gearbox on a paper machine, a main incoming switchgear lineup, or a process pump feeding a bottleneck reactor deserves a different inspection plan than a standby utility pump. If both assets get treated the same, the plant spends the same effort for very different value.
A practical ranking process usually includes:
- Production consequence: Does failure stop the line, slow it down, or create scrap?
- Safety and compliance exposure: Would overheating create fire risk, arc flash risk, or environmental release potential?
- Redundancy: Is there a ready spare, or does one failure force an outage?
- Repair complexity: Can the team fix it in hours, or does it require a shutdown window and special parts?
- Failure behavior: Does the asset have thermal failure modes that thermography can see?
Practical rule: Thermography inspections should be assigned where heat is a meaningful symptom, not where the route is convenient.
That last point gets missed often. Thermography is excellent for electrical defects, insulation issues, refractory loss, steam system losses, and many loaded mechanical faults. It's less useful as a standalone early warning tool for defects that haven't started producing heat.
For teams building a broader strategy, the benefits of condition monitoring emerge with greater clarity. Thermography works best as one layer in a reliability stack, not as the only diagnostic method.
Build routes and frequencies around risk
Once criticality is set, routes need to follow process logic. The route should let a technician move safely and efficiently through a plant while equipment is in comparable operating states. A route that jumps between idle backup systems and heavily loaded production systems produces inconsistent data and wastes time.
A practical route plan usually separates:
- Electrical routes: MCCs, switchgear, disconnects, transformers, panelboards
- Mechanical routes: motors, couplings, bearings, gearboxes, conveyor drives
- Process and utility routes: steam traps, insulated piping, ovens, vessels, roof or building envelope loss points
Inspection frequency should align to asset risk and fault history. Fixed annual scans for every asset sound tidy, but critical assets often need tighter attention while low-consequence assets can be checked less aggressively. That's the same logic behind a strong 12-month reliability program roadmap. The route, inspection interval, and corrective workflow should all reflect business risk.
A food processing plant offers a simple example. Main freezer electrical distribution, compressor motors, and heater circuits in packaging lines often belong on a core route because faults there affect throughput quickly. A redundant washdown pump in a utility corner usually doesn't.
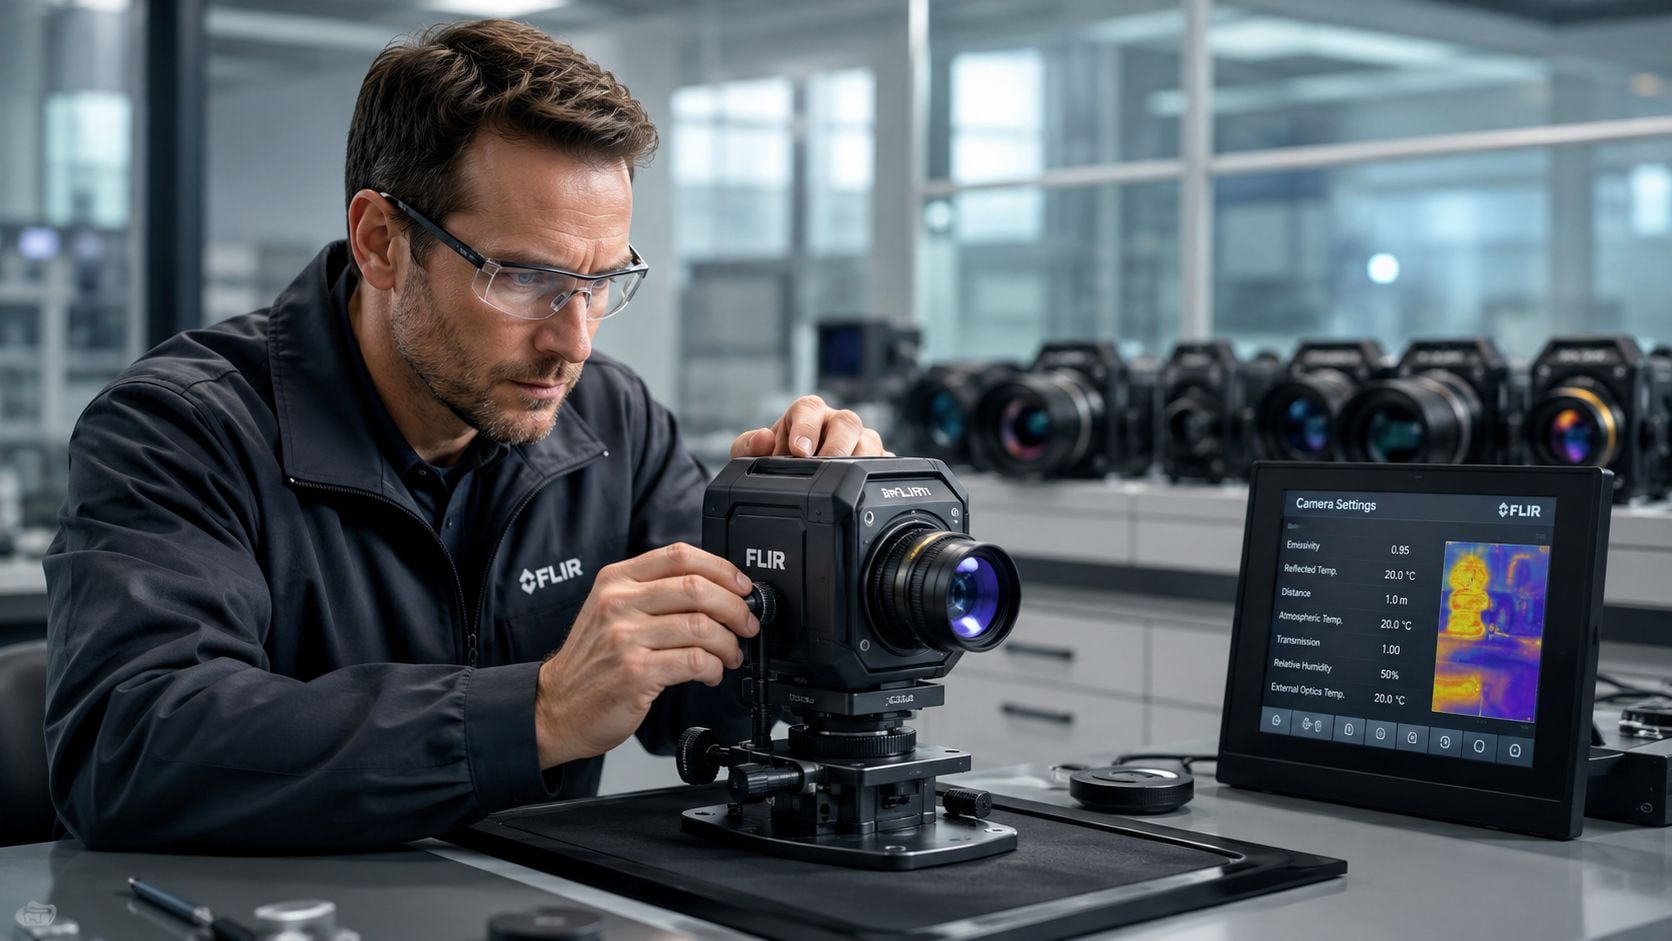
Selecting and Configuring Your Inspection Equipment
A good thermal image can still produce a bad diagnosis. Equipment selection and setup determine whether the image is just visually impressive or useful for maintenance decisions.
Choose for measurement, not just image quality
The camera has to match the job. A plant that only wants broad electrical screening can work with a simpler setup than a site trying to compare small terminations inside crowded cabinets or validate process insulation losses. Resolution matters because the target has to fill enough of the measurement area to avoid averaging away the hot spot. Thermal sensitivity matters because subtle differences can separate a normal connection from a developing problem.
Calibration also matters. If a team wants to make temperature-based decisions, the camera needs a valid calibration certificate and operators need a standard setup procedure. Otherwise the reported number becomes hard to defend when a planner asks whether the repair should happen now or at the next outage.
For a new maintenance manager, the easiest rule is this: buy and configure the camera for the smallest, most critical target the team expects to inspect. A large motor housing is forgiving. A single lug in a crowded bucket is not.
Set emissivity and reflected temperature correctly
Most new users struggle with emissivity, which is the ability of a surface to emit thermal radiation. High-emissivity surfaces act more like reliable emitters. Low-emissivity surfaces act more like mirrors. That's why polished metal can fool a thermographer. The camera may read reflected energy instead of the true surface condition.
A polished motor casing and stainless steel pipe are common traps. Recent field studies confirm that uncorrected emissivity errors on low-emissivity surfaces like polished motor casings can produce up to 30% inaccurate temperature readings, leading to missed insulation defects and false hot-spot alerts in industrial facilities, according to this review of thermographic inspection and emissivity error.
A thermal camera doesn't know whether it's seeing emitted heat from the asset or reflected heat from the surroundings unless the operator gives it the right context.
The practical field fix is straightforward:
- Use a known reference point: A high-emissivity target on the same asset gives a more trustworthy comparison point.
- Change the viewing angle: Reflections often disappear or move when the operator changes position.
- Compare with surrounding components: Similar assets under similar load should show comparable patterns.
- Document the setup: If the team had to compensate for a shiny surface, that note belongs in the record.
A chemical processing line offers a good example. Stainless piping around a hot process stream can show false warm bands from reflected furnace or ambient radiant sources. If the thermographer doesn't account for that, the team may chase an insulation defect that isn't real or miss one that is. That's why disciplined setup matters as much as the camera itself.
For teams refining electrical and mechanical routes, infrared thermography inspection guidance for industrial assets is useful when standardizing field settings and reporting criteria.
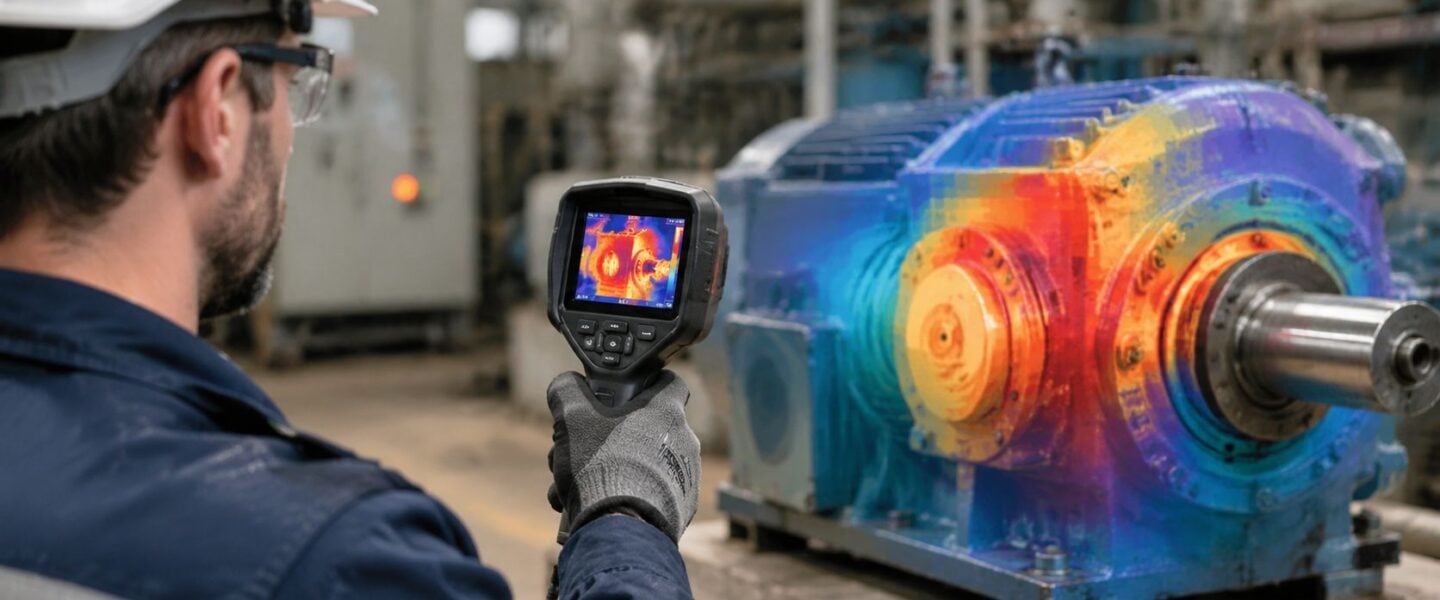
Executing Safe and Effective On-Site Inspections
On the plant floor, the difference between a valid survey and a weak one usually appears before the first image is saved. The technician arrives at a line, checks status, confirms it's operating as expected, and only then decides whether the scan is worth taking.
What a good field day looks like
A typical route starts with conditions, not pictures. Is the line loaded? Has production changed over to a different product? Is the VFD cabinet open because electricians are troubleshooting something unrelated? Those details shape the thermal pattern.
In an extruder line, for example, heater bands, motor connections, gearbox housings, and control panels all respond to operating state. A partially loaded line after a long slowdown won't tell the same story as the same line during stable production. The thermographer has to know the process condition before calling an anomaly real.
Electrical safety has to stay front and center. Energized inspections demand proper boundaries, PPE selection, and task planning. The camera should never tempt a team into casual exposure around live equipment.
Field note: The safest image is the one planned before the cabinet is approached, not after it's open.
Capture the image and the operating context
A thermal image without operating context is only half a record. Per NFPA 70B Section 7.4.5, if a thermographic inspection can't be performed at normal circuit loading, the scan must be conducted at no less than 40% of normal circuit loading and those conditions must be documented to ensure valid thermal signatures, as outlined in NFPA 70B thermography documentation guidance.
That requirement matters because heat is load dependent. A loose termination may look mild at a reduced load and severe at production load. Without the load note, no one reviewing the report later can judge urgency properly.
A disciplined on-site checklist should include:
- Asset identification: Tag number, location, and equipment class
- Operating condition: Running, idle, startup, reduced rate, full production
- Load context: Electrical load or process load condition when relevant
- Environmental notes: Wind, radiant heat, washdown, open doors, or sun exposure if they affect the image
- Inspection geometry: Angle and distance if the target is reflective or difficult to access
- Visible image pair: Standard visual photo alongside the thermal image
For route-based utility work, steam systems are a good reminder that context matters outside electrical rooms too. A trap body that looks cool or hot only means something when its operating condition and surrounding line temperatures are understood. Teams building those routes often benefit from more formal guidance on thermographic surveys for steam systems, traps, and insulation.
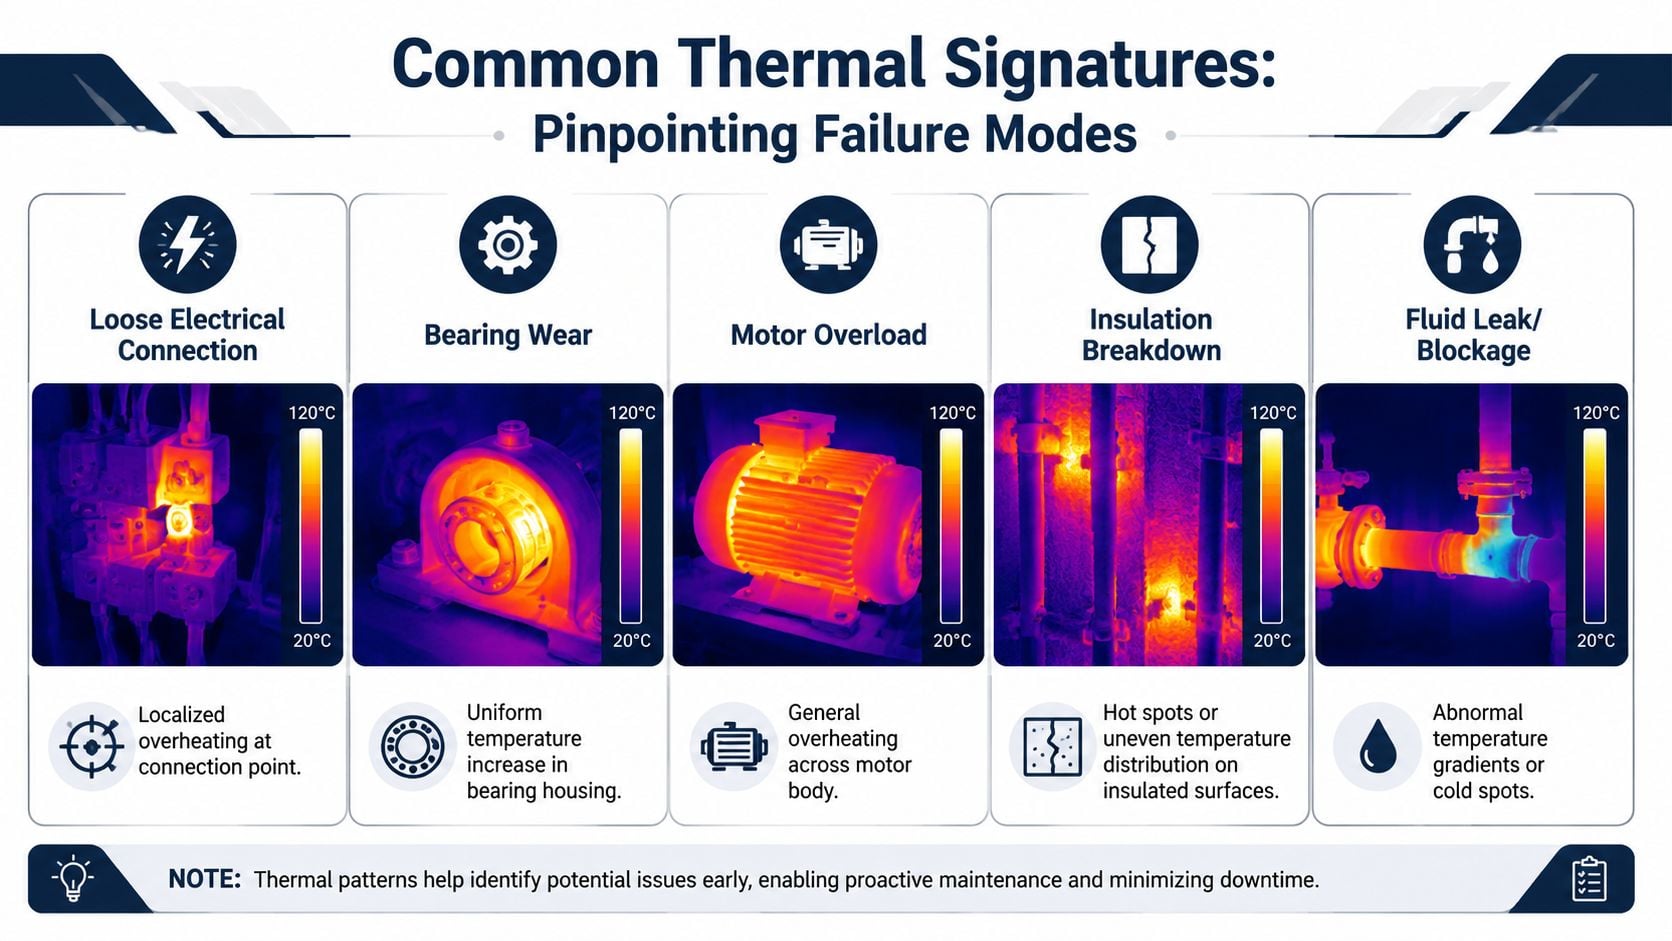
Analyzing Images to Pinpoint Failure Modes
Finding a hot spot is the easy part. Interpreting it correctly is where reliability value shows up. The key is to read the pattern, compare like with like, and tie the thermal signature to a likely failure mode.
Read the pattern before judging the temperature
Electrical systems are often the clearest example. Infrared thermography is uniquely effective for detecting electrical precursors to failure such as loose terminations and overloaded conductors. A single hot lug in a distribution panel, if left in service, can lead to arc flash or burnout, which is a failure mode other methods like vibration analysis won't detect, as described in this overview of industrial thermography for electrical fault detection.
That same logic applies across plant equipment:
- A localized hot point at one connection often suggests resistance at that junction.
- A uniform rise across an entire conductor or motor body points more toward overload or cooling issues.
- A single hot bearing housing may indicate lubrication problems, excess friction, or developing internal damage.
- An irregular hot band on insulated piping can indicate damaged or missing insulation.
- A cold or hot discontinuity in process piping may suggest blockage, flow change, or loss of insulation integrity.
A conveyor drive gives a practical example. If only the inboard bearing housing runs hotter than the outboard side under stable load, the team starts thinking about lubrication condition, fit, or bearing damage. If the whole motor frame runs warm and the terminals do too, the team shifts attention toward loading or electrical supply conditions.
Don't diagnose from color palette alone. Diagnose from pattern, location, operating state, and comparison.
Common Industrial Failure Modes and Thermal Signatures
| System | Failure Mode | Typical Thermal Signature/Pattern |
|---|---|---|
| Electrical distribution | Loose termination | Localized hot spot at lug, terminal, or bus connection |
| Electrical distribution | Overloaded conductor | More uniform heating along conductor path or across loaded component |
| Motor system | Phase-related electrical issue | Uneven thermal pattern at motor connections compared with similar phases |
| Bearing assembly | Lubrication problem or wear | Elevated temperature concentrated at bearing housing |
| Gearbox drive | Mechanical friction or load issue | Warmer housing around load zone, often not limited to one fastener or point |
| Insulated piping | Insulation defect | Distinct hot area or uneven thermal band along insulated surface |
| Process piping | Restriction or flow abnormality | Temperature change across a section that breaks expected process profile |
| Building envelope or roof area | Moisture or thermal loss path | Irregular area with different thermal response than adjacent surface |
Misclassification creates expensive mistakes. A planner may order an emergency shutdown for what turns out to be a reflection, or defer a real electrical defect because the report didn't clearly separate point heating from general warming. That's why image analysis should always connect the visual pattern to a probable mechanism and a next action.
For rotating equipment routes, bearing findings deserve their own trend logic because isolated temperature increases can come from several causes. Consequently, thermographic inspection practices for bearing systems fit well alongside vibration and lubrication review.
Reporting Findings and Driving Maintenance Actions
A thermography inspection isn't complete when the image is taken. It's complete when somebody decides to monitor, repair, investigate further, or shut down. If the report doesn't drive that decision, the program is collecting pictures instead of managing risk.

A report should force a decision
The best reports are short, specific, and tied to action. They include the thermal image, the matching visual image, asset ID, operating condition, observed pattern, likely failure mode, and a recommendation that a planner can turn into work.
A weak report says, “Hot spot observed.” A useful report says, “Localized heating at line-side lug in MCC bucket under loaded operation. Pattern is consistent with a high-resistance connection. Inspect and correct at next planned outage, then rescan under comparable load.”
Industrial facilities that follow standardized inspection and documentation protocols, including systematic recording, historical analysis, and load data, report an ROI of $4 saved for every $1 spent, according to this thermographic inspection methodology reference. That return doesn't come from taking more images. It comes from converting findings into prevented downtime and avoided secondary damage.
A clear report should answer five questions:
- What asset is affected?
- What did the thermographer observe?
- What failure mode is most likely?
- How urgent is the response?
- What follow-up confirms correction?
For facilities that also inspect structures and weather barriers, the reporting logic is similar. A good thermal inspection guide for Arizona roofs shows the same principle. Thermal imagery only becomes useful when it's translated into a specific condition call and repair decision.
Trend data inside the CMMS
Trending is where thermography inspections become part of reliability engineering instead of isolated field work. The CMMS should store the finding against the exact asset record, attach the images, capture the operating context, and create or link the work order. On the next route, the thermographer should be able to compare the new image against the old one and see whether the condition is stable, worsening, or corrected.
That also changes how maintenance teams compare predictive and time-based strategies. A plant that feeds thermal findings into planning can move away from blanket preventive work and toward condition-driven actions. The trade-off is simple. Without system integration, thermography stays reactive. With integration, it supports a stronger predictive versus preventive maintenance strategy.
One practical option for plants that need outside support is Forge Reliability, which provides predictive maintenance and condition monitoring services, including thermography, as part of broader reliability programs. That kind of support is most useful when a plant has route coverage gaps, inconsistent reporting, or no clear workflow from detection to corrective action.
A thermal anomaly without a work order is only an observation. A thermal anomaly tied to asset history becomes a reliability decision.
Conclusion Take Your Reliability Program to the Next Level
Thermography inspections work best when the plant treats them as a decision system, not a camera exercise. The foundation starts with asset criticality and route design. It gets stronger when technicians configure equipment correctly, account for emissivity on reflective surfaces, and capture valid images under meaningful operating conditions. It pays off when analysts recognize thermal patterns that point to actual failure modes instead of just temperature differences.
That discipline is what separates a compliance scan from a reliability program. A check-the-box survey might find obvious hot spots. A value-driving program helps a plant prioritize high-risk assets, avoid false alarms, document context, trend degradation, and feed the result into maintenance planning. That's where thermography stops being a colorful report and starts becoming part of uptime management.
For reliability engineers, maintenance managers, and plant operations leaders, the practical goal isn't to inspect everything. It's to inspect the right assets, under the right conditions, with enough rigor that every finding supports a better maintenance decision. In a manufacturing plant, process facility, or utility environment, that approach is what keeps electrical defects, mechanical heat issues, and insulation losses from turning into avoidable downtime.
Forge Reliability helps manufacturers and process plants build practical condition monitoring programs that turn thermography inspections into actionable maintenance decisions. If the current program feels reactive, inconsistent, or too dependent on annual scans, schedule a free reliability assessment with Forge Reliability to review asset criticality, inspection workflows, reporting discipline, and CMMS integration.