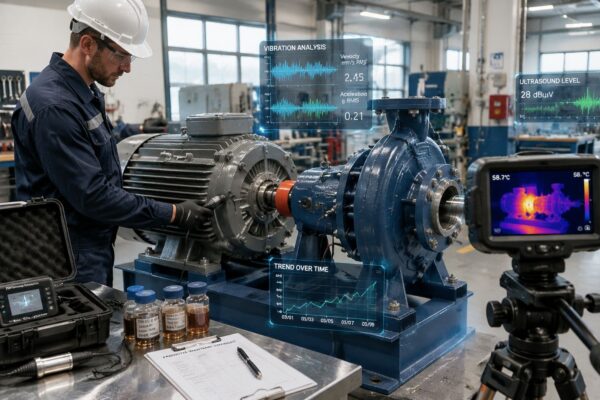
DMAIC is the five-phase Six Sigma improvement cycle, Define, Measure, Analyze, Improve, and Control, used to turn recurring equipment failures into quantified baselines, validated root causes, and sustained countermeasures. Its modern industrial use traces to Motorola's quality program in the mid-1980s, with 1986 often cited as a milestone in formalizing the method and 1994 marking company-wide adoption of the DMAIC and Black Belt system at Motorola, as documented in this Six Sigma historical timeline.
A critical pump fails again, the bearing gets replaced again, and the shift team returns the asset to service before anyone proves why it failed. The work order closes, production recovers, and the same failure begins rebuilding in the background. For reliability engineers and maintenance managers, the question isn't what is DMAIC. The useful question is whether the plant can use it to stop treating symptoms as solutions.
Table of Contents
- Why Reliability Teams Need a Structured Problem-Solving Method
- The Five DMAIC Phases Explained for Industrial Reliability
- Applying DMAIC to a Recurring Pump Failure
- Statistical and Diagnostic Tools for Each Phase
- Why DMAIC Projects Fail in Maintenance Environments
- DMAIC 4.0 and the Future of Data-Driven Reliability
- Start Your Reliability Improvement Journey Today
Why Reliability Teams Need a Structured Problem-Solving Method
A centrifugal process pump fails for the third time in a quarter. Operations wants production restored, maintenance needs a safe repair window, purchasing prepares to order another bearing, and engineering must explain the event with incomplete evidence. Replacing the bearing without checking alignment, lubrication, pipe strain, resonance, and operating conditions can remove the visible damage while leaving the failure mechanism in place.
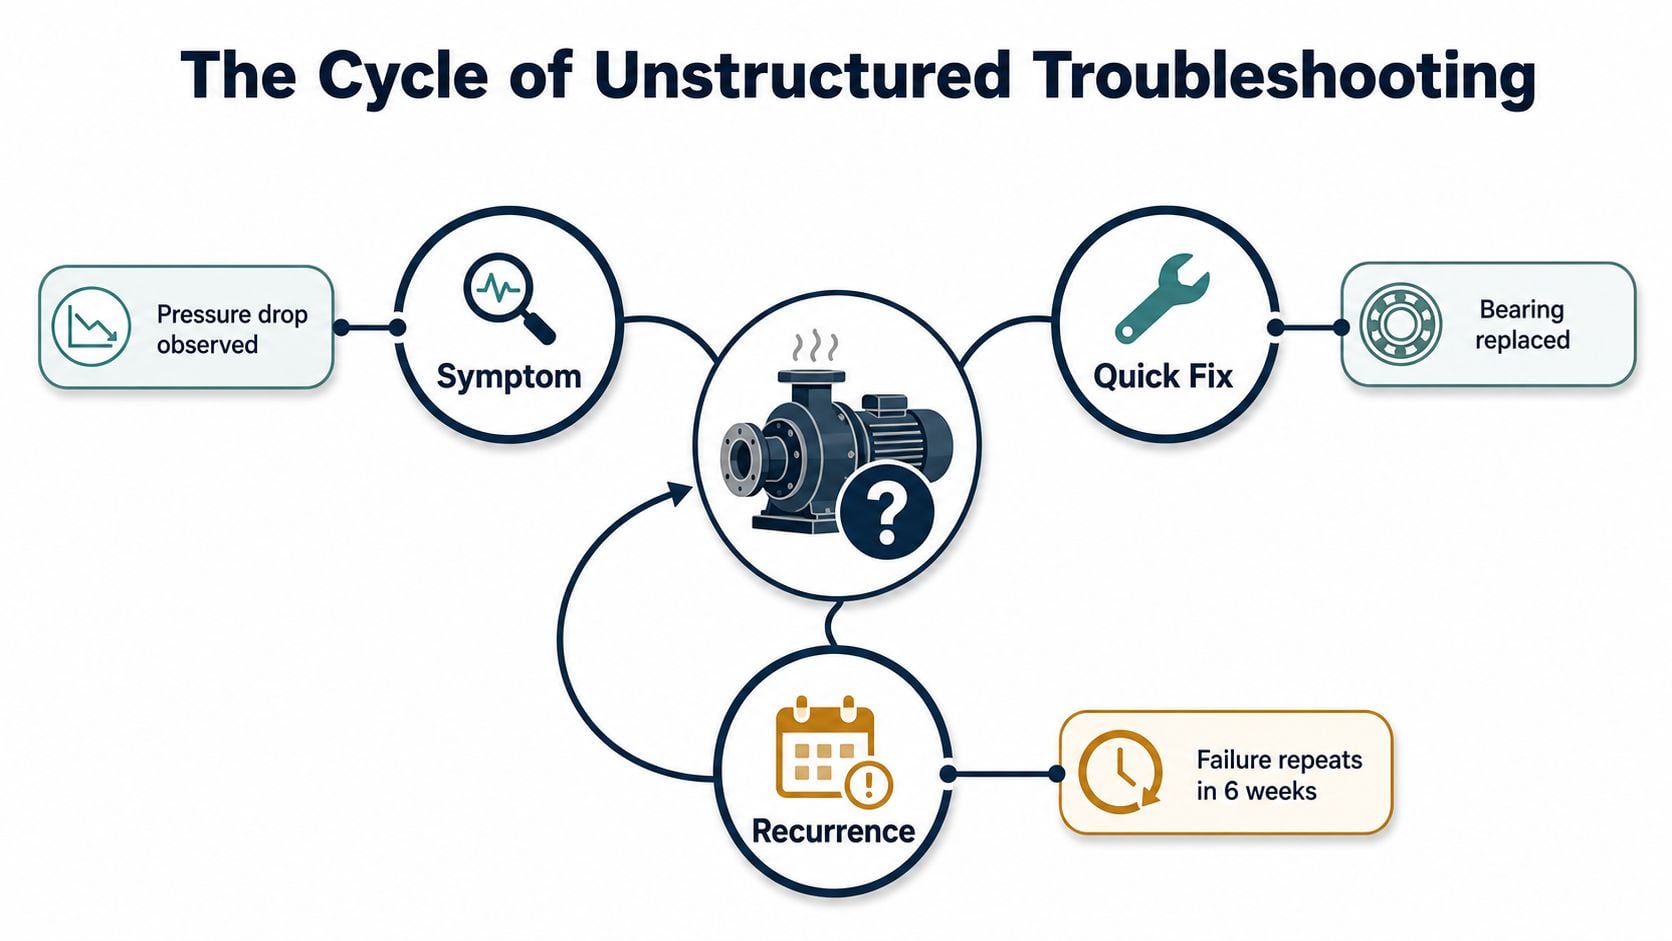
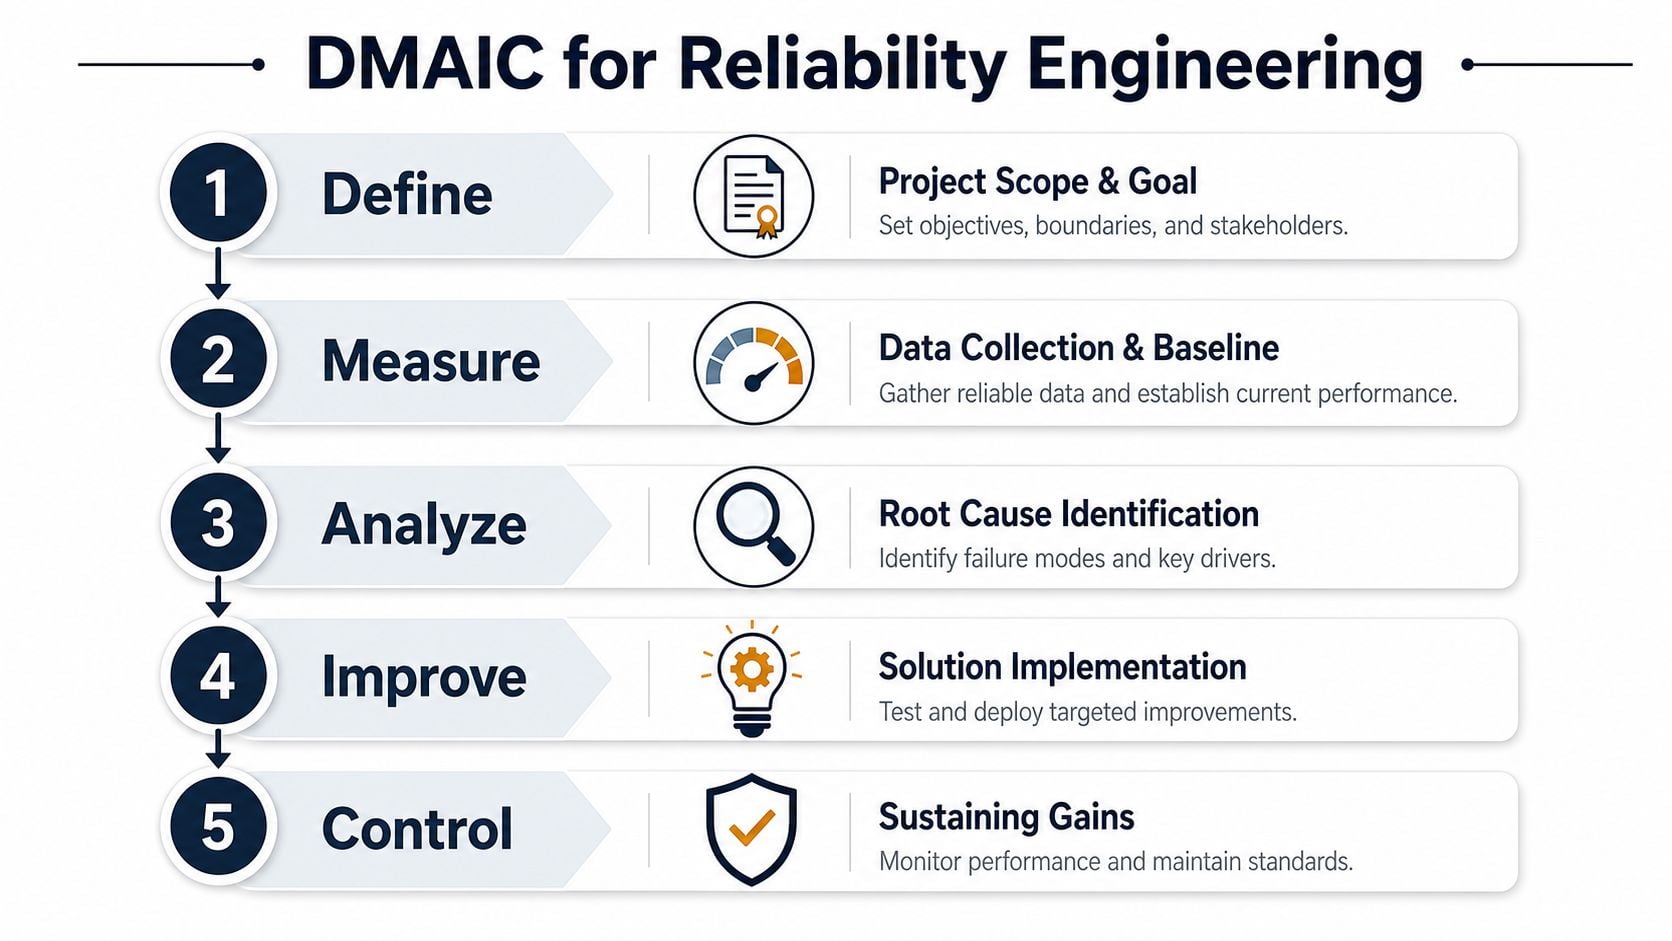
DMAIC gives reliability teams a controlled way to break that cycle. Define sets the problem boundary, Measure establishes a credible baseline, Analyze tests likely causes, Improve verifies countermeasures, and Control keeps performance from slipping. The sequence links condition-monitoring data, CMMS records, and failure evidence into one operating method instead of treating each breakdown as a separate repair.
From downtime complaint to engineering project
Define turns “this pump keeps failing” into a project with an equipment tag, failure mode, boundary conditions, stakeholders, and a measurable objective. Measure then compares normal and abnormal performance using vibration readings, temperature trends, lubrication records, process data, failure history, and work-order quality. Poor CMMS descriptions can conceal recurrence, while consistent failure coding can show whether the same mechanism is returning.
Analyze separates evidence from assumption. A damaged bearing raceway may result from misalignment, contamination, or operating stress rather than initiate the event. The team should connect inspection findings with trends and process conditions, then test the suspected mechanism before selecting a repair.
Improve applies a countermeasure under defined conditions and checks whether the failure indicators change. Control assigns ownership, updates standard work, preserves the relevant CMMS history, and continues monitoring so regression becomes visible before another emergency shutdown.
This structure reflects DMAIC's historical significance. It combined statistical process control thinking with a repeatable project method that organizations could apply across plants, product lines, and equipment classes, rather than relying on isolated troubleshooting habits. Its industrial roots in Motorola's quality program are documented in the historical timeline cited earlier.
Practical rule: A repair is complete only when the failure mechanism has been addressed and the operating system can detect its return.
DMAIC also gives root-cause failure analysis a place inside a larger improvement cycle. A structured root cause failure analysis process can provide the evidence for Analyze. DMAIC then adds measurement discipline, verified improvement, and control ownership, preventing the investigation from ending as a report with no lasting change.
The Five DMAIC Phases Explained for Industrial Reliability
DMAIC gives a reliability team a controlled way to move from a recurring loss to a verified operating change. Each phase answers a different question. Skipping one usually leaves a predictable gap, such as an unreliable baseline, an untested cause, or a countermeasure no one owns after commissioning.
Define establishes the boundary
The project charter identifies the asset, failure mode, process boundary, business consequence, team, and decision authority. A SIPOC, meaning suppliers, inputs, process, outputs, and customers, exposes upstream conditions that can affect equipment performance. A critical-to-quality tree converts requirements such as stable flow, product temperature, or contamination control into measurable equipment and process characteristics.
State the problem in operational terms. Identify what fails, where it occurs, how the site detects it, and which condition the project must improve. This keeps the team from blaming a component before the failure mechanism is understood.
Measure makes the baseline credible
Measure covers data quality as well as data collection. The team must establish whether the measurement system can distinguish real equipment change from collection error. Gage R&R, or repeatability and reproducibility analysis, examines variation caused by the instrument, method, or people collecting readings.
Useful measures include vibration amplitude, bearing temperature, lubrication quantity, alarm frequency, reject count, cycle time, and mean time between failures. Condition-monitoring data should be tied to operating state, while CMMS records provide work history, parts changes, task compliance, and failure-code context. Together, these sources give the reliability team a baseline that reflects both equipment condition and maintenance execution.
Analyze tests the suspected cause
Analyze turns possible causes into tested relationships. Pareto analysis can show which failure modes contribute most to the loss, but it does not prove why the dominant mode occurs. Hypothesis tests, ANOVA, regression, fault trees, process maps, and physical inspection can test whether alignment, load, speed, contamination, or lubrication affects the outcome.
A cause-and-effect map keeps the investigation broad during early scoping and evidence-based during verification. The team should connect sensor trends, inspection findings, operating conditions, and CMMS history before selecting a root cause.
Improve tests the countermeasure
Improve requires more than recommendations. Compare options for technical effect, maintainability, safety, operating risk, and implementation burden. Where the data supports it, design of experiments can test several variables. A controlled pilot can verify the change on one asset or operating window before wider deployment.
A pump project might compare alignment tolerances, lubrication delivery, and operating load rather than assume a different bearing will solve the problem. Condition monitoring and manufacturing predictive maintenance applications can help confirm that the response changes for the intended reason.
Control makes the result part of the job
Control transfers the verified solution into daily work. Control plans, standard operating procedures, mistake-proofing, calibration schedules, reaction plans, and control charts define the response when performance begins to drift.
For reliability teams, that may mean a revised inspection route, a lubrication task with a defined method, a CMMS trigger, an alarm response, and a named process owner. The method becomes a statistical workflow connected to condition monitoring, maintenance records, and frontline accountability. The project is complete when the improvement survives routine operation and its return would be detected early.
Applying DMAIC to a Recurring Pump Failure
Consider a centrifugal pump in a chemical processing plant with repeated bearing failures. The maintenance team has replaced damaged bearings, but the repair history doesn't establish whether the bearing is defective, overloaded, misaligned, poorly lubricated, contaminated, or exposed to pipe strain.
Define and Measure
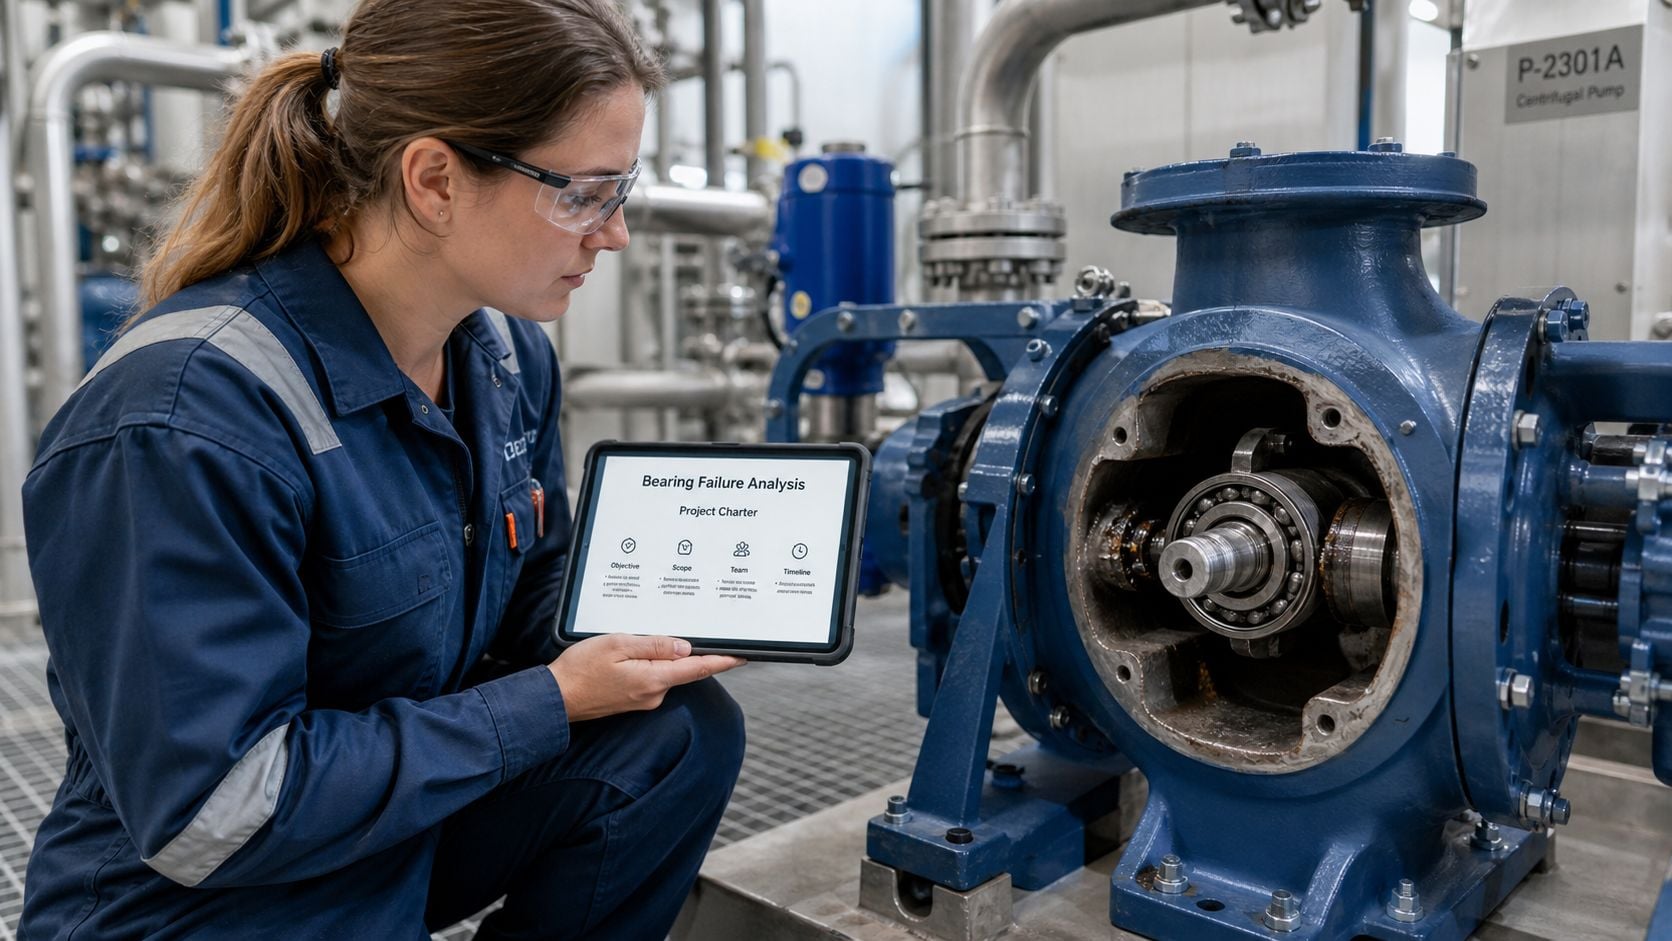
The charter names the pump tag, the bearing failure mode, the production service, the project boundaries, and the operational impact of unplanned downtime. It also defines the evidence required before the team can approve a permanent change. A useful charter prevents the investigation from expanding into every pump in the plant before the original failure mechanism is understood.
During Measure, technicians verify the vibration collection method and instrument condition before using the readings as a baseline. The team gathers spectrum data, overall vibration, bearing temperature, lubrication records, alignment reports, operating conditions, seal observations, and failure dates. The CMMS history is reviewed for repeat work, parts changes, overdue tasks, and inconsistent failure codes.
Analyze and Improve
The failure analysis examines the bearing and adjacent components for directional evidence. Raceway marks, cage damage, discoloration, looseness, coupling condition, soft foot, pipe strain, and lubrication condition help distinguish competing explanations. Fault tree analysis organizes the paths to bearing failure, while hypothesis testing can compare operating or maintenance conditions associated with failed and healthy periods.
Suppose the evidence confirms shaft misalignment and inadequate lubrication rather than bearing quality as the primary causes. The Improve phase then targets those mechanisms with a laser alignment standard, a controlled lubrication method, and an updated preventive-maintenance route. The changes should be piloted and checked against vibration, temperature, lubrication condition, and repeat failure indicators.
Control the new maintenance system
Control links the technical fix to execution. Continuous vibration monitoring can identify a return of the characteristic fault pattern, while alarm thresholds and response instructions tell the team what to do next. The CMMS receives new inspection tasks, lubrication requirements, alignment documentation, and escalation rules.
The project should also specify who reviews the trend, who approves corrective work, and how the plant handles a missed task or abnormal reading. Guidance on centrifugal pump reliability and failure prevention can help teams extend the investigation beyond the damaged bearing to the conditions that created it.
The value of this example lies in the chain of evidence. DMAIC doesn't guarantee that the first hypothesis is correct. It creates a method for proving or rejecting it before the plant standardizes the response.
Statistical and Diagnostic Tools for Each Phase
Tool selection depends on the type of data available and the decision the team needs to make. A capability index is appropriate when a measurable process characteristic can be compared with a specification or target. DPMO, or defects per million opportunities, fits defect-oriented processes with defined opportunities for failure. Neither should be used merely because it appears in a template.
The same discipline applies during Analyze. A Pareto chart ranks categories and directs attention, but it doesn't establish causation. Hypothesis testing compares conditions, ANOVA evaluates differences across groups, and regression examines relationships among variables. Physical failure analysis remains essential because statistical association without a plausible mechanism can misdirect the project.
| DMAIC Phase | Tool | Best Used When | Reliability Application |
|---|---|---|---|
| Measure | Gage R&R | Measurement variation may affect the baseline | Verify that vibration, temperature, or inspection readings are repeatable |
| Measure | Cp/Cpk | A measurable characteristic has a target or specification | Evaluate alignment, clearance, pressure, or process capability |
| Measure | DPMO | Defect opportunities are defined | Compare recurring assembly or process defects |
| Analyze | Pareto analysis | Failure categories need prioritization | Rank bearing, seal, coupling, lubrication, and process-related losses |
| Analyze | Hypothesis testing | Two or more conditions need comparison | Test whether load, shift, or lubrication status relates to failures |
| Analyze | ANOVA | Several groups or conditions must be compared | Assess differences across operating modes or maintenance practices |
| Control | X-bar/R charts | Individual subgroups and variation need monitoring | Track repeated measurements such as vibration or dimensional checks |
| Control | p-charts | The proportion of defective units matters | Monitor the share of inspections or production units with defects |
| Control | c-charts | Counts of defects per constant inspection unit matter | Track repeated defect counts in a stable inspection opportunity |
| Control | CUSUM or EWMA | Small process shifts must be detected early | Identify gradual drift in vibration, temperature, or process behavior |
Statistical descriptions of DMAIC commonly place Cp/Cpk, DPMO, and Gage R&R in Measure, ANOVA, regression, and hypothesis tests in Analyze, and X-bar/R, p, c, CUSUM, and EWMA charts in Control, as summarized in this DMAIC statistics reference. The correct chart still depends on the data structure, sampling method, and consequence of a missed shift.
MES and plant data systems can feed cycle time, reject counts, alarm logs, and operating states into Measure and Control. That lets teams review behavior shift by shift instead of waiting for delayed manual reports. For equipment populations, Weibull analysis software can support failure-pattern analysis when the available history is suitable for life-distribution work.
Why DMAIC Projects Fail in Maintenance Environments
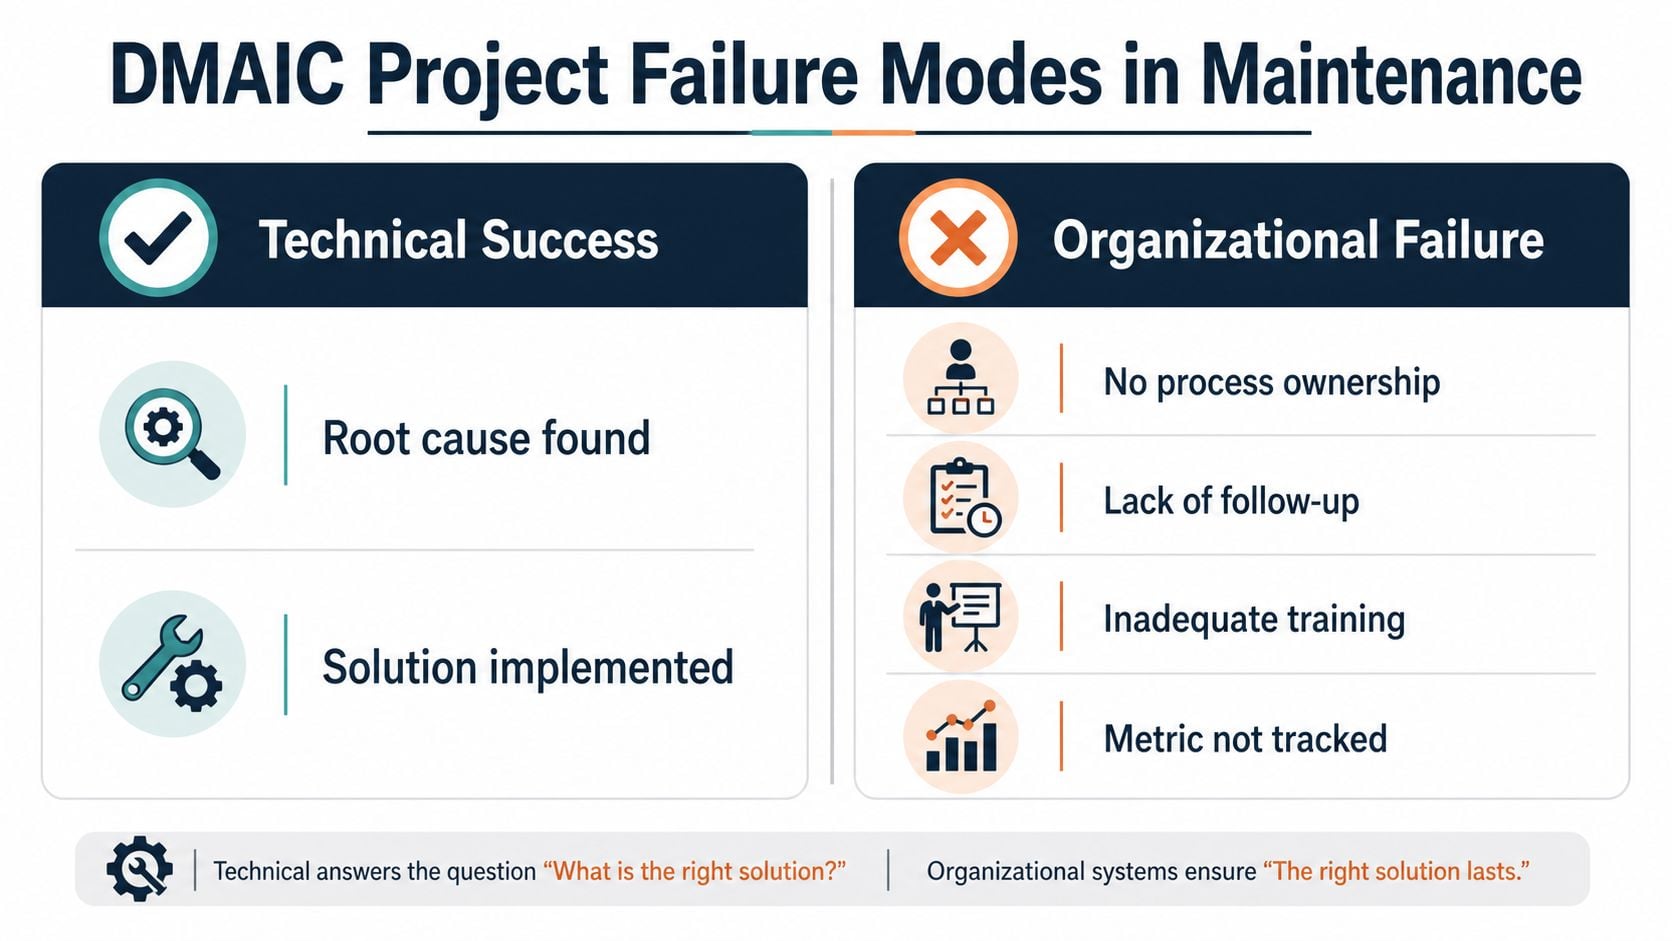
A technically correct root-cause fix can still fail when the organization does not preserve the conditions that made it work. A pump may leave the project correctly aligned, yet the next coupling replacement may skip alignment verification. A lubrication improvement may be approved, but its method, quantity, or ownership can disappear when the original technician changes roles.
Control is where ownership gets tested
Maintenance teams often invest heavily in Define, Measure, and Analyze because those phases produce visible technical work. Control can appear administrative, so the project closes after the repair instead of after the revised process has demonstrated repeatability. The plant then remains exposed to undocumented workarounds, uncalibrated instruments, incomplete CMMS records, and inspection routes that vary by technician.
Sustainment requires a clear handoff to the people who own the asset and its work processes. A question-driven DMAIC implementation guide reinforces the need to track actions, obstacles, and resistance in the system. The practical test is simple: can the operating system make the correct behavior repeatable after the project team leaves?
Warning signs of regression
Several conditions should delay project closure:
- No process owner: Nobody has authority to maintain the control plan or approve changes.
- Weak CMMS governance: Failure codes, inspection results, and completed tasks do not produce dependable history.
- Uncontrolled spare parts: Substitutions or poor storage can restore the original failure mechanism.
- Incomplete operator care: Operators are not trained to recognize abnormal noise, temperature, leakage, or vibration.
- Missing reaction plan: A rising trend is recorded, but no one knows who must inspect or isolate the asset.
- Unmaintained measurement systems: Sensors and instruments are used without calibration or verification.
A control plan that exists only in the project folder isn't a control system.
Connect the solution to standard operating procedures, training, calibration, spare-parts requirements, audit routines, and digital work orders. Condition-monitoring alarms and control charts must trigger a defined response, not merely populate a dashboard. CMMS history should show whether the response occurred and what technicians found. If the plant cannot explain what happens after an abnormal reading, the project is not controlled yet. The gain belongs to the operating process only when the data, work order, and field behavior remain connected.
DMAIC 4.0 and the Future of Data-Driven Reliability
DMAIC is becoming more useful as factories connect equipment, maintenance records, and analytical workflows. The traditional phases remain intact, but the evidence can move continuously instead of arriving as isolated readings after a failure.
During Measure, vibration, oil analysis, thermography, ultrasound, and motor current signature analysis can provide different views of rotating-equipment health. Analyze can combine those signals with CMMS failure codes, work-order history, operating state, process conditions, and root-cause findings. Improve can use digital work orders to assign a countermeasure, document the result, and return the outcome to the project record.
Research on DMAIC 4.0 describes the integration of Industry 4.0 technologies across all five phases and proposes a practical roadmap for applying those technologies within the method, as reported in this peer-reviewed DMAIC 4.0 research. The important shift for reliability teams is operational, not cosmetic. Sensor data becomes useful only when it changes an inspection, a work order, an operating decision, or a control response.
Linking live data to maintenance decisions
A connected workflow might detect a developing bearing fault, associate it with a pump operating condition, generate an inspection task, and capture the confirmed cause after teardown. The team can then evaluate whether the countermeasure reduced recurrence and whether the new route or alarm response remains effective.
Machine-learning methods may assist with pattern recognition, but they don't remove the need for measurement validation, physical inspection, and engineering judgment. A practical predictive maintenance machine learning approach should support the DMAIC loop rather than replace it.
Start Your Reliability Improvement Journey Today
DMAIC gives reliability teams a way to convert recurring failures into defined engineering problems. The method starts with a clear asset and failure mode, establishes a credible baseline, tests causes with evidence, pilots countermeasures, and embeds the result in standard work and monitoring.
The technical side matters. Measurement systems must be trustworthy, diagnostic methods must match the failure mode, and statistical tools must answer a real decision question. The organizational side matters just as much. CMMS data, calibration, training, spare-parts control, ownership, and reaction plans determine whether the improvement survives after the project team moves on.
A plant doesn't need to begin with every asset or every available sensor. Select one consequential recurring failure, define the boundary, inspect the data quality, and make the Control phase part of the charter from the start. For teams without in-house predictive-maintenance or Six Sigma capability, an external reliability assessment can identify the most practical starting point across rotating equipment, condition monitoring, root-cause analysis, and maintenance execution.
Forge Reliability offers predictive maintenance, condition monitoring, root-cause analysis, and reliability consulting for industrial equipment such as pumps, motors, compressors, gearboxes, and turbines. Visit Forge Reliability to request a free reliability assessment and identify where DMAIC can reduce recurring failures and unplanned downtime.