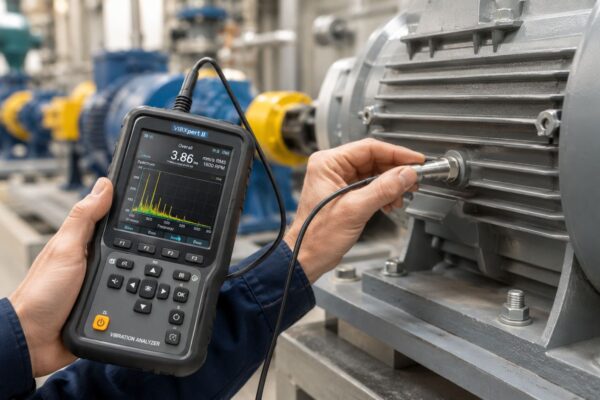
A route technician downloads a spectrum from a process pump and sees a reading in the yellow zone. Operations wants the pump returned to service, maintenance wants to schedule an outage, and the chart appears to support both positions. Yet the machine may have been accelerating, carrying a different load, or responding to a structural resonance rather than developing a rotor fault.
A vibration analysis spectrum is useful only when it becomes part of a decision record. The analyst must know what changed, which mechanism could create that change, and what operating evidence confirms or contradicts the diagnosis. A large peak can matter less than a smaller component that persists at the same order across matched operating conditions.
Table of Contents
- Why a Spectrum Without Context Misleads Teams
- What a Vibration Spectrum Actually Shows
- Collection Settings That Decide What You See
- Common Fault Signatures and What They Look Like
- Reading Sidebands, Harmonics, and Envelopes
- Route Monitoring and Continuous Monitoring Compared
- Two Annotated Spectrum Case Studies
- A Repeatable Workflow from Spectrum to Decision
Why a Spectrum Without Context Misleads Teams
A fin-fan gearbox provides a familiar example. During a route visit, a technician records a broadband velocity value above the baseline while the fan is running at a different speed from the previous collection. The analyzer places the result in a caution band, so the team considers an immediate shutdown. A later inspection finds no damaged teeth, no looseness, and no abnormal temperature.
The reading wasn't useless. The conclusion was incomplete. A conventional FFT, or Fast Fourier Transform, expresses vibration against frequency in hertz. When shaft speed changes, the same mechanical event moves along that frequency axis. Peaks can smear, overlap, or appear to change amplitude even when the machine's mechanical condition hasn't changed.
That problem affects compressors, pumps, extruders, wind-turbine drivetrains, and motors fed by variable-frequency drives. Existing guidance often teaches fixed-frequency recognition, such as 1× running speed, harmonics, gear-mesh frequency, and bearing frequencies, without explaining how changing speed shifts those signatures. Order analysis addresses the issue by expressing components as multiples of shaft speed, preserving the identity of gear-mesh and sideband features during changing-speed operation. Practical background on gearbox spectrum interpretation is available in this gearbox vibration analysis reference.
Practical rule: A spectrum must answer two separate questions: has machine energy changed, and what mechanism could produce that change?
Severity is a starting point, not a diagnosis
Broadband RMS velocity is valuable for condition evaluation, but it can't identify whether the cause is imbalance, misalignment, looseness, resonance, or a bearing defect. ISO guidance distinguishes broad condition evaluation from diagnostic analysis. ISO 13373-2 describes time-domain and frequency-domain approaches and notes that commonly used techniques aren't a complete substitute for machine-specific diagnostic methods.
A healthy baseline changes the conversation. The team can compare the current spectrum with the machine's own normal pattern, then use severity criteria to judge urgency rather than treating a threshold as proof of failure. The most useful decision document records speed, load, sensor location, phase or tachometer validity, trend direction, time waveform, and the proposed failure mechanism.
What a Vibration Spectrum Actually Shows
The sensor first captures a time waveform, which records vibration amplitude as it changes over time. That waveform can show impacts, modulation, and overall energy, but it usually doesn't identify the source clearly. The FFT reorganizes the same signal into a frequency spectrum, with frequency on the horizontal axis and amplitude on the vertical axis.
An everyday analogy helps. A time waveform is like hearing an entire orchestra at once. The spectrum separates the sound into identifiable notes, allowing an analyst to ask whether the dominant energy comes from shaft rotation, a gear mesh, a bearing defect, or a structural response.
Each vertical feature occupies a frequency bin. Lines of resolution describe how finely the analyzer divides the frequency span. More lines help separate closely spaced components, while a wider span captures higher-frequency activity but gives fewer details in a fixed-size display.
Vocabulary that prevents bad conclusions
- Peak: A concentrated component at a particular frequency.
- Harmonic: A component at an integer multiple of a fundamental frequency, such as 2× or 3× running speed.
- Sideband: A smaller component placed beside a carrier frequency, often at spacing related to shaft speed.
- Broadband floor: The distributed energy across a frequency range rather than one discrete tone.
- Order: A frequency expressed relative to shaft speed. 1× order equals one shaft rotation frequency.
- Time waveform: The original signal in time, useful for identifying impacts and periodic shape changes.
A sensor's mounting method matters because poor coupling can distort high-frequency content. Teams should standardize the measurement point, direction, sensor type, and operating state before comparing a new spectrum with a baseline. The practical collection principles are outlined in Forge Reliability's guide to measuring machine vibration.
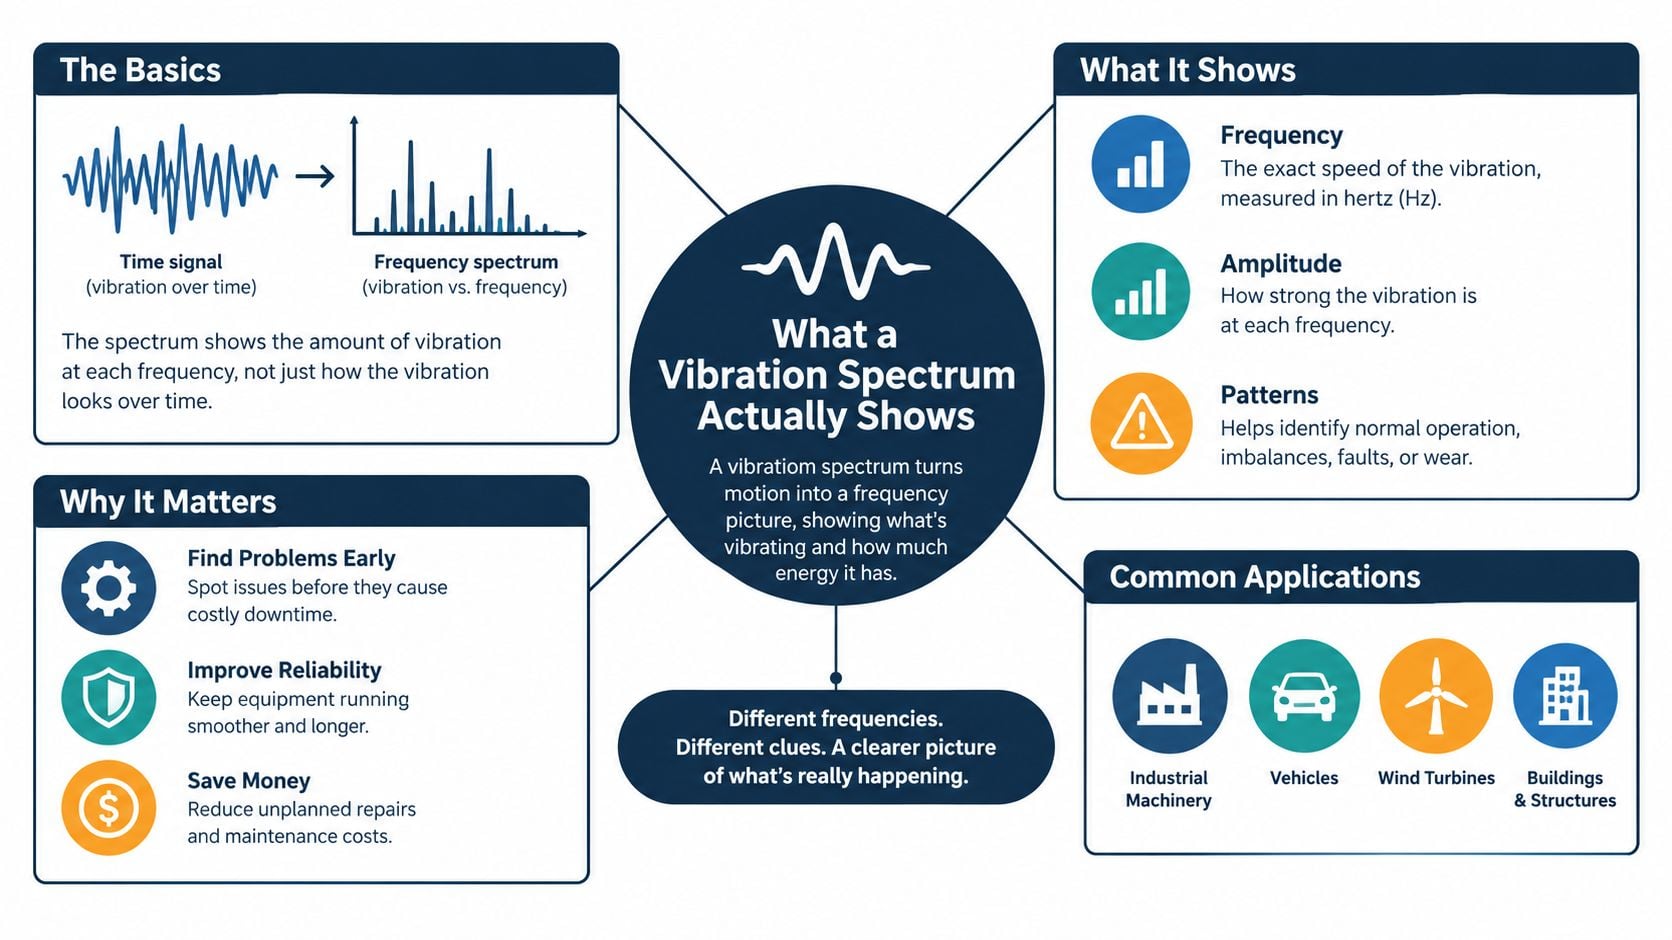
The spectrum shows where the machine's energy is concentrated. The operating state and corroborating signals explain what that energy means.
Collection Settings That Decide What You See
Analyzer defaults can hide the evidence a maintenance team needs. Sampling rate determines the highest frequency that can be represented, while frequency resolution determines whether nearby components appear separately or merge into one broad peak.
For a route on a pump, motor, or gearbox, a 1,000 Hz maximum frequency with 800 lines provides a workable general view of gear-mesh and bearing-related tones in many applications. That setting isn't universal. A gearbox with a higher mesh frequency needs a wider span, while an early bearing investigation may require acceleration and a high-frequency or envelope measurement.
A Hanning window is a practical general-purpose choice because it reduces spectral leakage, which occurs when the sampled record doesn't contain an exact whole number of cycles. Impact-style machinery benefits from that control. A transient event, such as a tooth strike during a load change, may require a triggered time capture rather than heavily averaged steady-state spectra.
Settings should match the decision
Averages stabilize a spectrum and reduce random noise, but excessive averaging can dilute a short event. Route collection on a steady pump can use several consistent averages, while a startup or shutdown investigation should preserve the changing signal instead of smoothing it away. The correct setup depends on whether the team is screening overall condition, separating gear sidebands, or capturing impacts.
| Setting | Typical Value | What It Reveals | Trade-off to Watch |
|---|---|---|---|
| Maximum frequency | 1,000 Hz for a general route | Running-speed components, harmonics, and many mesh features | Higher-frequency bearing evidence may be excluded |
| Lines of resolution | 800 lines | Separates nearby peaks across the selected span | More lines increase record length and collection time |
| Window | Hanning | Reduces leakage around non-synchronous components | Can soften the exact appearance of transient events |
| Averaging | Several consistent averages | Produces a steadier spectrum for route comparison | Can hide intermittent impacts or process events |
| Operating state | Steady speed and load | Makes current and baseline spectra comparable | Variable-speed assets may require order tracking |
For high-frequency bearing work, the collector needs suitable acceleration bandwidth and a reliable mounting method. The sensor selection principles described in Forge Reliability's vibration analysis sensor guide help connect the measurement choice to the fault being investigated.
Common Fault Signatures and What They Look Like
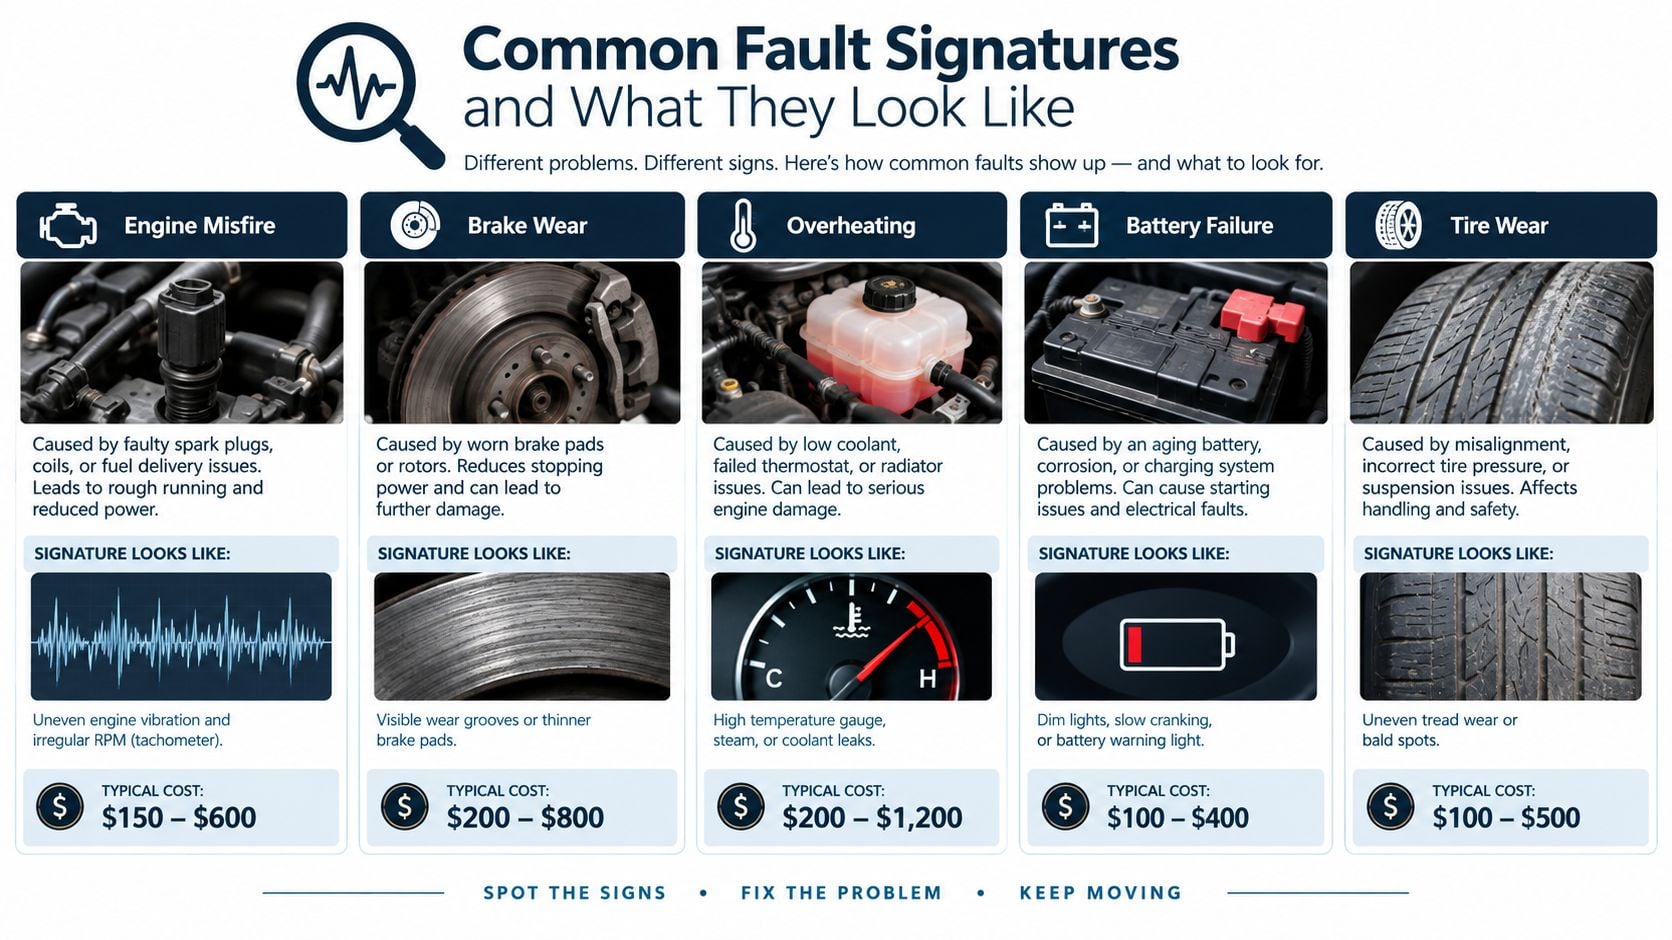
Fault signatures are useful as hypotheses, not verdicts. An analyst should identify the frequency family, check the direction and measurement point, then collect a second piece of evidence before assigning a work order.
Imbalance and misalignment
Imbalance is uneven mass distribution on a rotating component. It commonly produces a dominant 1× running-speed peak in the radial direction. A clean 1× component with relatively little harmonic energy supports the hypothesis, but a resonance can amplify the same order and make a modest imbalance appear severe. A phase reference and consistent radial measurements at both bearing housings provide stronger confirmation than amplitude alone.
Misalignment occurs when coupled shafts aren't collinear. It often raises 1× and 2× running-speed components, with axial vibration becoming important, especially across the coupling. Thermal growth, pipe strain, and looseness can mimic the pattern. An axial comparison across the coupling, combined with phase or a precision alignment check, helps close the diagnosis.
Looseness and bearing wear
Mechanical looseness can generate a series of running-speed harmonics, including 1×, 2×, 3×, and higher components. Structural resonance or a process-induced excitation can create a similar forest of peaks, so the time waveform and an inspection of bearing fits, hold-downs, and structural joints are essential.
Rolling-element bearing wear produces non-synchronous components tied to bearing geometry. The main families are BPFO for an outer-race defect, BPFI for an inner-race defect, BSF for a rolling-element defect, and FTF for a cage defect. Raised high-frequency energy and a matching envelope component support the diagnosis. A bearing fault may be missed if the analyst looks only at a low-frequency velocity spectrum.
Gear defects
A gear defect appears around gear-mesh frequency, the tooth-passing frequency generated when gear teeth engage. Sidebands spaced at the running speed of the affected gear are often more informative than a solitary mesh peak. Load changes, speed errors, and structural resonance can distort the pattern, so the analyst should verify shaft speed, gear ratio, sampling setup, and load state.
The bearing failure resource provides additional context for connecting spectral evidence with physical failure mechanisms. The key habit is simple: every suspicious peak needs a corroborating signal, an operating-state check, or a physical inspection.
Reading Sidebands, Harmonics, and Envelopes
A gearbox on an extruder illustrates why the largest peak isn't always the most useful one. Suppose the spectrum shows a gear-mesh component with two smaller sidebands, each spaced by the defective gear's shaft order. The mesh peak itself may not have risen substantially, but the persistence and spacing of those sidebands across matched speed and load conditions can indicate localized tooth damage.
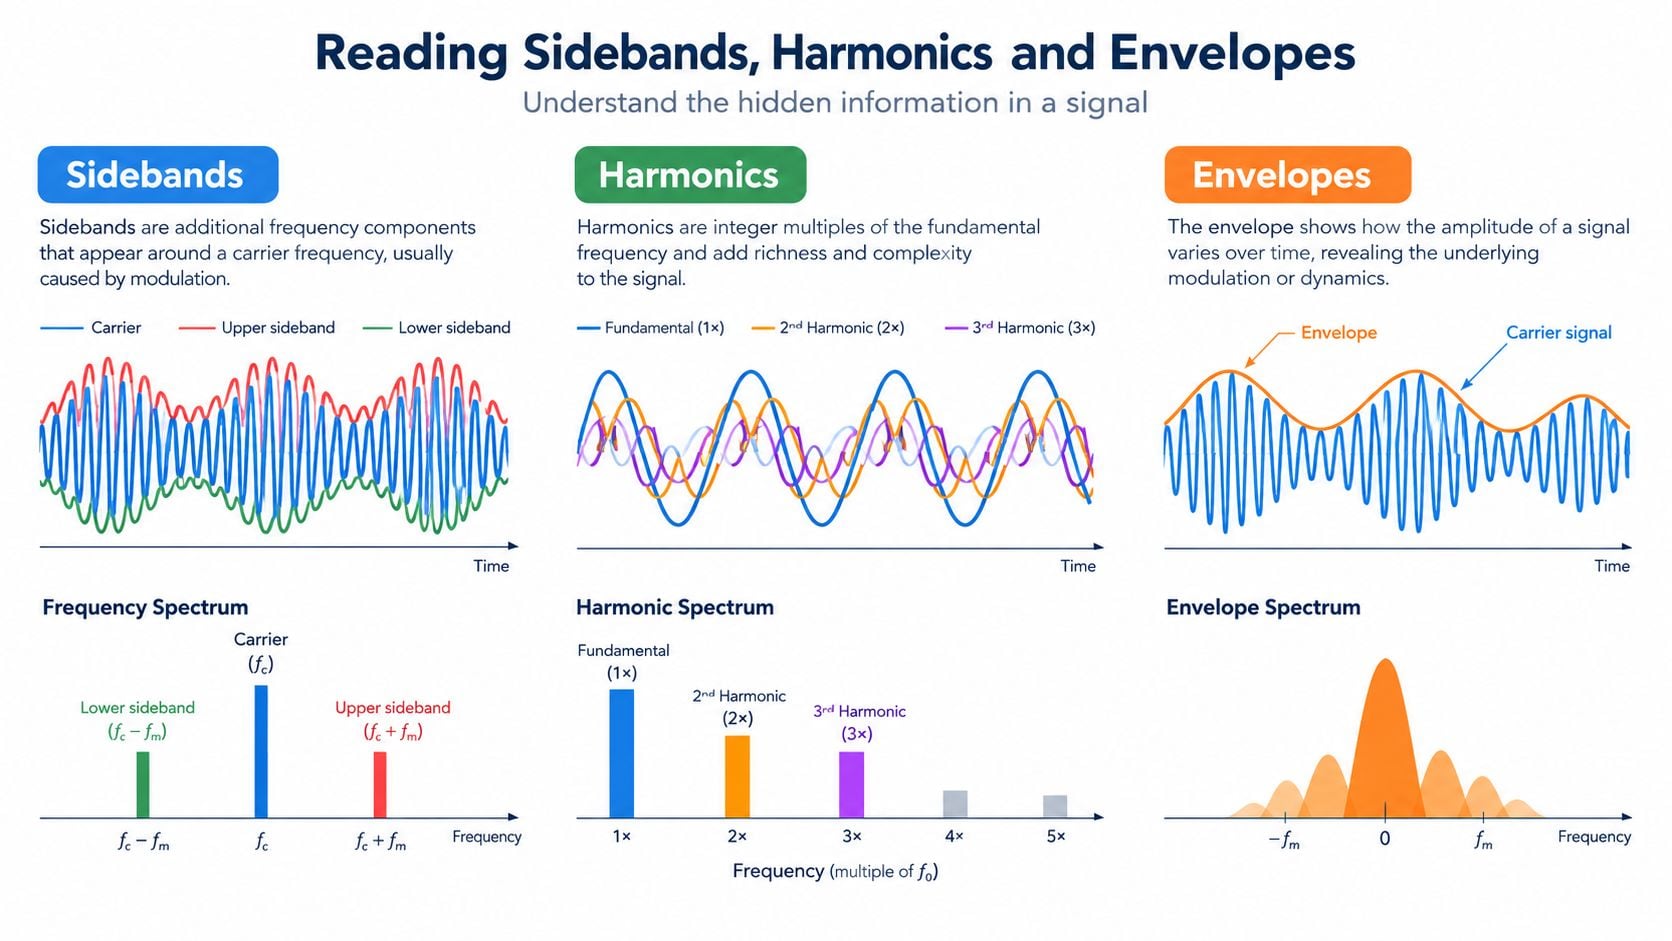
Harmonics repeat a source at integer multiples. A strong 1× peak with a smaller 2× component may support imbalance, while a longer harmonic family can point toward looseness or nonlinear contact. Harmonics become more credible when they remain tied to shaft order as speed changes.
Sidebands indicate modulation. Modulation occurs when one vibration source changes the amplitude of another, such as a damaged tooth altering the force generated at gear mesh. Sideband spacing is diagnostic only when operating speed, gear ratio, sampling rate, and load state are trustworthy. Local gear damage can affect sidebands before it produces a large gear-mesh rise, which makes simple amplitude-threshold advice unreliable.
Envelope analysis finds impacts hidden in the main spectrum
A rolling-element bearing defect often creates a small impact that excites a structural resonance in the bearing housing. The ordinary velocity spectrum may show only a raised broadband floor or a dominant running-speed component from another source. Envelope analysis, also called demodulation, filters and processes the high-frequency ringing so the repetition rate of the impacts can be examined.
Screen rule: Harmonics repeat a source, sidebands modulate a source, and resonance amplifies a source. Those are different mechanisms, even when the displayed peak looks similar.
The team should leave the basic FFT when a narrowband feature remains ambiguous, when impacts appear in the waveform, or when a suspected bearing defect is buried beneath running-speed energy. Time-waveform inspection helps with impacting and looseness. Envelope analysis helps with early rolling-element bearing evidence. Time-synchronous averaging can isolate gear-related content by synchronizing the waveform with shaft rotation.
Route Monitoring and Continuous Monitoring Compared
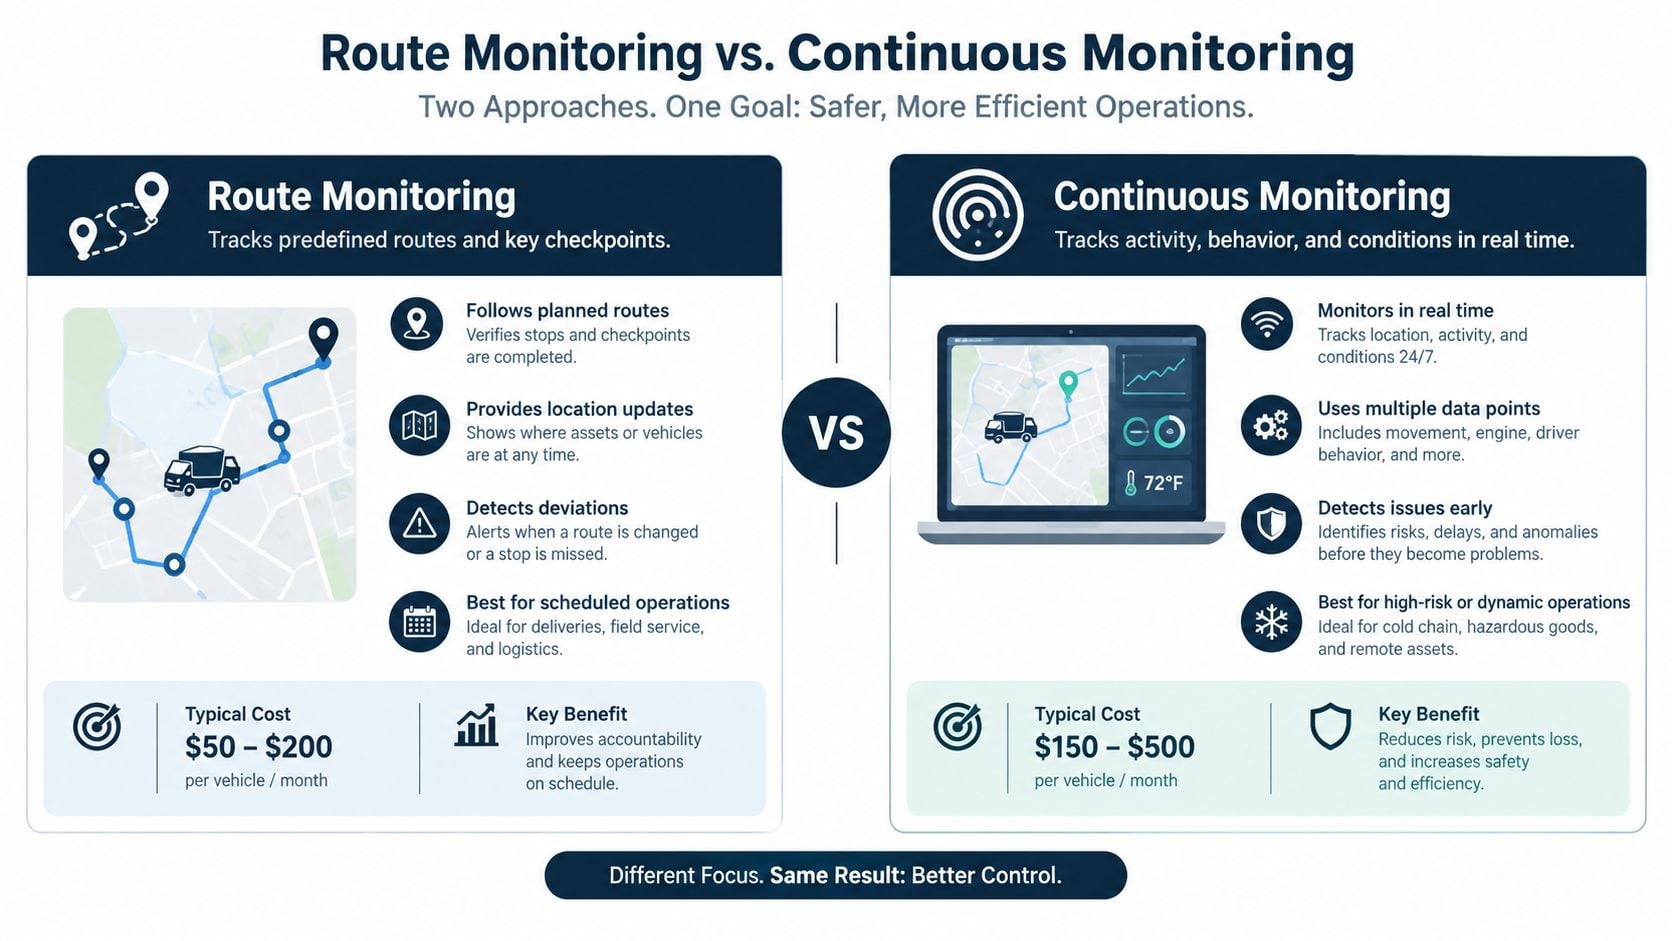
Route monitoring and continuous monitoring solve different coverage problems. A route technician can collect detailed spectra across a broad fleet, but the machine is observed only during scheduled visits. Permanent sensors provide dense time history and faster alarm response, but they demand careful placement, alarm governance, communications, and a defined response process.
A manufacturing plant with many standard motors may use routes for broad coverage and reserve permanent instrumentation for assets whose failure consequences justify continuous observation. A critical process pump, variable-speed compressor, or gearbox with a known weakness may need permanent sensing because the most informative event can occur between route visits.
The workforce decision
| Dimension | Route Monitoring | Continuous Monitoring |
|---|---|---|
| Sensor placement | Technician selects and verifies the point | Sensors remain installed at defined locations |
| Data resolution | Periodic snapshots with full diagnostic detail | Dense history, event capture, and automated trends |
| Alarm response | Analyst reviews findings after collection | System can flag changes as they occur |
| Team workload | Requires route planning and skilled collection | Requires alarm review, data governance, and maintenance response |
| Best fit | Broad fleets and stable, accessible assets | Critical, variable-speed, inaccessible, or rapidly changing assets |
Wireless permanent sensors can provide a practical middle ground, especially when cable installation is difficult. They don't remove the need for route-based diagnostic measurements, because a follow-up investigation may require phase, multiple directions, a wider frequency range, or a controlled operating test.
The broader risk question is how monitoring practices scale with asset count, connectivity, and response obligations. The discussion of managing risk as systems grow offers useful context for making that decision beyond the sensor purchase.
Forge Reliability's vibration analysis tools and services can support programs that combine route diagnostics with continuous monitoring. The recommendation should follow criticality, failure development time, operating variability, and the plant's ability to act on an alarm, not technology preference.
Two Annotated Spectrum Case Studies
Gearbox sidebands on a fin-fan cooler
A fin-fan gearbox is collected at a consistent speed and load after the team notices a change in the spectrum. The first observation is a gear-mesh peak surrounded by sidebands spaced at the shaft order of the affected gear. The overall mesh amplitude hasn't shown a large increase, so a threshold-only program would likely classify the machine as acceptable.
The analyst compares the result with the healthy baseline, verifies the tachometer reference, and repeats the measurement at a matched operating state. The sideband spacing persists, and the time waveform shows repeating impacts at the gear rotation period. Those observations support localized tooth damage more strongly than the absolute mesh amplitude does.
The maintenance decision is a planned gearbox change-out during a scheduled shutdown, followed by inspection of the removed gear teeth. The decision document records the peak family, sideband spacing, speed and load, the confirming waveform, and the reason for planned intervention. If the sidebands had disappeared when speed and load were corrected, the team would have investigated operating-state distortion or resonance instead.
Bearing evidence on a process pump
A process pump shows broadband RMS velocity within the long-term acceptable range, yet the bearing-envelope spectrum contains growing energy at a calculated bearing defect family. The ordinary spectrum remains dominated by running-speed activity, so the overall value gives no clear warning of the developing bearing condition.
The analyst checks sensor mounting, confirms steady operation, compares the envelope trend with the healthy baseline, and inspects the time waveform for periodic impacts. The defect-family energy continues to rise under matched conditions, while the pump's process load remains comparable. That combination supports bearing degradation rather than a temporary hydraulic or structural response.
The maintenance action is a planned bearing replacement, not an immediate trip based on broadband severity alone. After the repair, the team captures a new baseline and verifies that the defect-family energy has receded. The case demonstrates why a spectrum should preserve both severity information and fault-specific evidence.
A Repeatable Workflow from Spectrum to Decision
A reliable program turns every spectrum into a controlled sequence. The analyst first verifies speed, load, process state, sensor location, and measurement direction. The collector then selects the frequency span, resolution, window, averaging, and diagnostic method that fit the suspected fault.
The resulting spectrum is compared with the machine's baseline and applicable severity criteria. A second signal, such as phase, time waveform, envelope energy, temperature, lubrication evidence, or physical inspection, must support the proposed mechanism before the team escalates the work.
Field checklist
- Verify the operating state: Record speed, load, and process condition.
- Confirm the measurement point: Use the same bearing housing and direction.
- Choose the measurement unit: Use velocity for broad severity and acceleration or envelope methods for high-frequency faults.
- Set the frequency span: Capture the highest fault frequency that matters.
- Use suitable resolution: Separate sidebands and nearby components.
- Check the waveform: Look for impacts, clipping, or modulation.
- Compare the baseline: Identify what changed, not only what is high.
- Confirm the mechanism: Use phase, orders, envelopes, or inspection.
- Rank the consequence: Connect the finding to failure impact and outage opportunity.
- Document and trend: Record the evidence and define the next collection or maintenance action.
A team that repeatedly finds ambiguous failures should formalize the investigation through root cause failure analysis. The spectrum doesn't replace engineering judgment. It makes that judgment traceable, repeatable, and easier to defend.
Forge Reliability offers vibration analysis programs that combine FFT spectra, fault-specific diagnostics, route monitoring, and continuous monitoring for industrial equipment. Request a free reliability assessment through Forge Reliability to review collection rules, alarm logic, and which variable-speed or critical assets should receive permanent instrumentation.