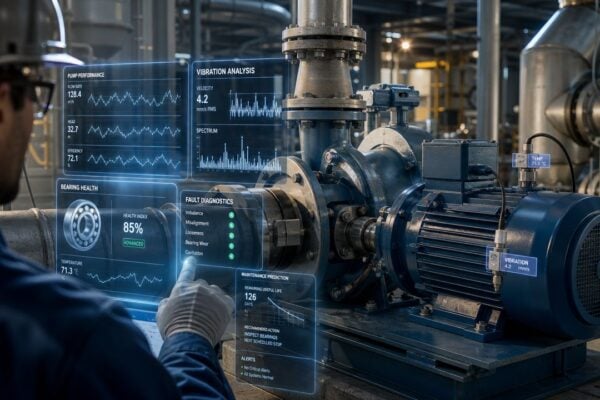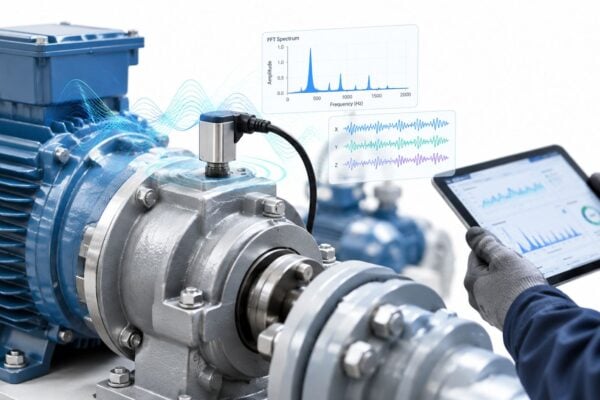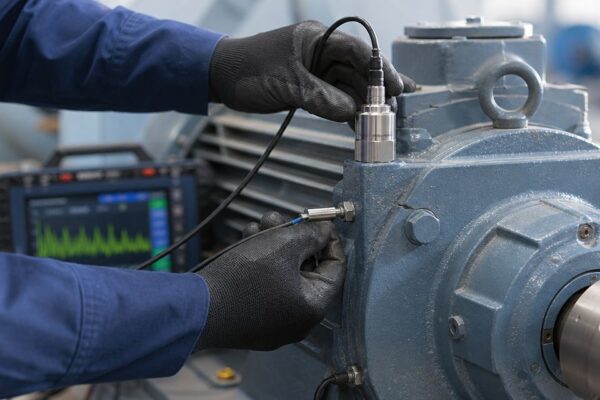
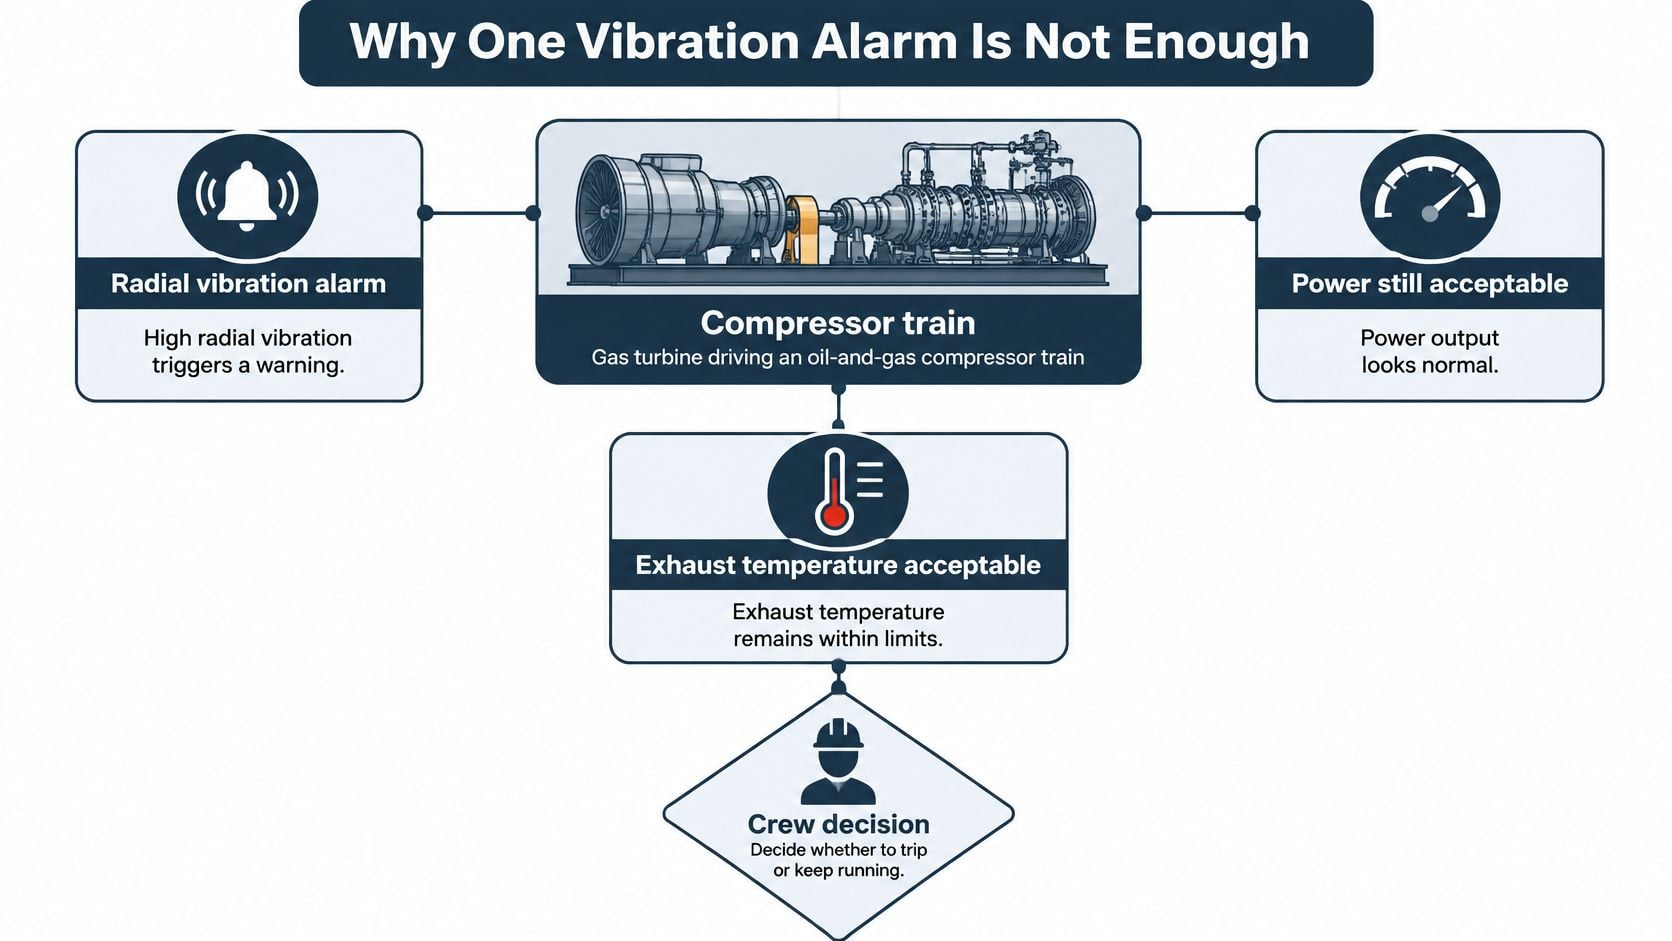
Say a gas plant wakes to a familiar problem. At 02:14 the radial vibration on the drive-end bearing of a frame gas turbine crosses its alert and stays there, while power output holds setpoint and exhaust temperature sits comfortably inside limits. The machine drives a centrifugal compressor on the process train, so a trip means an unplanned flare, a supply interruption and a call nobody wants to make.
The crew has three choices and forty minutes to pick one. Trip and protect the machine. Derate and buy time. Hold load and watch. A single vibration number won't choose between them, because it can't separate a bearing starting to fail from a compressor that fouled three weeks ago, a fuel nozzle drifting, or a thermocouple lying.
The plants that get this call right run gas turbine condition monitoring as four linked evidence streams rather than one alarm panel. That structure is what turns a possible trip into a planned outage.
Table of Contents
- Why One Vibration Alarm Is Not Enough
- Fault Signals and the Response to Make First
- How Shaft Vibration Separates Rotor Faults
- Oil Temperature and Corrected Performance
- Alarms That Fail During Load Ramps
- Hours Versus Starts on a Cogeneration Turbine
- Schedule a Free Reliability Assessment
Why One Vibration Alarm Is Not Enough
A vibration alert on a fluid-film bearing deserves respect, and it's also the least complete piece of evidence on the panel. The proximity probes that produce it measure shaft displacement inside the bearing, and they're very good at catching imbalance, misalignment, rotor instability, rubs and bearing wear. They can't see compressor fouling, a failing fuel nozzle, turbine-section deterioration, or a thermocouple that has drifted out of calibration, because none of those faults move the shaft in a way a displacement probe recognizes.
That division of labor has been understood since the field began. A review of the development of gas-turbine condition monitoring traces it from T. C. Rathbone's 1939 guide "Vibration Tolerance", which judged machine condition from displacement between roughly 60 and 7,200 cycles per minute, about 1 to 120 Hz, through the spectral analyzers of the 1970s and the computerized shaft-vibration prototype installed during commissioning of the Doel 4 nuclear plant in 1985. Each step widened what a vibration signal could explain. None of them made it sufficient on its own.
The analogy that survives a plant floor is medical. Vibration is the pulse, gas-path temperatures and pressures are the bloodwork, and lube-oil analysis is the lab panel. A racing pulse points at a problem area without saying whether the cause is a blocked artery or a fever.
A diagnosis needs all three channels, and it needs the trend, not the single reading.
Every practical program rests on four channels: shaft vibration, lube oil, temperature including exhaust spread, and corrected performance. Run them through one architecture, protection trips for safety, diagnostic spectra for fault naming, and slow trends for maintenance planning, and the 02:14 call gets an evidence-based answer instead of a coin toss.
None of it holds up without a clean equipment record. A prediction is actionable only when the measurement is tied to a tag, a bearing position and a repair history, and asset tracking for Australian manufacturers sets out how to keep that record usable as machines are replaced. The same discipline sits behind condition monitoring systems that keep protection separate from diagnosis and trend analysis, so a shutdown relay never depends on a chart a human is still interpreting.
Fault Signals and the Response to Make First
A flexible gas turbine can show a new vibration pattern during a load ramp, after a fuel-quality change, or when an instrument drifts. The maintenance decision depends on separating those conditions from a fault that should change the outage scope. Start with failure modes and their consequences, then choose the signals that distinguish them.
A U.S. government fault-tree study of a gas-turbine plant found that 23 single failures dominated unavailability, each with a failure probability above about 4.5 × 10^-5 per 500 hours, and concluded that more than 90% of total plant unavailability came from only 28 single-component failures or single human errors in procedures (fault-tree study of a gas-turbine plant). That supports a focused watch list: direct alarm cleanup, monitoring, and root-cause work toward the events most likely to force an outage.
The response depends on the evidence. A mechanical signature calls for an equipment investigation; a gas-path change may call for a wash or inspection; repeated trips without a matching machine signature call for a review of procedures, alarm setpoints, and recent control changes.
The eight modes that set the watch list
| Failure mode | Primary indicators | Do not confuse with | First response |
|---|---|---|---|
| Rotor imbalance | Rising 1× radial vibration with stable phase | Exhaust-spread or efficiency change | Plan balance or coupling check if still below trip |
| Misalignment | 1× and 2× radial and axial vibration, phase shift across the coupling | A single hot combustor thermocouple | Review alignment and thermal growth |
| Journal bearing wear or instability | Growing subsynchronous orbit, rising metal temperature, oil debris | Compressor pressure-ratio loss alone | Reduce load and sample oil before a continued run |
| Compressor fouling | Corrected power and efficiency down, fuel flow up, vibration near baseline | A sudden step change in one reading | Review inlet filtration and plan a wash |
| Combustor or fuel-nozzle fault | Widening exhaust-temperature spread, one hot channel | A uniform exhaust rise that tracks ambient conditions | Trend the pattern; a fast imbalance means derate or stop per the OEM manual |
| Non-recoverable hot-section damage | Efficiency stays down after a wash, borescope cracking, erosion, or coating loss | Fouling that recovers after cleaning | Set inspection scope and pre-order parts |
| Sensor or instrumentation fault | One channel disagrees with physics and has no second parameter | Degradation seen on several independent signals | Prove the instrument before authorizing an outage |
| Human or procedure error | Repeated trips with no mechanical or gas-path signature | A clear spectral or performance fault | Review the procedure, alarm setpoints, and recent work |
Use the table to set the next action, not to assign a fault from one reading. A rising 1× radial value with steady phase supports a balance or coupling check while the machine remains below trip limits. If exhaust spread widens and corrected power falls at the same time, investigate the gas path before assigning the work to rotor balance.
Working rule: Match each abnormal alarm to a failure mode, then decide whether the evidence supports trending, derating, or a procedure review.
Repeated trips without a mechanical or gas-path signature point toward a setpoint or startup-procedure gap, particularly when control settings or procedures have changed. Confirm the instrument and compare the event record with the procedure before authorizing an outage. Apply the watch list to the next abnormal alarm before approving another sensor purchase.
How Shaft Vibration Separates Rotor Faults
A gas turbine can show higher vibration during a load ramp without developing a rotor fault. The decision depends on whether the change follows operating state or persists as a repeatable pattern at comparable speed and load.
1× is vibration at shaft rotational speed, the once-per-revolution component. A harmonic is a whole-number multiple of that speed, such as 2×. Phase is the vibration peak's timing relative to a once-per-revolution reference mark. An orbit is the shaft centerline path inside a fluid-film bearing, calculated from two proximity probes mounted at 90 degrees.
Frequency-domain models can support fault diagnosis and alarm setting for defined turbine failure modes (frequency-domain vibration modeling for turbine fault diagnosis). For trending, establish each bearing's radial and axial vibration baseline at stable speed and load. Track 1× amplitude, harmonics, sidebands, phase and bearing-envelope energy alongside the overall value.
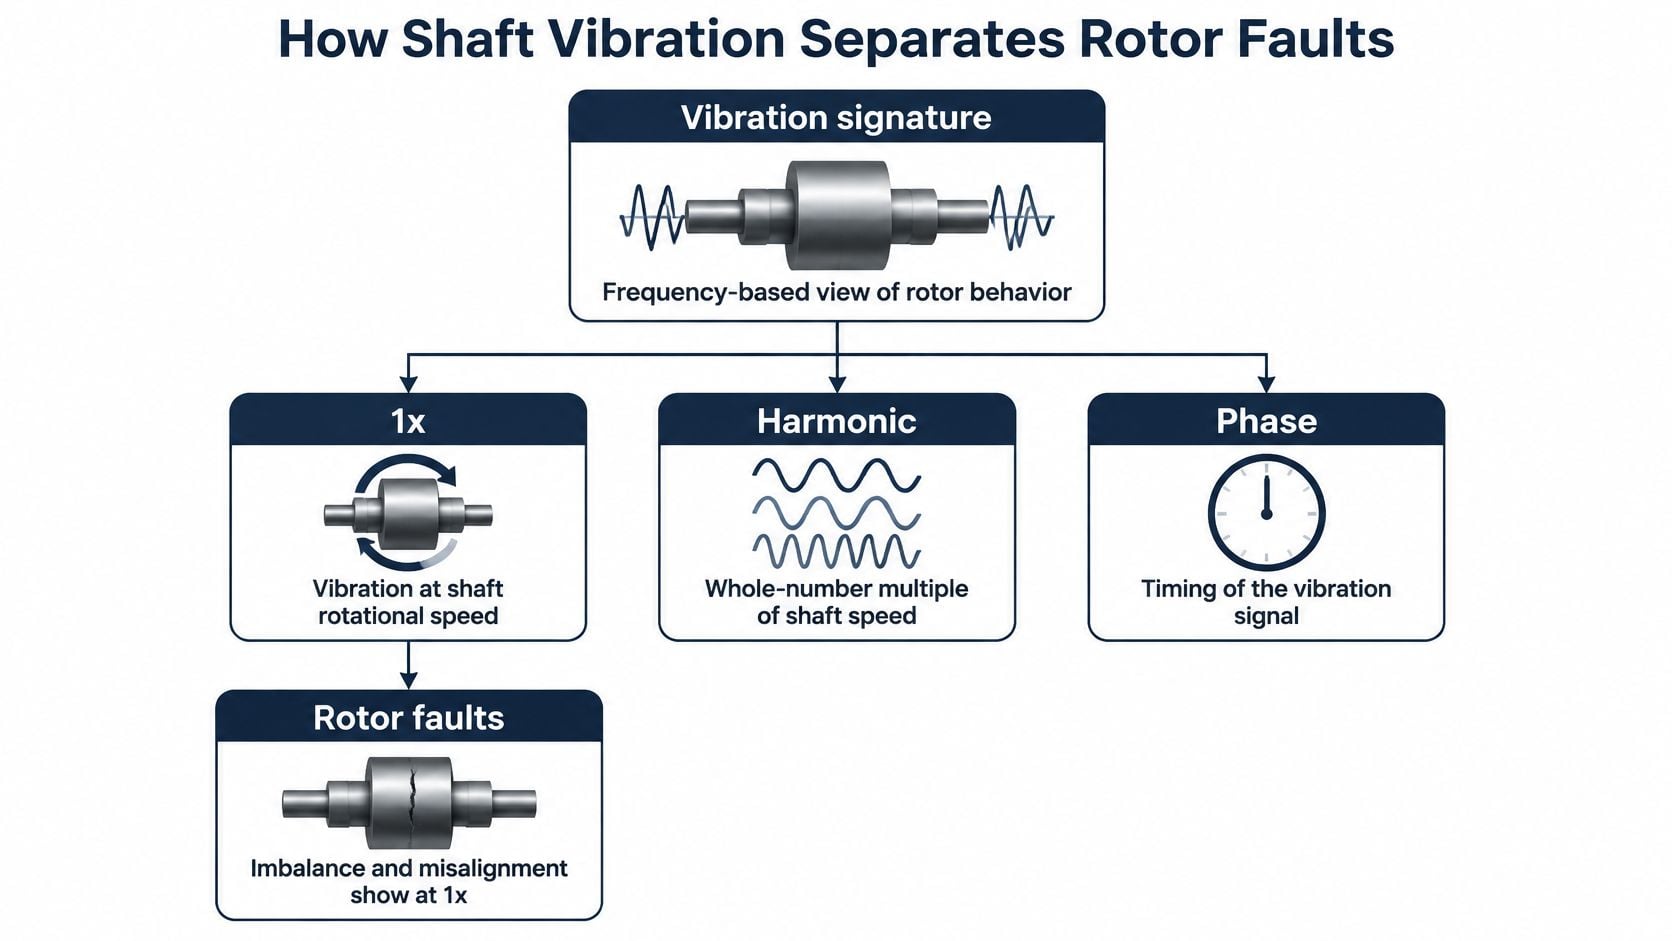
What each signature points to
- Imbalance: 1× rises with fairly stable phase, and amplitude tracks speed more closely than load.
- Misalignment: 2× grows alongside 1×, with a phase shift across the coupling as the machine moves from cold to hot.
- Rotor rub: the orbit becomes constrained and the waveform truncates, sometimes after a start or seal change.
- Bearing instability or wear: subsynchronous energy grows and shaft centerline position shifts. A simultaneous rise in bearing metal temperature strengthens the case for inspection.
Set alarm logic by operating state. Startups, load changes and speed swings can move vibration without mechanical deterioration. Machine-learning classification can help prioritize alerts, but its reported detection efficiency depends on the test conditions and does not establish field accuracy on another unit. Keep spectral rules as the protection and explanation layer; use statistical models only to prioritize alerts for human review.
When a trend crosses a state-adjusted alert, verify phase and coherence. Check the adjacent gearbox or driven compressor, then compare the event with speed, load, lube-oil temperature and recent maintenance before approving an outage.
Sampling must capture the operating conditions that could change the decision. Use continuous probes on critical bearings, fixed-interval route readings on other points, and event-triggered capture during starts and load ramps. The gas turbine vibration analysis approach should match monitoring frequency to equipment criticality and the operating events that matter.
Practical rule: treat an anomaly as a rotor fault only when its spectral and phase behavior persists at comparable operating states. Otherwise, first establish whether the change followed a load ramp, fuel change or sensor problem.
Oil Temperature and Corrected Performance
Vibration won't convict a bearing on its own. Lab work finishes the case. Lube-oil analysis measures viscosity, water content, particle count and wear metals, and it corroborates bearing distress that orbits and metal temperature have already hinted at. A rising particle count with iron or copper in the spectrometric results moves a bearing concern from suspicion to planning.
Temperature tells the other half of the story. Exhaust-gas temperature, or EGT, is the temperature measured in the turbine exhaust flow, and EGT spread describes how unevenly that heat is shared among the exhaust thermocouples. Research on an industrial PG6551B gas turbine found that EGT uniformity can reflect turbine ablation, combustion-component faults and fuel-system failures (EGT distribution diagnostics on an industrial gas turbine). A localized rise or a widening spread can mark one combustor or fuel nozzle while the average EGT still sits inside its limit.
That distinction changes the response. A stable pattern supports a planned inspection. A rapidly developing imbalance warrants load reduction or shutdown per the OEM operating manual, because hot-streaking damages downstream turbine hardware faster than any trend review can catch up.
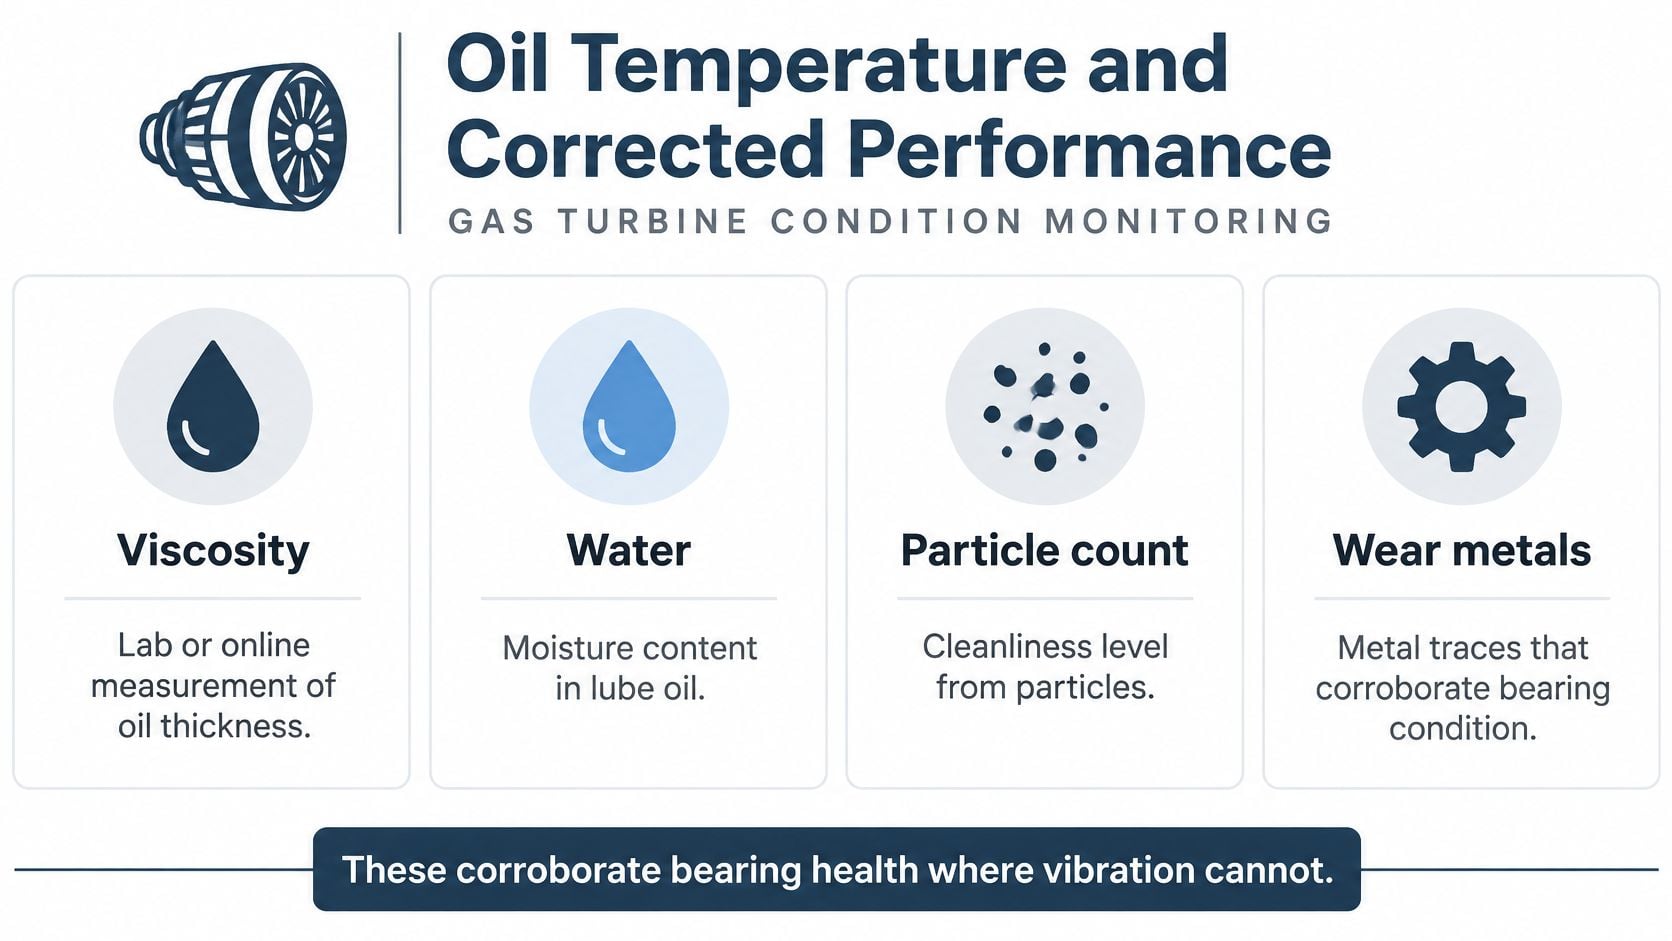
Corrected performance and the wash test
Compressor fouling is the dominant degradation mode for a reason. A peer-reviewed review reports that fouling is the most common cause of compressor deterioration and accounts for approximately 70% to 85% of performance degradation in gas-turbine engines (review of compressor fouling in gas-turbine engines).
The monitoring job is to compare corrected values, not raw ones. Trend corrected compressor discharge pressure, pressure ratio, EGT, fuel flow, power output and calculated compressor and turbine efficiency against ambient temperature, inlet pressure, humidity, shaft speed and load. Raw numbers generate false alarms whenever weather or dispatch moves the operating point.
The shape of the change does the diagnostic work. A gradual corrected-power loss with worsening fuel efficiency points at fouling. A step change points at erosion, a sensor, or a control-system fault. After a wash, verify that corrected output recovered before declaring the loss permanent. If efficiency stays down after cleaning, the loss is non-recoverable and the question becomes inspection scope.
Classification tools are entering thermal monitoring as well. A 2025 study published in Machines reported an XGBoost model for gas-turbine thermal condition monitoring at 97.2% classification accuracy with a 96.8% F1-score. Read that as proof triage can be automated, not as a promise about another site's data.
Check the driven process compressor too, because train-level performance loss isn't always in the engine.
Finally, pair performance trending with inlet-filtration reviews and wash planning, and use oil analysis on gas turbines to confirm metal-in-oil findings before a bearing inspection is scheduled.
Alarms That Fail During Load Ramps
A gas turbine following intermittent renewable generation may move from low load to high load before a steady-state alarm baseline can adjust. During that ramp, an alarm can reflect changing operating conditions, a sensor problem, or a fault that should change the next outage decision.
A 2025 study in Energy notes that fault-diagnosis research often focuses on rotating components at steady state, leaving interactions among bearing faults, whole-engine performance, and transient behavior less explored. Its dynamic-compensation method classified gradual and abrupt faults during transients, with an average computation time of 0.1152 seconds and a peak error of 0.0143%. These results show what the method achieved in the study, not what another unit's data will deliver.
Normalize by operating state
Build separate baselines for startup, low load, and high load. Compare each reading with the baseline for the operating state in which it was recorded. This reduces false alarms when vibration, speed, pressure ratio, or exhaust conditions shift during a ramp, while making it easier to spot signals that do not fit the expected response.
Use persistence and corroboration to sort the signal:
- Ramp-related signatures fade after load stabilizes and the thermal transient ends.
- Bearing, fouling, or erosion signatures persist at stable load and align with another indicator, such as oil results or corrected performance.
- Sensor faults appear in one measurement without a matching change elsewhere in the train.
Route measurements can miss a brief event during acceleration. Continuous or event-triggered capture on critical bearings can record a transient rub that lasts only briefly. ISO vibration standards help set vibration zones, but do not define acceptance criteria for every transient.
Fuel changes move the target too
A fuel blend change can shift combustion behavior as well as emissions. A review of hydrogen and carbon-monoxide-rich fuel effects on gas turbines reports potential fuel-nozzle damage from flashback in hydrogen- or CO-rich mixtures. It also describes cases where hydrogen addition reduced CO₂ and CO while increasing NOx, and where cycle efficiency moved in different directions at different hydrogen concentrations. The response depends on the blend; a simple rule based only on hydrogen content can mislead.
Before and after a blend change, trend fuel flow, emissions, exhaust-temperature spread, combustion dynamics where instrumented, and vibration together. An emissions excursion can provide a second signal for assessing combustion integrity.
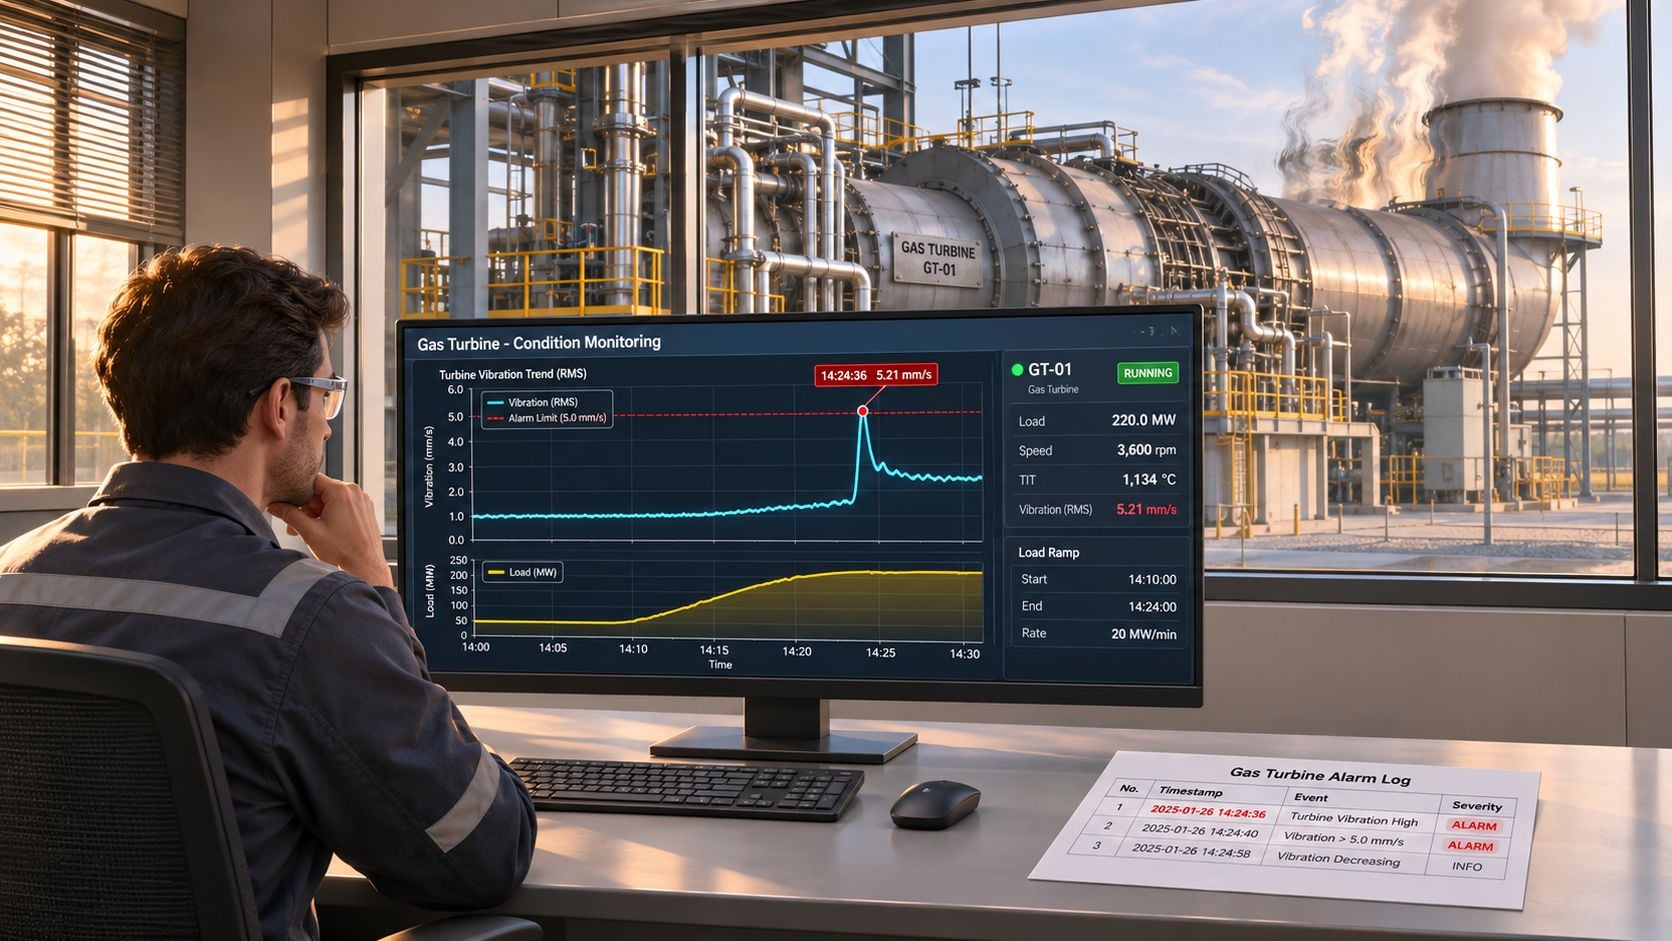
Hold intrusive maintenance until a second, independent signal supports the finding. The crew needs to determine whether the anomaly came from the transient, a sensor, or a fault that should move the next outage.
Hours Versus Starts on a Cogeneration Turbine
A cogeneration turbine that cycles with steam demand can reach its start limit while its fired hours still look modest. If starts will govern the next outage, planning by hours alone leaves too little time to assess findings and secure parts.
Published planning guidance for a GE heavy-duty gas turbine sets a hot-gas-path inspection at 24,000 hours or 1,200 starts, and a major inspection at 48,000 hours or 2,400 starts. Whichever threshold comes first controls the outage (GE planning guidance for heavy-duty gas turbines). A hot-gas-path inspection covers combustion and turbine components exposed to high-temperature gas. A major inspection includes deeper internal examination and component assessment.
| Inspection | Hour limit | Start limit | What it examines |
|---|---|---|---|
| Borescope | Annual or semiannual visual interval | Annual or semiannual visual interval | Compressor, combustor, and turbine hardware through access ports |
| Hot-gas-path inspection | 24,000 hours | 1,200 starts | Combustion and turbine parts exposed to hot gas |
| Major inspection | 48,000 hours | 2,400 starts | Deeper internal examination and component assessment |
These are planning references, not universal limits. Fuel, load profile, trips, environment, and inspection findings can change the timing under the OEM's technical instructions. Equivalent hours and equivalent starts adjust operating history for severity, so a trip-heavy period counts differently from gentler operation. FM Global's gas-turbine guidance describes intervals based on equivalent hours and starts, and recommends borescope inspections according to the OEM program and at least annually.
When starts run out before hours
Each start adds a thermal cycle. A turbine that repeatedly follows steam demand can approach its start limit well before its hour limit, unlike a unit with steadier operation.
A borescope is an optical or video probe inserted through access ports to inspect hardware without lifting the casing. It can reveal cracking, burning, erosion, deposits, loose hardware, coating loss, and foreign-object damage between major outages.
Consider a case where corrected efficiency does not recover after a wash, and a borescope inspection shows coating loss on the first-stage nozzle. Fired hours remain below 24,000, but the findings support bringing the hot-gas-path inspection forward and pre-ordering parts. If the start count will reach 1,200 first, begin the outage review before reaching that threshold.
The gas turbine maintenance planning approach should tie the binding limit to inspection findings and parts lead times. That gives the team a clear basis for deciding whether to move the outage.
Schedule a Free Reliability Assessment
Before the next planned outage, check whether the monitoring program can separate a real fault from a change in operating conditions. Can the crew identify which fault mode an alarm may indicate, distinguish a load ramp or fuel change from a sensor issue, and determine whether the next inspection is governed by hours or starts? If not, review coverage and alarm logic before adding another dashboard.
Forge Reliability's gas turbine monitoring includes programs for pulp and paper mill cogeneration, addressing hot section wear, heat recovery steam generator (HRSG) integration, and power output. Its gas turbine programs for refinery combined heat and power and pipeline compressor drives use hot section and control programs to optimize reliability.
Book a free reliability assessment to discuss the monitoring needs for your turbine and its operating context. Set the outage scope and parts decisions against the condition evidence available to your team.