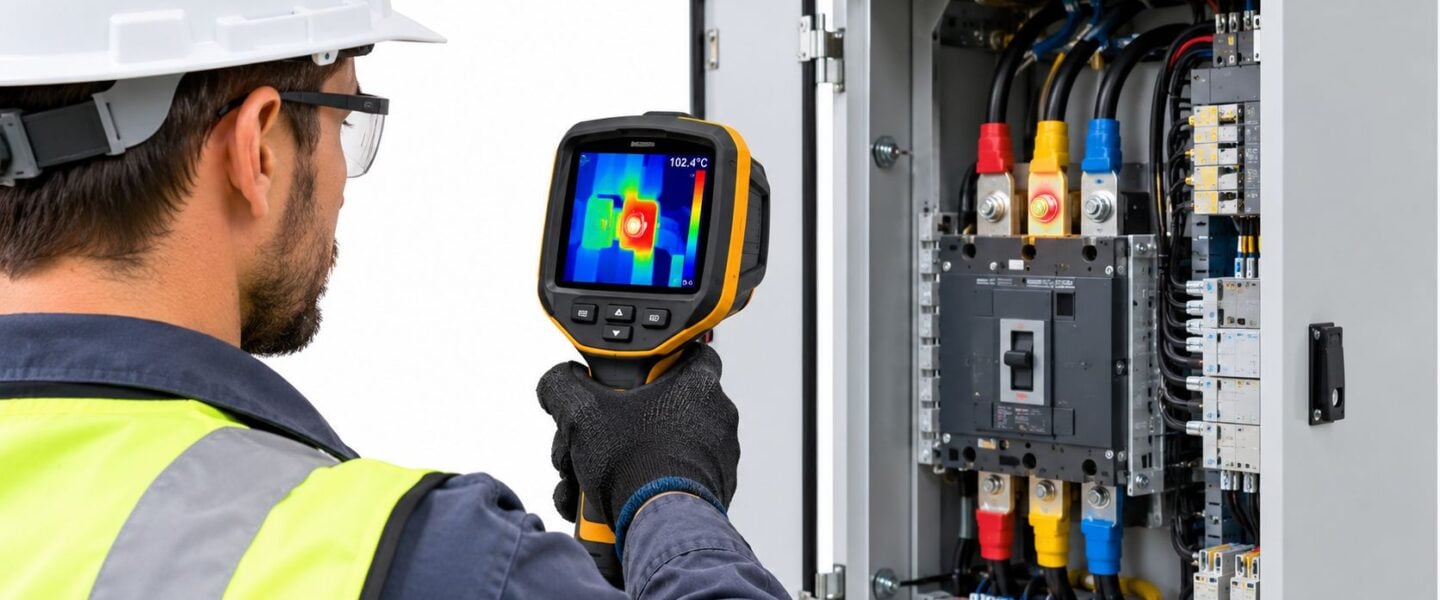
At 2 a.m., a reliability engineer stands in front of an open motor control center, watching a 14°C hotspot bloom on the B-phase lug of a 600-amp feeder. The camera has found something, but it hasn't answered the only question that matters on shift: does the plant need to act now, or is this a finding that needs verification?
That decision is the core work of thermography results interpretation. A thermal image isn't a repair order, a shutdown command, or proof of internal damage. It's evidence that must be weighed against load, baseline condition, measurement quality, equipment design, and other diagnostic signals.
A sound program turns thermal anomalies into ranked reliability actions. A weak one produces colorful images, inconsistent severity calls, and work orders built on readings that may not reflect equipment condition.
Table of Contents
- What Thermography Results Interpretation Actually Means in Practice
- The Four Parameters That Decide Whether Your Image Is Trustworthy
- Reading Electrical Hot Spots and Phase-to-Phase Delta-T
- Mechanical Signatures on Motors, Pumps, and Bearings
- Severity Bands and Pass-Fail Criteria That Work On Shift
- False Positives That Trigger Bad Shutdowns and How to Catch Them
- From Periodic Scans to Continuous Monitoring and Follow-Up Inspections
What Thermography Results Interpretation Actually Means in Practice
The engineer looking at the feeder shouldn't record only the hottest pixel. A usable result includes the measured temperature, the delta-T, operating load, ambient conditions, comparable reference points, and a confidence note explaining whether the image is technically reliable.
Delta-T means the temperature difference between the suspect component and a comparable component. In a three-phase feeder, that usually means comparing the same lug or termination across phases under similar loading. In a motor train, it may mean comparing the drive-end bearing with the non-drive-end bearing, a neighboring machine, or the same asset's historical baseline.
The reliability chain behind a thermal image
A practical interpretation sequence looks like this:
- Verify the target. Confirm that the cursor is on the intended lug, bearing housing, fuse connection, or busbar surface, not on a reflection, edge, label, or background object.
- Check measurement conditions. Record load, ambient temperature, viewing angle, distance, focus, and surface condition.
- Compare, don't isolate. Use similar phases, adjacent components, parallel cubicles, or previous scans as references.
- Classify the likely failure mode. A warm electrical connection may indicate increased resistance. A broad mechanical rise may point toward friction, poor lubrication, or misalignment.
- Assign action and confidence. The finding should state whether the team should monitor, plan corrective work, verify with another test, or escalate for immediate risk review.
Formal standards support this approach. ASTM E1934 guidance on infrared examination of electrical and mechanical equipment associates warm electrical anomalies with increased resistance from loose connections, load imbalance, or faulty components. For mechanical equipment, warm patterns can indicate friction related to improper lubrication, misalignment, or worn parts, while cool anomalies can indicate component failure.
Why absolute temperature misleads
Absolute temperature matters when it approaches a material or equipment limit, but it often has less diagnostic value than the comparison. A heavily loaded feeder can run warmer than a lightly loaded feeder without having a defect. Conversely, a modestly warm lug can be the most important finding in a panel if its phase-to-phase difference is abnormal and rising.
The industrial thermography inspection guidance from Forge Reliability reflects the practical distinction between collecting an image and making a maintenance decision. Interpretation must connect the thermal pattern to operating conditions and a credible failure mechanism.
Practical rule: A thermogram becomes actionable only after the analyst can explain what is hot, compared with what, under which load, and why the pattern makes physical sense.
The Four Parameters That Decide Whether Your Image Is Trustworthy
A thermal camera calculates temperature from infrared radiation. It doesn't directly measure the internal temperature of a lug, bearing, conductor, or contact surface. Four field parameters determine whether the displayed value deserves confidence: emissivity, reflected apparent temperature, ambient temperature, and distance with atmospheric conditions.
Emissivity
Emissivity describes how effectively a surface emits infrared radiation. Painted and oxidized surfaces are usually easier to measure than polished metal. If a painted busbar is entered into the camera as bare copper, the displayed value can read 8 to 15°C cool, masking a genuine electrical defect. That range is documented in the electrical and mechanical thermography inspection resource.
The field response is simple: measure a suitable high-emissivity reference surface, use an approved reference marker where safe and appropriate, or correct the setting after confirming the surface condition. A polished termination shouldn't be treated as an ordinary matte component.
Reflected apparent temperature
Reflective surfaces can show radiation from nearby objects rather than their own condition. A shiny stainless enclosure may reflect a hot oven into the image and create an apparent hotspot that doesn't belong to the enclosure or component.
The analyst should change position, inspect from another angle, and identify radiant sources such as furnaces, steam lines, heaters, or sunlight. If the hot area moves or changes dramatically with viewing angle, confidence in the original reading should fall.
Ambient temperature
Ambient conditions affect heat transfer and comparison. Outdoor switchgear exposed to sunlight, cold air, or changing weather may show gradients unrelated to an electrical fault. The inspection record should capture ambient temperature and whether the equipment had recently experienced solar loading, washdown, or process changes.
Distance and atmospheric effects
Short-distance panel scans usually tolerate atmospheric effects better than long-distance inspections. A transformer viewed from 20 feet away can show a temperature reduction of 3 to 5°C from atmospheric attenuation if the camera parameters don't account for distance and humidity. The practical correction is to enter distance and atmospheric humidity, maintain focus, and avoid using a distant reading as a precise trend point unless the setup is repeatable.
| Parameter | What it controls | Typical field error if ignored | On-site mitigation |
|---|---|---|---|
| Emissivity | How surface radiation is converted into temperature | A reflective or incorrectly configured surface reports a misleading value | Verify surface condition and use a suitable reference |
| Reflected apparent temperature | Radiation reflected from nearby heat sources | A hot oven or pipe appears to heat the inspected component | Change angle and identify radiant sources |
| Ambient temperature | Heat transfer and comparison context | Outdoor or process conditions distort the apparent anomaly | Record ambient conditions and inspection timing |
| Distance and humidity | Atmospheric attenuation between target and camera | A long-range reading trends lower than the actual comparable reading | Record distance and humidity, then repeat the setup |
The four values should be written directly on the inspection record. That discipline lets another analyst repeat the measurement and prevents a future trend chart from mixing incompatible conditions.
Reading Electrical Hot Spots and Phase-to-Phase Delta-T
A 600-amp motor control center feeder illustrates why delta-T usually beats absolute temperature for first-line triage. At no load, all three phases may remain close together. At 40% load, the absolute temperatures rise, but a healthy connection should maintain a relatively stable relationship with the other phases. At 80% load, every phase may be warmer, yet a loose B-phase lug can begin separating sharply from the healthy A and C phases.
The bad habit is to see the hottest phase and ask whether its absolute temperature looks alarming. The better question is whether the same component on that phase is materially different from comparable components under the same electrical conditions.
A practical comparison
| Operating state | Healthy connection pattern | Suspect loose-lug pattern | Interpretation |
|---|---|---|---|
| No load | Low temperatures with little phase difference | Difference may be muted | Treat as a weak screening condition |
| 40% load | Absolute temperature rises, delta-T remains consistent | B-phase begins separating | Verify loading and measurement quality |
| 80% load | All phases rise while relative balance remains stable | B-phase delta-T widens | Plan electrical verification and corrective action |
For similar equipment under similar loading, analysts often use under 10°C delta-T as a monitoring condition, 10 to 25°C as an investigation point for the next outage, and above 25°C under normal load as a scheduled repair concern. These bands aren't substitutes for engineering judgment. A finding that grows between inspections deserves priority even if it hasn't crossed a preferred band.
The electrical fault detection guidance from Forge Reliability fits this workflow because the thermal result has to be connected to the likely failure mode, not treated as an isolated color change.
What invalidates the comparison
Phase-to-phase comparison fails when the phases carry different loads, when one conductor has a different geometry, or when the analyst compares different component types. Ambient swings can also change absolute temperature, while a parallel cubicle may provide the better reference than another phase in the same feeder.
Record delta-T, load percentage, ambient temperature, viewing conditions, and the exact component inspected. If the B-phase lug is hot, inspect the identical lug on a parallel cubicle and compare current or load data before assigning a shutdown.
Mechanical Signatures on Motors, Pumps, and Bearings
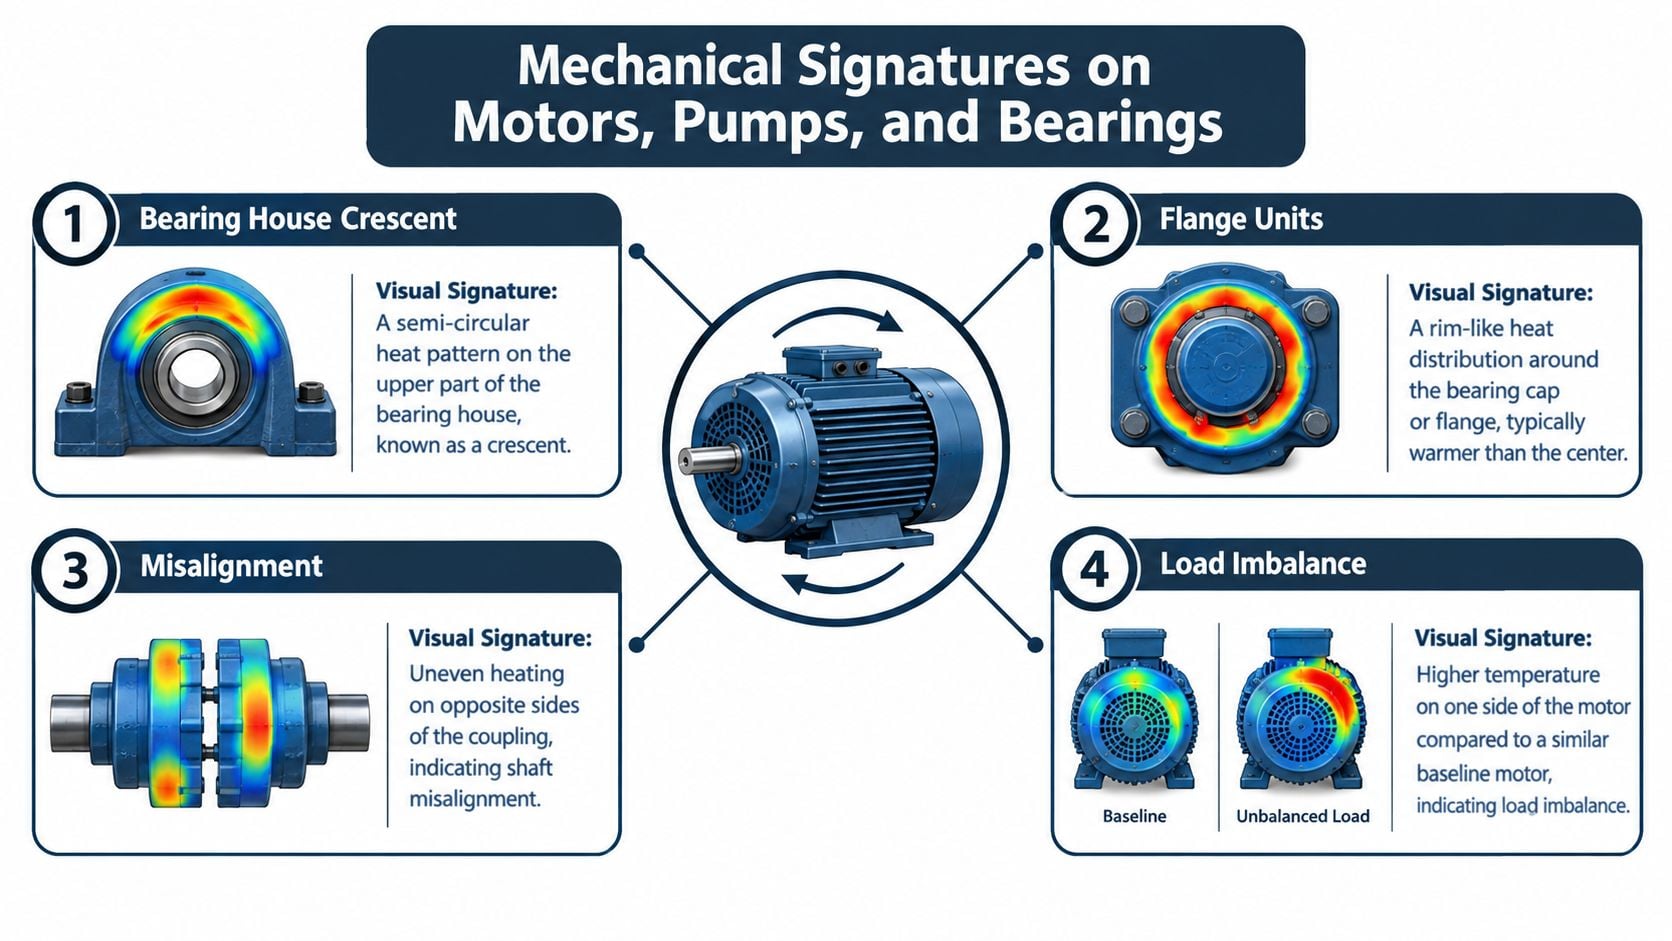
Mechanical thermography becomes useful when the analyst reads shape, symmetry, and change from baseline together. A pump bearing that is warmer than its housing isn't automatically failing. A localized rise on the loaded side, paired with increasing vibration, carries a different meaning from a broad, uniform housing temperature increase.
Pattern before temperature
A pillow-block bearing can show a crescent-shaped warm area around the bearing house. A flange-mounted unit may show a rim-like distribution around the bearing cap. An axial stripe along a motor shaft or coupling can suggest misalignment or coupling imbalance, but the guard, shaft fan, or nearby reflective surface may distort the pattern.
A symmetric band across a drive-end bearing shell can help distinguish load distribution from lubrication starvation. The thermal signature still needs a second diagnostic method because surface temperature doesn't reveal the internal contact condition directly.
Broad, dull heating usually fits friction, poor lubrication, or an external heat source. A sharp, localized hotspot in the load zone is more consistent with a concentrated defect or impact-related damage. The distinction is probabilistic, not conclusive.
The lowest-cost confirmation test
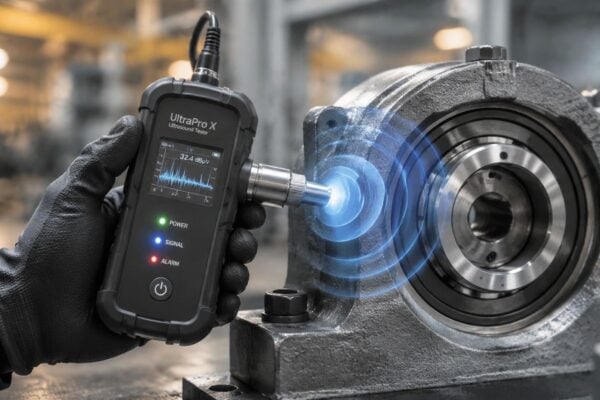
- Vibration FFT: Use frequency-domain vibration data to look for bearing or imbalance signatures when the thermal pattern is localized or asymmetric.
- Oil sampling: Check lubricant condition when the housing shows broad heating and lubrication starvation is plausible.
- Laser alignment: Verify shaft and coupling alignment when opposite sides of the coupling show unequal heating.
- Amp-draw comparison: Compare motor current when the thermal pattern may reflect load imbalance rather than a bearing defect.
For bearings, a 10°C rise from baseline combined with rising vibration is described in industry guidance as strong confirmation of degradation. A thermal rise without a vibration change can instead indicate lubrication starvation or an external heat source, as outlined in the bearing inspection application guidance.
Surface interference
Coupling guards can hide the actual hot zone. Shaft-mounted fans create airflow that cools one side of the housing. Reflective fan shrouds can return radiation from nearby equipment and make the apparent pattern look more severe or more balanced than it is.
A side-by-side spot and area comparison on the same component is more useful than a single maximum value. The spot identifies the local peak, while the area measurement shows whether the heat is concentrated, spreading, or broadly distributed across the housing. For recurring bearing problems, the failure analysis guidance on bearing failures should be paired with thermal evidence, vibration, lubrication history, and alignment findings.
Severity Bands and Pass-Fail Criteria That Work On Shift
A night-shift operator needs a triage method that is clear enough to apply without waiting for a thermographer to interpret every image. Delta-T bands provide that first decision layer, but they should be normalized against load and comparable equipment.
A 15°C rise at 30% load can represent a stronger fault signature than a 30°C rise at full load if the lightly loaded component is expected to remain nearly balanced with its references. Absolute cutoffs lose value when the comparison is poor.
Four-band field triage
| Band | Delta-T range (°C) | Response action | Re-inspection interval |
|---|---|---|---|
| Band 1, awareness | Less than 10 | Log, verify basic conditions, and trend | At the next planned route |
| Band 2, plan | 10 to 20 | Create corrective work and schedule repair within 30 days | Recheck before the planned intervention |
| Band 3, urgent | 20 to 35 | Verify load, escalate to maintenance planning, and schedule within 72 hours | Recheck after load verification or before repair |
| Band 4, critical | More than 35 | Isolate at the next safe opportunity, subject to plant risk controls | Confirm immediately or at the next safe access |
These bands are a practical site triage scheme. A published thermography severity scheme also organizes findings by delta-T, using 1 to 10°C for next-maintenance action, more than 10 to 20°C for scheduling as possible, more than 20 to 40°C for ASAP action, and more than 40°C for immediate corrective action. The published severity classification shows why sites should document the scheme they adopt rather than allowing each analyst to invent a different response.
Applying the bands to switchgear
During a route inspection on 480 V switchgear, an operator finds a warm termination. The first record should include the phase, load, ambient condition, emissivity setting, and reference phase. If the termination is 16°C above its like-for-like reference under a verified load, it fits the plan band in the table above. The work order should state the likely resistive connection fault, the required electrical verification, the planned repair window, and the re-inspection date.
A rising trend can upstage the absolute reading. If the same lug moves from a small difference to a materially larger difference under stable load, the planner should escalate the finding even if the current value remains below the site's critical threshold.
Shift instruction: A pass means comparable components remain within the site's accepted delta-T range under documented conditions. It doesn't mean the hottest component has a low absolute temperature.
False Positives That Trigger Bad Shutdowns and How to Catch Them
A warm component isn't automatically a failed component. The five most common sources of false positives in industrial surveys are solar loading, emissivity error, reflected radiation, wind or forced-air cooling, and transient loading.
Solar loading can heat outdoor cabinets and roof-mounted disconnects unevenly. Polished busbars, terminations, and anodized motor frames can produce incorrect readings when the surface emissivity is wrong. A nearby hot pipe or radiant heater can contaminate a reflective surface. Wind can cool outdoor switchgear and hide a developing rise. A load transient captured between scans can create a thermal pattern that doesn't represent normal operation.
A disciplined verification protocol
Before recommending a shutdown, the analyst should:
- Re-scan at a known and stable load.
- Capture the same component from a different angle.
- Compare it with a like-phase or like-asset reference.
- Check current, voltage, load balance, vibration, or another relevant diagnostic signal.
- Record the original anomaly, the verification result, and the confidence level.
A second angle is especially valuable on reflective metal. If the apparent hotspot changes location as the camera moves, the reading may represent reflected radiation. If the thermal pattern stays fixed on the component and aligns with an electrical or mechanical failure mode, confidence increases.
When a second look is not enough
Verification shouldn't become an excuse to defer a credible high-risk finding. A rapidly rising anomaly under stable load, a severe delta-T, visible damage, odor, arcing evidence, or a critical process dependency may justify immediate operations review. The person with operational authority should decide whether isolation is safe, while the thermographer documents the evidence and limitations.
The industrial thermography review of interpretation risks emphasizes that environmental noise, inconsistent conditions, and poor standardization can create false positives. A thermogram also isn't a direct map of internal temperature, so critical alarms may need confirmation through load checks, ultrasound, vibration, contact measurement, or shutdown inspection.
The cost decision is asymmetric. An unnecessary shutdown consumes production capacity and maintenance resources. A missed loose connection can damage equipment or create a safety event. The verification threshold should therefore depend on asset criticality, consequence of failure, confidence in the image, and the ability to obtain a safe follow-up measurement.
From Periodic Scans to Continuous Monitoring and Follow-Up Inspections
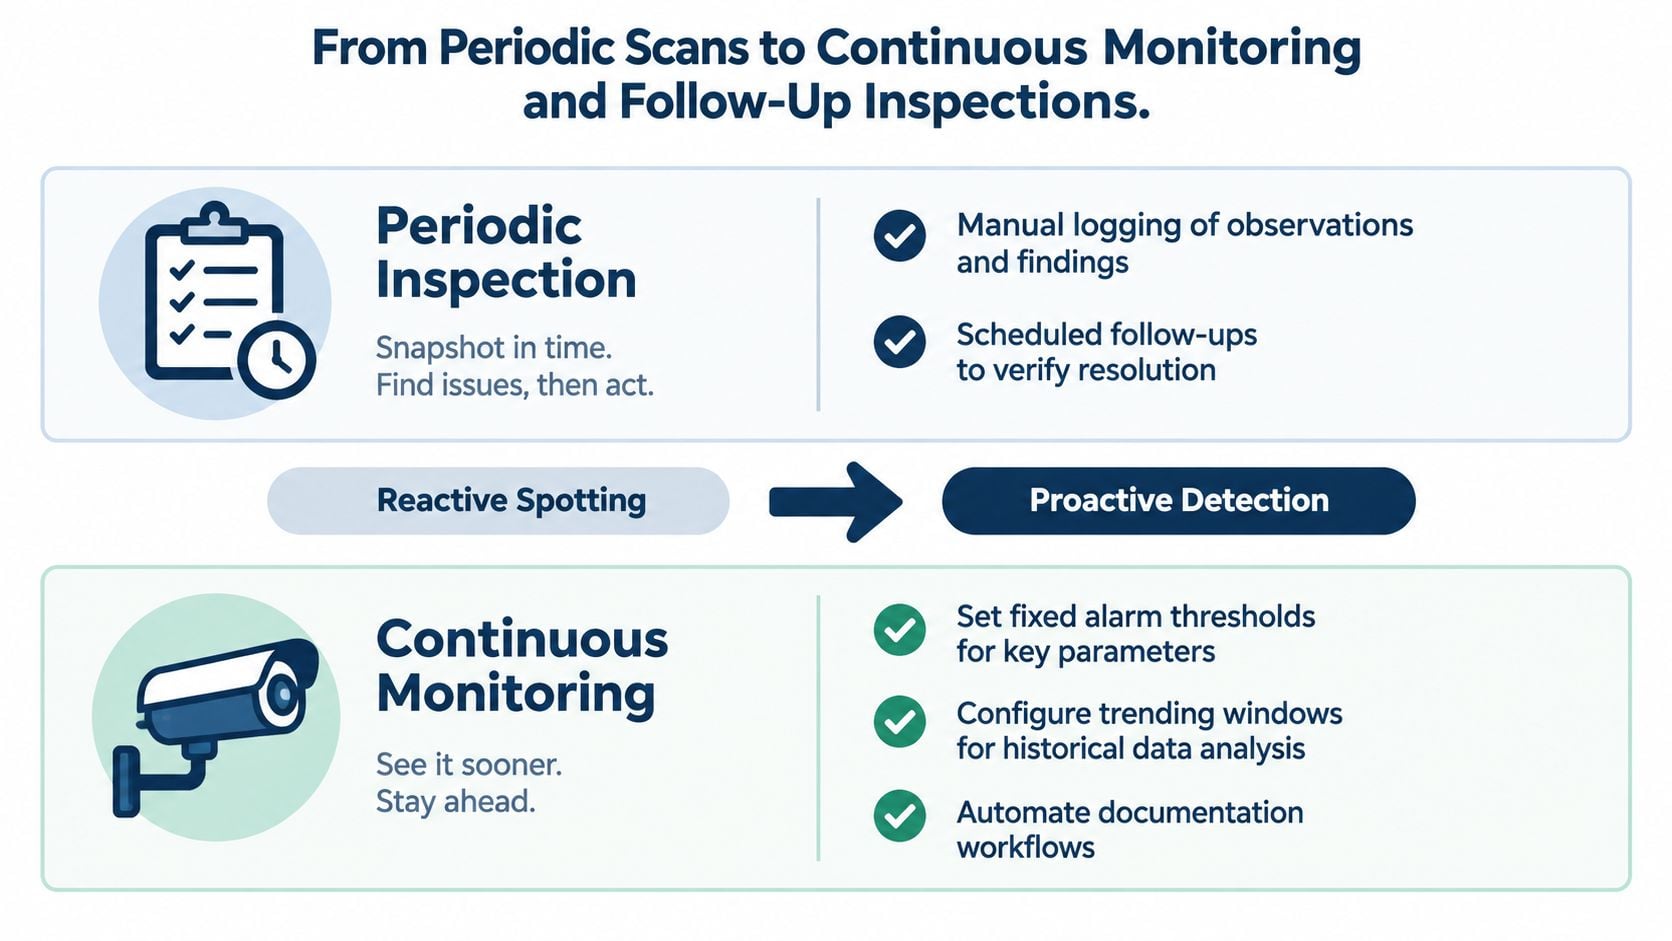
A periodic scan gives the plant a snapshot. A permanently installed temperature device provides a trend, which changes the interpretation problem from “what is hot now?” to “how is this asset changing under comparable conditions?”
Recent standards language allows permanently installed, continuously monitoring temperature measurement devices to satisfy traditional infrared thermography inspection requirements in some contexts, creating a hybrid model rather than eliminating every periodic image. The continuous monitoring guidance for electrical equipment illustrates the operational shift toward fixed sensors, alarm thresholds, and historical trending.
Alarm logic must reflect operating state
A fixed alarm threshold can generate noise if the asset's load changes frequently. Continuous monitoring should therefore use operating context, baseline behavior, escalation rules, and a defined response owner.
- Stable condition: Trend temperature against load and compare the asset with its historical operating envelope.
- Persistent rise: Open a verification task even if the periodic image still appears acceptable.
- Rapid change: Escalate according to asset criticality and safe operating procedures.
- Sensor disagreement: Use a spot-checked radiometric thermogram or secondary diagnostic to determine whether the sensor or equipment changed.
A continuous trend shouldn't automatically replace an image. Spot checks remain valuable for confirming spatial distribution, reflections, surface condition, and whether the sensor is observing the intended component.
Closing the work order
For critical findings, schedule a follow-up within 24 hours. Moderate findings should be rechecked within 30 days, while load changes, repairs, or major maintenance events should trigger a new inspection regardless of the normal route.
A reliability engineer closing a thermography work order should confirm:
- Retest under 50% or greater nameplate load where safe and representative.
- Capture ambient temperature and emissivity values.
- Photograph the panel nameplate.
- Attach the radiometric file.
- Link the finding to the CMMS record.
- State whether the anomaly was corrected, disproved, or placed under continued monitoring.
The load and documentation requirements make the next comparison defensible. They also turn a thermal image into an auditable maintenance decision rather than a file that disappears into a shared folder.
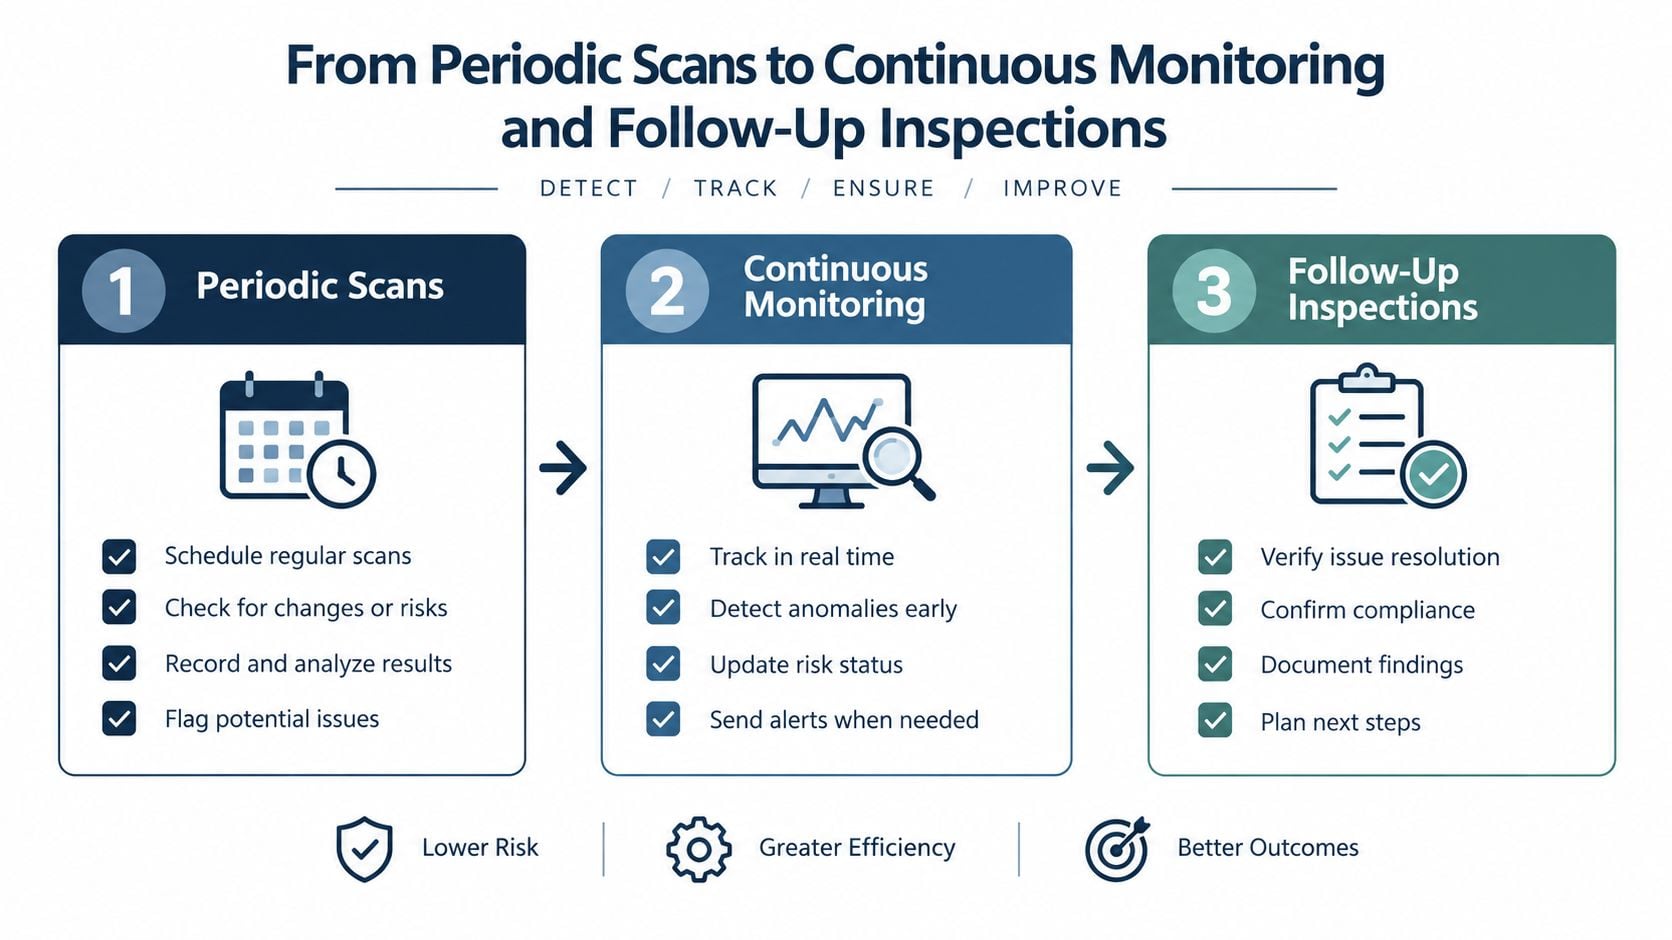
Thermography supports condition-based maintenance when the plant links evidence to action, rather than when it merely increases inspection frequency. A structured condition-based maintenance program can connect thermography with vibration, oil analysis, ultrasound, motor current data, criticality ranking, and CMMS planning.
The complete decision flow is concise:
- Verify the image.
- Read the delta-T in context.
- Classify severity and confidence.
- Trigger the correct action, from trending to safe isolation.
Forge Reliability provides thermographic inspections and broader predictive maintenance support for electrical and mechanical assets, combining thermal findings with other condition-monitoring methods and maintenance planning. Visit Forge Reliability to request a free reliability assessment and identify which assets need better thermal baselines, verification rules, or continuous monitoring.